The transition from Population III to normal galaxies: Ly and He ii 1640 emission and the ionising properties of high redshift starburst galaxies
Using new sets of stellar evolution models at very low metallicities (, ) and previously published grids we examine spectral properties of the ionising continua, the Lyman-break, and the Ly and He ii 1640 recombination lines in starbursts. The metallicity dependence of these properties, especially the transition from primordial galaxies (Population III) to currently observed metallicities, is examined for various IMFs and star formation histories.
For the average properties of starbursts, approximated by a model with constant star formation, the main findings are:
-
•
The Lyman continuum flux increases with decreasing metallicity. For a universal Salpeter IMF from 1–100 M⊙ the enhancement reaches typically a factor of 3 between solar metallicity and Pop III objects.
-
•
While for metallicities the amplitude of the Lyman-break depends little on , a reduction by a factor 2 is found at lower metallicities, due to the strong increase of the average stellar temperature.
-
•
Using theoretical models and empirical constraints we discuss the expected evolution of the hardness of He+ to H ionising photons, , with metallicity and possible uncertainties. Over the metallicity range to the hardness decreases from by 1.5–2 or more orders of magnitude, depending strongly on the upper mass cut-off of the IMF. From empirical constraints we derive a hardness –3.2 to –2.6 for metal-poor starbursts () and softer spectra for higher metallicities. We also provide a simple estimate of the possible impact of hot WR like stars on at very low metallicities ().
-
•
Calibrations for star formation rate determinations from various recombination lines at all metallicities and for various IMFs are derived.
For young bursts the maximum Ly equivalent width is shown to increase strongly with decreasing metallicity from 250–350 Å at 1/50 Z⊙ to 400–850 Å or higher at between and 0 (Pop III) for the same Salpeter IMF. However, for well known reasons, the Ly emission predicted likely represents an upper limit.
Non-negligible He ii 1640 emission due to stellar photoionisation appears to be limited to very small metallicities () and Population III objects.
The predictions, available on the Web through the CDS and at http://webast.ast.obs-mip.fr/sfr/, should be useful for a variety of studies regarding high redshift galaxies, cosmological reionisation, and others.
Key Words.:
Cosmology: early Universe – Galaxies: stellar content – Stars: general – Stars: fundamental parameters – Stars: atmospheres1 Introduction
The discovery of numerous high redshift galaxies provides a unique opportunity to study galaxies in formation in the early Universe. Most of these galaxies show signs of actively ongoing massive star formation, as revealed by their overall spectral appearance, by detailed spectral features, and in many cases by the presence of strong emission lines.
In fact, since the detection of Lyman-break galaxies at 2–4 by colour selection techniques (Steidel et al. 1996, review by Stern & Spinrad 1999), Ly surveys or other search techniques have found a large number of objects at higher redshift showing in most cases intense line emission (e.g. Hu et al. 1998, 1999, Kudritzki et al. 2000, Rhoads & Malhotra 2001, Malhotra & Rhoads 2002, Ellis et al. 2002, Frye et al. 2002, Ajiki et al. 2002). This also includes the most distant galaxy known to date, a lensed galaxy at found through its Ly emission (Hu et al. 2002).
It is possible that such strong line emitters showing also relatively little continuum light may represent the earliest stages of galaxy formation, where small amounts of metals have so far been formed. Strong ongoing star formation and a small dust content, which can suppress Ly emission, would then explain the high observed Ly equivalent widths (cf. Hu et al. 1998). More striking is the suggestion of Malhotra & Rhoads (2002) that the high Ly equivalent widths observed in the LALA survey at could, among other explanations, be due to metal-free (so-called Population III, hereafter Pop III) objects. Possibly we are beginning to probe distant chemically little evolved galaxies, closing the gap between the first (primordial) galaxies and the high (close to solar) metallicities of massive galaxies in the local Universe.
To properly study these objects appropriate spectral models are necessary. They should take into account all possible metallicities, and also probable systematic changes of the stellar initial mass function (IMF) at very low metallicity (Abel et al. 1998, Bromm et al. 1999, Nakamura & Umemura 2001, Hernandez & Ferrara 2001). Providing such model calculations is the main aim of the present work.
Other applications also require an understanding of how properties like line emission and the ionising fluxes of starburst behave in the transition between metal-free (Pop III) objects and metal-poor galaxies with observable counterparts in the local Universe. This is the case in studies addressing the re-ionisation history of the Universe (e.g. Gnedin 1998, Ciardi et al. 2000, review by Loeb & Barkana 2000), especially if account is taken for the simultaneous metal-enrichment (cf. Gnedin & Ostriker 1997, Ferrara & Schaerer 2002). Also, for searches of primordial galaxies, it is of interest to explore how far extreme properties such as strong He ii emission predicted for Pop III starbursts (Tumlinson & Shull 2000, Tumlinson et al. 2001, 2002; Oh et al. 2001, Bromm et al. 2001b, Schaerer 2002) are truly limited to zero metallicity. Our model calculations, including in particular metallicities , , , and higher, allow, for the first time, such investigations.
The present paper is structured as follows. Our models ingredients, including two new sets of stellar evolution tracks at very low metallicity, are described in Sect. 2. The predicted Lyman continuum fluxes and the properties of the Lyman-break at all metallicities are presented in Sects. 4 and 5 respectively. In Sect. 6 we discuss theoretical predictions and empirical constraints on the He+ ionising flux and the hardness of the ionising spectra of starbursts at various metallicities. Finally, quantitative predictions for the Ly and He ii 1640 emission are given in Sect. 7. Section 8 summarises our main conclusions.
2 Model ingredients
The basic model ingredients are identical to those described in Schaerer & Vacca (1998, hereafter SV98) and the Pop III models of Schaerer (2002a, henceforth S02). A brief summary is provided subsequently including the new features introduced in the present work.
2.1 Atmosphere models
Depending on the metallicity different sets of atmosphere models are used.
For metallicities we follow S02 in using the grid of plane parallel non-LTE atmospheres computed with the TLUSTY code of Hubeny & Lanz (1995) for 20000 K and the plane parallel line blanketed LTE models of Kurucz (1991) with a very metal-poor composition ([Fe/H] ) otherwise. Possible uncertainties in the predicted ionising spectra of very metal-poor stars are discussed in S02. In comparison with the computations of S02, the use of an extended grid of TLUSTY models in the present paper leads to some small differences related to the highest energy range considered here.
For higher metallicities we follow SV98 and adopt for O stars the CoStar non-LTE models including stellar winds (Schaerer & de Koter 1997), for Wolf-Rayet (WR) stars the pure He spherically expanding non-LTE models of Schmutz et al. (1992), and Kurucz (1991) models of appropriate metallicity otherwise.
As discussed in earlier publications (e.g. Mihalas 1978, Schaerer & de Koter 1997, Schmutz et al. 1992, Tumlinson & Shull 2000, Kudritzki 2002) the inclusion of non-LTE models is the most important ingredient to obtain accurate predictions for the ionising spectra of massive stars.
2.2 Stellar tracks
To explore a wide range of metallicities covering populations from zero metallicity (Pop III), over low metallicities () such as observed in H ii regions in the local Universe, up to solar metallicity (), we use the following stellar evolution tracks: 1) the Pop III tracks covering masses from 1 to 500 M⊙ with no/negligible mass loss compiled in S02 (Marigo et al. 2001, Feijóo 1999, Desjacques 2000), 2) new main sequence stellar evolution tracks from 1 to 500 M⊙ computed with the Geneva stellar evolution code for , 3) non-rotating stellar models from 2 to 60 M⊙ from Meynet & Maeder (2002) complemented with new calculations for 1 M⊙ and 85–500 M⊙ for , 4) non-rotating Geneva stellar evolution tracks for masses 0.8–120 M⊙ (up to 150 M⊙ for ) from the compilation of Lejeune & Schaerer (2001) for the remaining metallicities 0.0004, 0.001, 0.004, 0.008, 0.02 (Z⊙), and 0.04. For massive stars we have adopted the high mass loss tracks in all cases, as these models reproduce best various observational constraints from the local Universe (cf. Maeder & Meynet 1994).
Our calculations at include only the H-burning phase. As He-burning is typically less than 10 % of the main sequence lifetime, and is generally spent at cooler temperature, neglecting this phase should have little or no consequences on our predictions. A possible exception may be if stars at very low are very rapid rotators (cf. Maeder et al. 1999) which could suffer from non-negligible rotationally enhanced mass loss and could therefore become hot WR-like stars (cf. Sect. 6.2).
To verify our new computations we have compared several tracks with the independent calculations of Meynet & Maeder (2002) done with a strongly modified version of the Geneva stellar evolution code. Good agreement is found regarding the zero age main sequences (ZAMS), H-burning lifetimes, and the overall appearance of the tracks.
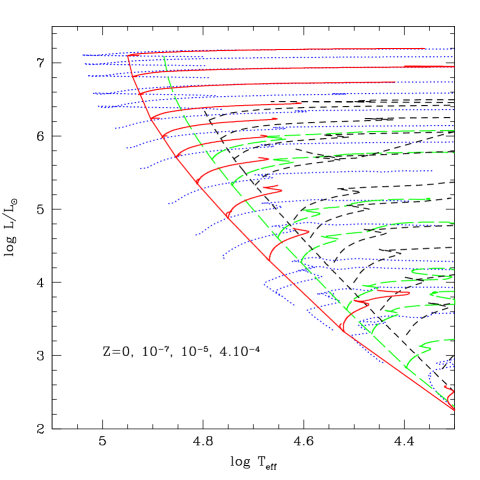
The HR-diagram showing the main sequence tracks at very low metallicity is given in Fig. 1. As expected one finds an important shift of the ZAMS and main sequence toward hotter with decreasing . For massive stars the trend shown by the low tracks is expected to continue down to a limiting metallicity of the order of , below which the stellar properties essentially converge to those of metal-free (Pop III) objects. This is the case, as massive stars ( 50 M⊙) with will rapidly build up a mass fraction to of CNO during pre main sequence contraction or the early main sequence phase (e.g. El Eid et al. 1983, Marigo et al. 2001). A typical value of will be adopted subsequently for various simplified models fits.
2.3 Evolutionary synthesis models
As described in S02 the above stellar atmosphere models and evolutionary tracks have been included in the evolutionary synthesis code of Schaerer & Vacca (1998). Using the prescriptions summarised below we compute the predicted properties of integrated stellar populations at different metallicities for instantaneous bursts and constant star formation, the two limiting cases of star formation histories.
| Line | appropriate | ||
|---|---|---|---|
| 30 kK | 10 kK | ||
| Ly | |||
| He ii 1640 | |||
| H |
2.3.1 Nebular emission
Among other predictions the code in particular computes the recombination line spectrum including Ly, He ii 1640, He ii 3203, He i 4026, He i 4471, He ii 4686, H, He i 5016, He i 5876, and H. Case B recombination is assumed for an electron temperature of K at and K otherwise, and a low electron density ( cm-3). Ly emission is computed assuming a fraction of 0.68 of photons converted to Ly (Spitzer 1978). The line emission coefficients (defined by Eq. 7) of interest here are listed in Table 1.
Some differences, e.g. due to a more realistic temperature structure or due to collisional effects on H lines, can be expected between the adopted prescriptions and predictions from detailed photoionisation models (see e.g. Stasińska & Tylenda 1986, Stasińska & Schaerer 1999). However, for the scope of the present investigation these effects can quite safely be neglected.
As shown by S02 the inclusion of nebular continuous emission processes is crucial for very metal-poor objects with intense ongoing star formation. Following S02 we include free-free, free-bound, and H two-photon continuum emission assuming K or 10000 K and the above value of .
| Model ID | Mlow | Mup | |
|---|---|---|---|
| A | 1 | 100 | 2.55 |
| B | 1 | 500 | 2.30 |
| C | 50 | 500 | 14.5 |
2.3.2 Initial mass function
In view of our ignorance on the massive star IMF at very low metallicities () we adopt as in S02 a powerlaw IMF and different upper and lower mass limits with the aim of assessing their impact on the properties of integrated stellar populations. The main cases modeled here are summarised in Table 2 111For comparison with SFR indicators used for “normal” galaxies we also indicate the mass conversion factor expressing the relative masses between our model IMF and a “standard” Salpeter IMF with Mlow 0.1 and Mup 100 M⊙ used frequently throughout the literature. is given by .. For all models the IMF slope is taken as the Salpeter value ( 2.35) between the lower and upper mass cut-off values Mlow and Mup respectively.
The model A IMF is a good description of the IMF in observed starbursts (e.g. Leitherer 1998, Schaerer 2002b) down to 1/50 Z⊙ (), the metallicity of I Zw 18 representing the most metal-poor galaxy known to date. It is adopted in all calculations for . IMFs B and C, favouring the formation of very massive stars, could be representative of stellar populations at metallicities (e.g. Bromm et al. 2001a), where altered fragmentation properties may form preferentially more massive stars (cf. Abel et al. 1998, Bromm et al. 1999, Nakamura & Umemura 2001). The computations at consider all IMF cases (A, B, and C). Note that our calculations obviously do not apply to cases where only one or few massive stars form within a pre-galactic halo, as suggested by the simulations of Abel et al. (2002).
3 Overview of EUV–UV spectra of starbursts at various metallicities
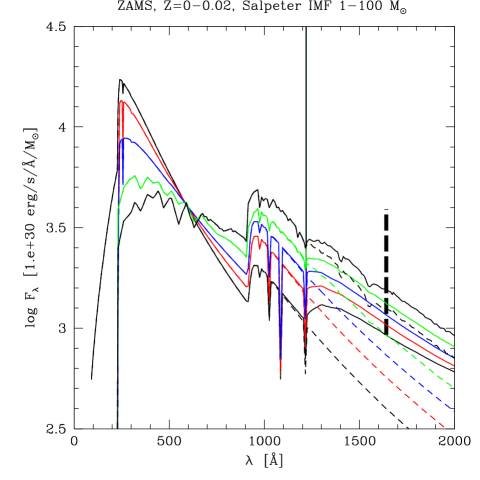
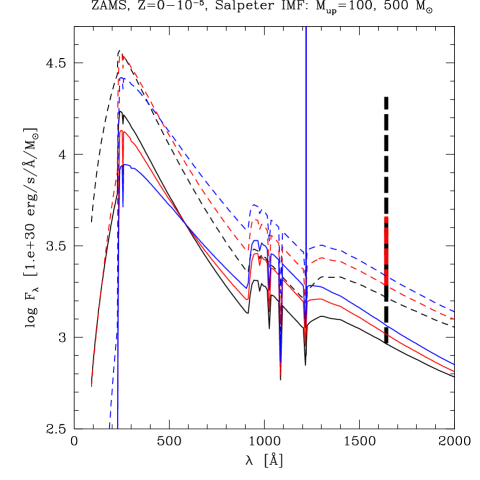
To illustrate several points discussed in detail below, we plot the EUV to UV spectral energy distribution (SED) for selected models at different metallicities and computed with different IMFs (see Fig. 2). Only ZAMS models are shown here for simplicity sake.
The main points apparent from this Figure are:
- •
-
•
The increase of the Lyman-break amplitude with increasing (Sect. 5).
-
•
The rapid decrease of the contribution of nebular continuous emission to the UV continuum flux (cf. S02).
- •
The metallicity dependence of the emission lines (strongest in the Pop III models) cannot clearly be discerned from this figure. It is discussed in Sect. 7.
4 Ionising properties of starbursts at various metallicities
| IMF | ||||||
| [log((photon s-1)/(M⊙ yr-1))] | ||||||
| 0. | A | 46.98 | 46.75 | 45.54 | 46.22 | |
| 0. | B | 47.29 | 47.10 | 46.26 | 46.40 | |
| 0. | C | 47.98 | 47.80 | 47.05 | 46.96 | |
| A | 46.94 | 46.65 | 43.45 | 46.36 | ||
| B | 47.30 | 47.06 | 45.61 | 46.55 | ||
| C | 48.01 | 47.78 | 46.39 | 47.14 | ||
| A | 46.90 | 46.55 | 42.39 | 46.44 | ||
| B | 47.30 | 46.99 | 44.56 | 46.64 | ||
| C | 48.02 | 47.73 | 45.35 | 47.24 | ||
| 0.0004 | A | 46.88 | 46.43 | 43.4 | 46.45 | |
| 0.0004 | A⋆ | 47.01 | 46.58 | 43.62 | 46.53 | |
| 0.001 | A | 46.86 | 46.41 | 43.44 | 46.47 | |
| 0.004 | A | 46.85 | 46.38 | 43.41 | 46.50 | |
| 0.008 | A | 46.84 | 46.35 | 43.67 | 46.52 | |
| 0.020 | A | 46.85 | 46.34 | 43.72 | 46.54 | |
| 0.040 | A | 46.87 | 46.33 | 43.71 | 46.59 | |
| ⋆: Salpeter IMF with Mup=150 M⊙ and Mlow=1 M⊙ | ||||||
4.1 Burst models
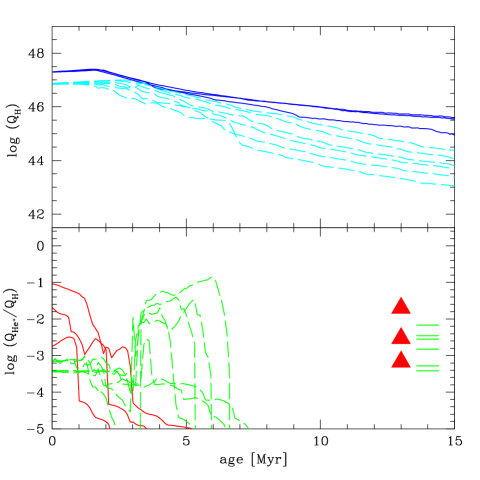
The basic quantities describing the ionising spectrum are the emitted number of H, He, and He+ ionising photons, denoted by , and respectively, and the hardness () tracing the energy range between 54 (24.6) and 13.6 eV. The predicted temporal evolution of is shown in Fig. 3 (upper panel) for all metallicities between and . For the very low metallicities () only the models with an IMF extending to 500 M⊙ (model B) are shown for clarity sake. Adopting a larger value of Mup affects only the predictions at very young ages (ages 2.5 Myr) due to very short lifetime of these stars.
The predicted of ZAMS populations (age=0) for all IMF cases are listed in Table 3. For completeness with S02 the photon flux in the Lyman-Werner band (11.2–13.6 eV) capable to dissociate H2 is also listed.
The main difference in the Lyman continuum photon output at different is a slower decline of the ionising photon production at low metallicities, due to the blueward shift of the main sequence. The temporal evolution of at is essentially undistinguishable from the Pop III case. The larger apparent for at ages 2.5 Myr are essentially due to the larger value of Mup adopted at very low Z. The difference at older ages (when stars with masses 100 M⊙ have disappeared) represents the pure metallicity difference.
As can be seen from Table 3 the production of ZAMS populations at different metallicities increases somewhat with decreasing ; the changes remain fairly small ( 40 %) in reasonable agreement with other estimates (e.g. Tumlinson & Shull 2000). However, in cases such as constant star formation (equivalent to a temporal average) the -dependence is more pronounced (cf. Sect. 4.2).
4.2 Constant star formation
The main predictions for models with constant star formation at all metallicities and for all the IMF cases are listed in Table 4. In this case most quantities of interest here reach rapidly (over timescales 6–10 Myr; except for the Lyman-break and requiring 200 Myr) an equilibrium value given in the table, normalised to a star formation rate (SFR) of 1 M⊙ yr-1. In addition to the ionising photon production (cols. 3-5), and the photodissociating photon flux (, col. 6), we list the average energies and of the Lyman continuum photons and the photons with energies above 54 eV (cols. 7 and 8). These quantities, not further discussed here, are e.g. of interest to estimate the thermal evolution of the ISM. Most of the data for , 0.0004, an 0.02 were already given in Table 3 of S02. Due to the use of a finer grid of atmosphere models at some small changes are found for these models222 and the corresponding are reduced by 9, 4, and 30 % for IMFs A, B, and C respectively.. The values in Table 4 supersede those of S02.
As expected from the earlier discussion (see Fig. 3), the Lyman continuum flux shows an increase with decreasing metallicity, which can be fitted to an accuracy better than 10 % by
| (1) |
valid for the Salpeter IMF from 1–100 M⊙ (models A) and . The limitation to is due to the fact that all metallicities below are equivalent to the Pop III () case, as discussed in Sect. 2.2. Fits for alternate IMFs may be derived from the data in Table 4.
Overall, while ZAMS Lyman continuum fluxes vary by less than 40 % over the entire metallicity range for IMF A (Table 3), the ionising output at SFR shows an increase of an factor 1.9 (2.8) between solar and 1/50 Z⊙ (zero metallicity). Even larger increases are of course predicted in the case of IMFs extending to higher masses (models B and C).
| IMF | ||||||||||
| [log((photon s-1)/(M⊙ yr-1))] | [eV] | [erg s-1] | ||||||||
| 0. | A | 53.81 | 53.50 | 51.49 | 53.57 | 26.61 | 66.08 | 6.80e+42 | 7.91e+41 | 1.74e+40 |
| 0. | B | 53.93 | 53.64 | 52.23 | 53.57 | 27.78 | 68.15 | 8.86e+42 | 1.03e+42 | 9.66e+40 |
| 0. | C | 54.44 | 54.19 | 53.03 | 53.65 | 29.60 | 68.22 | 2.85e+43 | 3.32e+42 | 6.01e+41 |
| A | 53.80 | 53.43 | 50.39 | 53.67 | 25.18 | 61.68 | 6.59e+42 | 7.67e+41 | 1.40e+39 | |
| B | 53.95 | 53.61 | 51.42 | 53.69 | 25.99 | 64.86 | 9.26e+42 | 1.08e+42 | 1.49e+40 | |
| C | 54.51 | 54.21 | 52.21 | 53.84 | 27.16 | 64.80 | 3.34e+43 | 3.89e+42 | 9.29e+40 | |
| A | 53.70 | 53.26 | 48.71 | 53.65 | 23.95 | 59.62 | 5.15e+42 | 5.99e+41 | 2.91e+37 | |
| B | 53.88 | 53.48 | 50.71 | 53.69 | 24.74 | 61.77 | 7.82e+42 | 9.10e+41 | 2.88e+39 | |
| C | 54.49 | 54.13 | 51.50 | 53.97 | 25.61 | 61.77 | 3.20e+43 | 3.73e+42 | 1.82e+40 | |
| 0.0004 | A | 53.63 | 53.10 | 50.08† | 53.74 | 21.62 | 52.60† | 4.38e+42 | 5.10e+41 | 6.79e+38† |
| 0.0004 | A⋆ | 53.70 | 53.20 | 50.42† | 53.75 | 21.96 | 61.54† | 5.22e+42 | 6.08e+41 | 1.50e+39† |
| 0.001 | A | 53.59 | 53.04 | 50.17† | 53.72 | 21.47 | 60.38† | 4.01e+42 | 4.67e+41 | 8.39e+38† |
| 0.004 | A | 53.50 | 52.93 | ¶ | 53.67 | 21.27 | ¶ | 3.37e+42 | 4.36e+41 | ¶ |
| 0.008 | A | 53.44 | 52.83 | ¶ | 53.63 | 20.90 | ¶ | 2.89e+42 | 3.73e+41 | ¶ |
| 0.020 | A | 53.36 | 52.75 | ¶ | 53.56 | 20.84 | ¶ | 2.44e+42 | 3.16e+41 | ¶ |
| 0.040 | A | 53.28 | 52.65 | ¶ | 53.49 | 20.88 | ¶ | 2.00e+42 | 2.59e+41 | ¶ |
| ⋆: Salpeter IMF with Mup=150 M⊙ and Mlow=1 M⊙ | ||||||||||
| †: uncertain predictions for reasons discussed in Sect. 6 | ||||||||||
| ¶: no data provided, as predictions uncertain and strongly overestimated (cf. Sect. 6) | ||||||||||
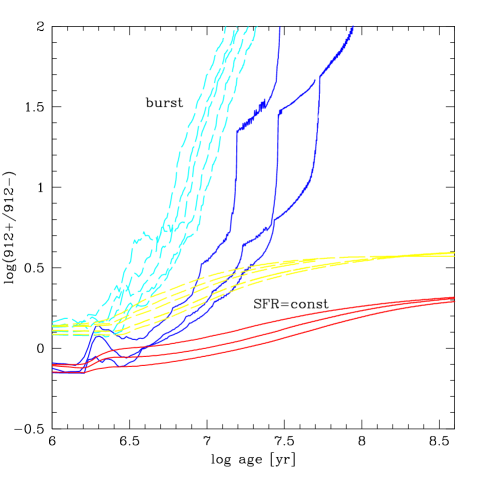
5 Lyman-break predictions at various metallicities
Quantitative predictions of the amplitude of the Lyman-break, i.e. the relative flux above and below the Lyman edge are of importance for example to estimate the escape fraction of ionising photons out of their hosts. Such measurements are possible in relatively nearby ( 0.015) and high redshift galaxies (e.g. Leitherer et al. 1995, Deharveng et al. 1997, 2001, Steidel et al. 2001).
Different working definitions of the Lyman-break exist in the literature. For simplicity we chose the definition adopted in Starburst99 (Leitherer et al. 1999), quantifying the break amplitude by 912+/912-, where 912+ is the average flux in units over the interval 1080–1120 Å, and 912- the average over 870–900 Å. A word of caution is appropriate if wavelengths are used as reference for the red side of the Lyman-break. In this case the continuum may, for very metal-poor objects, include a non negligible contribution from nebular continuous emission (see S02) which itself also depends on the escape fraction of Lyman continuum photons. A detailed SED fit should then be undertaken to quantify .
The temporal evolution of the Lyman-break predicted by the models at metallicities is shown in Fig. 4 for instantaneous bursts and constant star formation. The main finding apparent here is the overall reduction of the Lyman-break at metallicities , e.g. by 0.2–0.3 dex at very young ages, for identical IMFs or larger values of Mup. 333IMFs A and B yield Lyman-break amplitudes differing by less than 0.1 dex. This is due to the decrease of the break in individual stars with increasing and to the shift of the main sequence towards hotter temperatures. At higher metallicity () this temperature/metallicity dependence is not important, and e.g. the predicted values at SFR (near equilibrium at yr) vary by less than 10 % around 0.58. In contrast for very low metallicities one has for the same case 0.3–0.4 for the IMFs A and B.
Note that, as expected, at our predictions at young ages are somewhat ( 0.1 dex) smaller than the Starburst99 models for identical and IMF, due to the inclusion of non-LTE O star model atmospheres in the present computations. For constant star formation this difference becomes, however, smaller. We also compared our calculations to the models of Smith et al. (2002; Norris, private communication) including more sophisticated non-LTE stellar atmospheres. For metallicities and SFR their Lyman-break predictions show an additional but small ( 10-20 %) reduction.
6 The hardness of starbursts at various metallicities
6.1 Predictions at metallicities 0 to Z⊙
6.1.1 Burst models
The time evolution of the predicted hardness is shown in the lower panel of Fig. 3. The corresponding hardness reached at equilibrium in the case of constant star formation (cf. below), plotted on the right, illustrates the non negligible difference with the hardness derived from a simple ZAMS population neglecting stellar evolution effects (cf. S02).
Note that predicted quantities such as , rely obviously strongly on the adopted value of Mup. For the very low this quantitative dependence can be estimated from the tabulated ZAMS properties (Table 3).
As expected from the strong decrease of the stellar temperatures with increasing metallicity (cf. Fig. 1) both the maximum hardness (at age=0) and the overall decreases for between 0 and . The typical timescale for a decrease of by 2 dex in a burst is driven by the redward stellar evolution, and is short ( 2–3 Myr), with obvious potential implications for the detection of sources with very hard spectra (cf. Sect. 7). Possible additional sources of He+ ionising photons not included here are discussed in Sect. 6.2.
At higher metallicities () the present models predict a re-increase of after 3–4 Myr, due to presence of WR stars, among which a fraction is found at high temperatures (cf. Schmutz et al. 1992, SV98). Albeit with minor quantitative differences, a qualitatively similar behaviour is predicted by the Starburst99 models based on very similar input physics (Leitherer et al. 1999). However, these predictions depend especially on the procedure adopted to link stellar tracks with atmospheres in WR phases with strong winds, and on the neglect of line blanketing in the adopted WR model atmospheres. The reality and the extent of such a trend remains therefore questionable, especially at the largest metallicities (cf. review of Schaerer 2000). Indeed using recent line blanketed O and WR atmospheres and different prescriptions to connect the interior and atmosphere models Smith et al. (2002) find a considerably softer spectrum – i.e. reduced – before and during the WR phase. To circumvent this theoretical uncertainty we will subsequently derive an empirical estimate of the hardness at metallicities (Sect. 6.3).
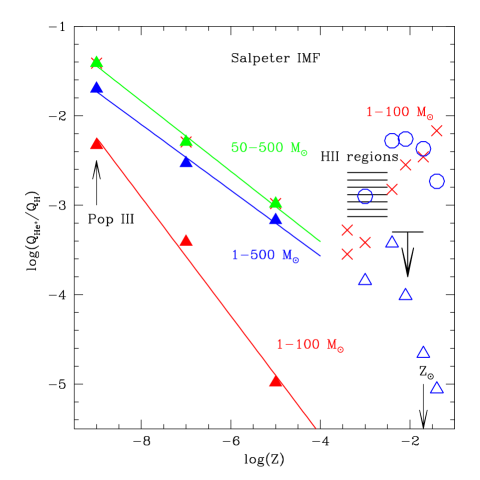
6.1.2 Constant star formation
For the case of constant star formation at equilibrium the metallicity dependence of the hardness of the ionising flux is shown in Fig. 5 for all the IMFs considered. As apparent, for the very metal-poor cases () can be well fitted by
| (2) |
with the numerical coefficients listed in Table 5, again taking into account that all metallicities are equivalent.
At higher metallicities — in the range of known objects — the theoretical predictions for are probably less clear, due to possible presence of hot WR stars, difficulties in their modeling (cf. above), and the neglect of non-stellar emission processes which could contribute especially to . Indeed as shown in Fig. 5 rather important differences are obtained between various evolutionary synthesis models (SV98, Starburst99 of Leitherer et al. 1999, and the latest computations of Smith et al. 2002). In the metallicity range to our empirical estimate of (Sect. 6.3), also shown on this Fig., is likely more reliable than the models. At still larger the average ionising spectrum of starbursts should be softer, as indicated by the tentative empirical upper limit and predicted by the Smith et al. (2002) models.
6.2 Uncertainties on the He+ ionising flux at very low metallicities ()
In contrast to the Lyman continuum flux , the He+ ionising flux (and in general spectral features at high energy) show a very strong dependence on the stellar temperature in the range 50–100 kK typical of very low metallicity stars (Fig. 2 in S02). Therefore their prediction is naturally more sensitive to even small modifications of the exact stellar or evolutionary scenario.
For example, one may wonder how reliable the above predictions of the metallicity dependence of (Fig. 5) are at , where presently no observational constraints are available. In fact, studies of massive stars in the Local Group suggest that their average rotation rates increase towards low (Maeder et al. 1999), which – when combined with their increased compactness – can lead to non-negligible mass loss despite the low metallicity (Maeder & Meynet 2000, Meynet & Maeder 2002). If this effect is large enough, one could imagine that fast rotators could loose sufficient mass to follow a WR star like evolution leading possibly to a He/C/O core at temperatures 100 kK, a scenario known for metal-rich massive WR (e.g. Maeder & Meynet 1988). Despite high rotational velocities, the detailed calculations of Meynet & Maeder (2002) for do not show important alterations of the evolution for stars with 60 M⊙. Exploratory calculations of Marigo et al. (2002) for Pop III stars treating in an simplified manner the effects of rotation on stellar mass loss find such a scenario for stars with initial mass 750 M⊙.
Quantitatively the effect of such a putative hot “WR-like” population on the hardness of the ionising flux can be estimated for the case of constant star formation only in the following way. Suppose that stars of given initial mass spend this phase at constant luminosity and (hot) temperature during a constant fraction of their lifetime . Assuming their winds are optically thin at 54 eV, the He+ flux in this phase is then
| (3) |
where is the photon flux per unit surface area (cf. Fig. 2 in S02). The hardness of a population including both the “normal” (main sequence) population and the additional hot population can be approximated by (for SFR)
| (4) |
assuming small changes in the total Lyman continuum photon output . Here the first term stands for the unperturbed “normal” hardness shown in Fig. 5. The second term describes the additional contribution due to hot WR-like objects, which can be expressed as
| (5) |
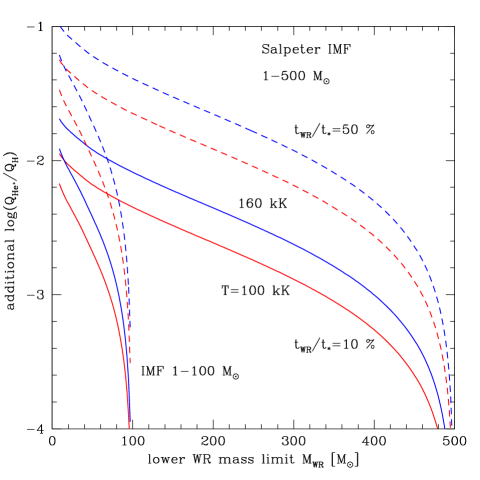
where is the lifetime average of the Lyman continuum production, and is the IMF. The quantities and are taken from S02, and we assume as first approximation a luminosity corresponding to the ZAMS444The results discussed below are fairly insensitive to the exact (low) metallicity adopted for these quantities.. The hardness contribution is then computed assuming temperatures 100–160 kK as expected from stellar evolution models, and durations of 0.1 or 0.5. The result is plotted for the IMFs A and B (Mup=100 and 500 M⊙) in Fig. 6 as a function of the minimum mass , above which all stars are assumed to reach this hot “WR” phase.
The case of 50 %, which would require very strong mass loss already during the main sequence or a nearly homogeneous evolution leading early to a blueward evolution, appears extremely unlikely and is shown here to mimic the “strong mass loss” models adopted in the Pop III models of S02. For a hot phase of a duration typical of the post main sequence evolution ( 10 % of total lifetime) Fig. 6 shows that such putative “hot WR” could in the “best” case contribute an additional hardness of the order of , comparable to the hardness of normal stellar populations with metallicities (cf. Fig. 5). To examine how realistic such cases may be, will require a detailed understanding of the coupled processes of stellar mass loss, rotation, and internal mixing. At present the available limits are 60 M⊙ at and 10 % from the rotating stellar models of Meynet & Maeder (2002), and 750 M⊙ at from the simplified models of Marigo et al. (2002).
Although the above exercise shows that at very low metallicity () the hardness due to stellar sources could be higher than shown in Fig. 5, it seems that such scenarios are quite unlikely. If star formation takes place on much longer time scales, and massive stars would not form (or in much smaller quantities), hot planetary nebulae could also be a source of hard ionising photons, as illustrated by the scenario of Shioya et al. (2002). In any case, a major uncertainty stems from our limited knowledge of the IMF at very low metallicities.
| IMF | a | b |
|---|---|---|
| A | -0.66 0.071 | -8.22 0.51 |
| B | -0.37 0.028 | -5.04 0.20 |
| C | -0.39 0.028 | -4.98 0.20 |
6.3 Empirical constraints on the He+ ionising flux of starbursts at
Spectroscopic observations of extra-galactic giant H ii regions probing He ii recombinations lines can yield empirical information on the “average” hardness of starbursts. Indeed it is well known that a fairly large fraction of metal-poor H ii regions show the presence of nebular He ii 4686 emission indicative of a hard ionising spectrum (see e.g. Guseva et al. 2000, compilation of Schaerer et al. 1999). A complete explanation of the origin of the required high energy photons (shocks, X-rays, WR stars) remains to be found (e.g. Garnett et al. 1991; Schaerer 1996, 1998; Guseva et al. 2000, Izotov et al., 2001, Stasińska & Izotov 2002).
The largest sample of high quality data is that of Izotov and collaborators (cf. Guseva et al. 2000 and references therein), which shows He ii 4686 detections with typical relative intensities of 1–2 %.
From such a sample we may estimate an average hardness from
| (6) |
where (0.47 (0.63) for 10000 (30000) K) translates the relative line emissivities, is the fraction of objects showing nebular He ii among the spectra of sufficient quality to allow detections down to this intensity level, is the age range covered by the observed H ii regions, and is the total lifetime of H ii regions. Inspection of the data of Izotov yields 1/3–1/2 for metallicities and possibly even a larger fraction at the lowest observed metallicities. (Stasińska & Izotov 2002). One has 10 Myr, the typical H ii region lifetime or the time over which bursts show detectable line emission. However, it is now well established that H ii region samples suffer from selection biases leading to an absence of advanced bursts, or in other words a preferential selection of bursts with ages younger than 4–5 Myr (e.g. Bresolin et al. 1999, Raimann et al. 2000, Moy et al. 2001, Stasińska et al. 2001). For this range of values and one obtains an estimate of –3.2 to –2.6. Postulating the extreme case that additionally the first 2 Myr of the H ii phase are also not detected in the optical555The well known absence of H ii regions with very large H equivalent widths could be taken as an indications for such a scenario. one has a minimum value of 1 Myr, yielding a lower limit of –3.5. In principle this average value could be even larger as the (conservative) assumption of implies that older (non-detected) H ii regions have no He+ ionising flux.
This estimate is obviously independent of the nature of the hard (He+) ionising radiation. By construction Eq. 6 provides an estimate of the average expected in objects with constant ongoing star formation for metallicities to . The near absence of nebular He ii detections in H ii regions at higher metallicity (cf. Schaerer 1998, Guseva et al. 2000) indicates softer spectra. However, it is difficult to establish a firm upper limit on for . We here retain as a tentative limit.
6.4 Overall behaviour of with metallicity
In short, from the considerations above, we find the following two cases for the most plausible metallicity dependence of the average hardness ratio of starbursts with metallicity (see Fig. 5).
1) If a universal Salpeter like IMF with a “normal” upper mass limit of 100 M⊙ prevails for all metallicities the hardness decreases by more than 2 orders of magnitude from to , re-increases thereafter (up to , in metal-poor starbursts) to a level 2 to 10 times smaller than that of Pop III objects, and decreases again to low levels for higher metallicities.
2) If very massive stars are favoured at metallicities , the hardness of Pop III objects is considerably enhanced (corresponding to a powerlaw spectrum with spectral index 2.3–2.8 in ), then decreases down to levels somewhat smaller or comparable to that of metal-poor starbursts, before decreasing further to levels at least two orders of magnitude softer than at zero metallicity.
7 Ly and He ii 1640 emission at various metallicities
To first order recombination line luminosities are proportional to the ionising photon flux and are thus simply expressed as (in units of erg s-1)
| (7) |
where are the line emission coefficients given in Table 1, is the photon escape fraction out of the galaxy or observed aperture, and is the ionising photon flux (in units of s-1) corresponding to the appropriate recombination line.
However, as well known Ly constitutes a particular case due to its very large line optical depth, which implies that several effects (e.g. dust absorption, ISM geometry and velocity structure) can alter the total Ly emission and lead to complex line profiles (cf. Charlot & Fall 1993, Valls-Gabaud 1993, Chen & Neufeld 1994, Kunth et al. 1998, Loeb & Rybicki 1999, Tenorio-Tagle et al. 1999). Furthermore for Ly source at redshifts close to or above the redshift of reionisation the intrinsic Ly emission may be further reduced or suppressed by absorption in nearby line of sight HI clouds (cf. Miralda-Escude & Rees 1997, but also Haiman 2002, Madau 2002). A proper treatment of these effects requires a complex solution of radiation transfer which depends strongly on geometrical properties of the ISM and IGM, and for which no general solution is possible. One must thus caution that depending on the application our simplifying assumptions may not apply and the predicted Ly emission should thus be considered as an upper limit. Note that these difficulties do not affect other recombination lines such as H and He ii 1640, whose optical depth is strongly reduced compared to Ly.
Bearing the above in mind, the time evolution of the Ly and He ii 1640 line luminosities can be deduced from the evolution of and respectively given in Fig. 3.
In the case of constant star formation, at equilibrium, recombination line luminosities are proportional to the star formation rate (SFR), i.e.
| (8) |
For in erg s-1 the proportionality constants for Ly, H, and He ii 1640 are listed in columns 9–11 of Table 4. The variations of the ionising flux already discussed above imply in particular lower star formation rates at low metallicity when identical recombination lines are used. We note that our H SFR conversion factors are in good agreement with other computations at various metallicities (e.g. Kennicutt 1998, Sullivan et al. 2001) when rescaled for their Mlow using (Table 2).
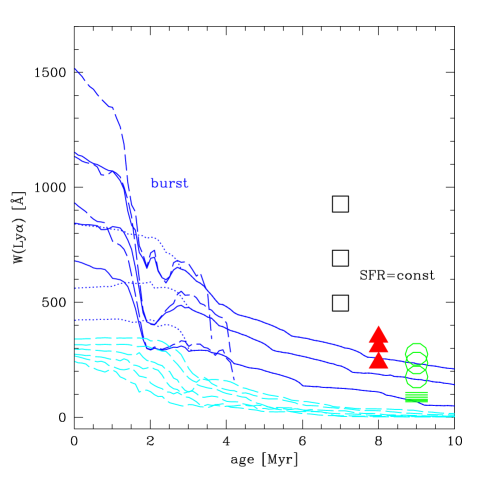
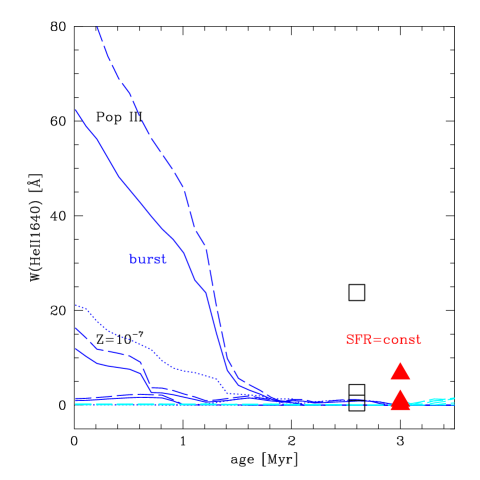
The predicted Ly and He ii 1640 emission line equivalent widths of ageing bursts of different metallicities and all the IMF cases considered are shown in Fig. 7. Note that our revised Pop III models show smaller Ly equivalent widths compared to the previous calculation in S02. This is due to an erroneous continuum definition in the earlier computations. The new models supersede those of S02. Good agreement is also found with the predictions of Tumlinson et al. (2002). The reader is also reminded that none of these recent calculations include stellar Ly absorption (cf. Valls-Gabaud 1993, Charlot & Fall 1993, and Valls-Gabaud & Schaerer 2002 for new predictions).
Maximum Ly equivalent widths of 240–350 Å are predicted for metallicities between solar and . For down to zero (Pop III), max may reach up to 800–1500 Å for the various adopted IMFs (cf. S02) For comparison, the equilibrium values for SFR= are in the range of 175–275, 240–350, 500–930 Å for IMF A, B, and C respectively at , and 70–100 Å for higher metallicities (IMF A). Note that the increased Lyman continuum output of young very metal-poor populations alone does not explain the strong increase of (cf. Table 3). In addition the reduced stellar UV continuous luminosity at 1215 Å, due to the shift of the SED peak far into the Lyman continuum (Fig. 2), also contributes to increase W(Ly).
A high median Ly equivalent width ( 430 Å) was found in the Large Area Lyman Alpha (LALA) survey of Malhotra & Rhoads (2002) at and interpreted as due to AGN, starbursts with flat IMFs, or even Pop III objects. Indeed, if constant star formation is appropriate for their objects and the IMF slope is universally that of Salpeter, the observed large would require very metal-poor populations with large upper mass cut-offs and/or an increased lower cut-off (e.g. IMFs B or C). Alternatively their observations could also be explained by predominantly young bursts, with metallicities and no need for extreme IMFs (Fig. 7). This issue will be addressed in detail in a subsequent publication (Valls-Gabaud & Schaerer 2002).
As expected from the softening of the radiation field with increasing metallicity, the He ii 1640 equivalent widths decreases strongly with ; values He ii 1640 5 Å are expected only at metallicities , except if hot WR-like stars (cf. Sect. 6.2) or non-stellar sources (e.g. X-rays, AGN) provide sufficient amounts of He+ ionising photons.
Part of the relative weakness of He ii 1640 compared to is due to a relatively strong, mostly nebular, continuum flux at 1640 Å (see S02). As Ly emission may be strongly reduced due to the effects discussed earlier in objects beyond the re-ionisation redshift, and the He ii 1640 luminosity is potentially strong enough to be detected (cf. Tumlinson et al. 2001, Oh et al. 2001, Schaerer & Pelló 2001), it is a priori not clear if both lines may be observed simultaneously and if so which of the two lines would be stronger.
8 Conclusions
We have examined the spectral properties of the ionising continua, the Lyman-break, and the Ly and He ii 1640 recombination lines in starbursts with metallicities from zero – corresponding to primordial, Pop III objects – over low metallicities () observed in nearby galaxies, up to solar metallicity (Z⊙0.02).
Our computations, including new sets of stellar evolution models at very low metallicities (, ) and previously published grids at other , allow us in particular to study how spectral properties vary in the transition from Pop III objects to “normal” currently measurable metallicities.
Various IMFs are treated, including also cases where very massive stars (up to M⊙) are formed, as suggested by hydrodynamical calculations for metallicities (Bromm et al. 2001a, Abel et al. 1998, Nakamura & Umemura 2001).
Predictions are provided for the number of H, He0, and He+ ionising photons and average photon energies in these continua, the hardness of the ionising spectrum, the amplitude of the Lyman-break, the number of photons able to photodissociate H2, and finally recombination line luminosities and equivalent widths (mostly for Ly and He ii 1640).
Two limiting cases of star formation histories, instantaneous bursts and constant star formation, are considered. For SFR=, presumably appropriate to describe the average properties of starbursts galaxies or populations thereof, the following main results have been obtained:
-
As expected from numerous earlier computations the Lyman continuum flux increases with decreasing metallicity. For a universal Salpeter IMF from 1–100 M⊙ the enhancement reaches typically a factor of 3 between solar metallicity and Pop III objects for a constant star formation (Sect. 4, cf. Tumlinson & Shull 2000, Schaerer 2002).
-
While for metallicities the amplitude of the Lyman-break is rather metallicity independent, a reduction by a factor 2 is found at lower metallicities, related to the strong increase of the average stellar temperature (Sect. 5).
-
The predicted hardness of the ionising fluxes between eV and eV, i.e. the ability to doubly ionise He, decreases by 1.5–2 or more orders of magnitude from to depending strongly on the upper mass cut-off of the IMF (Sect. 6).
From empirical constraints we derive a hardness –3.2 to –2.6 for metal-poor starbursts () and softer spectra for higher metallicities (Sect. 6.3). The former should provide the best estimate of ; the latter finding is also compatible with recent evolutionary synthesis models of Smith et al. (2002) including line blanketed non-LTE atmospheres for WR and O stars.
We also provide (Sect. 6.2) a simple estimate of the possible impact of hot WR like stars on at very low metallicities (). Such stars could eventually form due to a strong enhancement of mass loss related to rapid rotation (Marigo et al. 2002) or in principle also due very efficient rotational mixing processes (cf. Meynet & Maeder 2002), although we believe that these scenarios are quite unlikely or overall of minor importance.
-
Finally, calibrations for star formation rate determinations from Ly and other recombination lines at all metallicities and for various IMFs are provided (Sect. 7).
For young bursts, the maximum Ly equivalent width predicted is shown to increase strongly with decreasing metallicity from 240–350 Å at 1/50 Z⊙ to 400–850 Å or higher at between and 0 (Pop III) for the same Salpeter IMF (Sect. 7).
We find that non-negligible He ii 1640 emission due to photoionisation from stellar sources appears to be limited to very small metallicities () and Population III objects, except if hot WR like stars, whose existence appears very speculative, were frequent.
The detailed model predictions presented here are available on the Web through the CDS and at http://webast.ast.obs-mip.fr/sfr/. In subsequent publications our models are applied to the interpretation of Ly observations in high redshift galaxies (Valls-Gabaud & Schaerer 2002), modeling of the combined chemical enrichment and re-ionisation history of the Universe (Ferrara & Schaerer 2002), and feasibility studies on the detection of Population III objects (Pelló & Schaerer 2002).
Acknowledgements.
I thank Andrea Ferrara, Roser Pelló, David Valls-Gabaud for stimulating discussions and comments on an earlier version of the manuscript. Useful comments from Tom Abel, Daniel Kunth, and Grazyna Stasińska on the draft and related issues were also appreciated. Richard Norris kindly provided model results from his calculations for comparison. Last, but not least, I thank the referee for useful comments which helped to improve the presentation.References
- (1) Abel, T., Anninos, P.A., Norman, M.L., Zhang, Y., 1998, ApJ, 508, 518
- Abel, Bryan, & Norman (2002) Abel, T., Bryan, G. L., Norman, M. L., 2002, Science, 295, 93
- (3) Ajiki, M., et al., 2002, ApJ, in press (astro-ph/0207303)
- (4) Bresolin, F. , Kennicutt, R. C., Garnett, D. R., 1999, ApJ, 510, 104
- (5) Bromm, V., Coppi, P.S., Larson, R.B., 1999, ApJ, 527, L5
- Bromm, Ferrara, Coppi, & Larson (2001) Bromm, V., Ferrara, A., Coppi, P. S., Larson, R. B., 2001a, MNRAS, 328, 969
- (7) Bromm, V. , Kudritzki, R.P., Loeb, A., 2001b, ApJ, 552, 464
- (8) Charlot, S., Fall, M.S., 1993, ApJ, 415, 580
- (9) Chen, W.L., Neufeld, N.A., 1994, ApJ, 432, 567
- (10) Ciardi, B., Ferrara, A., Governato, F., Jenkins, A., 2000, MNRAS, 314, 611
- (11) Deharveng, J.-M., Faiesse, S., Le Brun, V., Milliard, B., 1997, A&A, 325, 1259
- (12) Deharveng, J.-M., Buat, V., Le Brun, V., Milliard, B., Kunth, D., Shull, J.M., Gry, C., 2001, A&A, 375, 805
- (13) Desjacques, V., 2000, Diploma thesis, Geneva Observatory
- (14) El Eid, M.F., Fricke, K.J., Ober, W.W., 1983, A&A, 119, 54
- (15) Ellis, R., Santos, M.R., Kneib, J.-P., Kuijken, K., 2001, ApJ, 560, L119
- (16) Feijóo, J.M., 1999, Diploma thesis, Geneva Observatory
- Frye, Broadhurst, & Benítez (2002) Frye, B., Broadhurst, T., Benítez, N., 2002, ApJ, 568, 558
- (18) Ferrara, A., Schaerer, D., 2002, in preparation
- Garnett et al. (1991) Garnett, D. R., Kennicutt, R. C., J.., Chu, Y.-H., Skillman, E. D. 1991, ApJ, 373, 458
- (20) Gnedin, N.Y., 1998, ApJ, MNRAS, 294, 407
- (21) Gnedin, N.Y., Ostriker, J.P., 1997, ApJ, 486, 581
- (22) Guseva, N.G., Izotov, Y.I., Thuan, T.X., 2000, ApJ, 531, 776
- (23) Haiman, Z., 2002, ApJ, 576, L1
- Hernandez & Ferrara (2001) Hernandez, X., Ferrara, A., 2001, MNRAS, 324, 484
- Hu et al. (2002) Hu, E. M., Cowie, L. L., McMahon, R. G., Capak, P., Iwamuro, F., Kneib, J.-P., Maihara, T., Motohara, K., 2002, ApJ, 568, L75
- Hu, Cowie, & McMahon (1998) Hu, E. M., Cowie, L. L., McMahon, R. G., 1998, ApJ, 502, L99
- Hu, McMahon, & Cowie (1999) Hu, E. M., McMahon, R. G., Cowie, L. L., 1999, ApJ, 522, L9
- (28) Hubeny, I., Lanz, T., 1995, ApJ, 439, 875
- (29) Izotov, Y.I., Chaffe, F.H., Schaerer, D., 2001, A&A, 378, L45
- (30) Kennicutt, R.C., 1998, ARA&A, 36, 189
- (31) Kudritzki, R.P., 2002, ApJ, 577, 389
- Kudritzki et al. (2000) Kudritzki, R.-P., et al., 2000, ApJ, 536, 19
- (33) Kunth, D., Mas-Hesse, J.M., Terlevich, E., Terlevich, R., Lequex, J., Fall, S.M., 1998, A&A, 334, 11
- (34) Kurucz, R.L., 1991, in “Stellar Atmospheres: Beyond Classical Models”, NATO ASI Series C, Vol. 341, Eds. L. Crivellari, I. Hubeny, D.G. Hummer, p. 441
- (35) Leitherer, C., 1998, in “The Stellar Initial Mass Function”, ASP Conf. Series, 142, 61
- (36) Leitherer, C., Ferguson, H.C., Heckman, T.M., Lowenthal, J., 1995, ApJ, 454, L19
- Leitherer et al. (1999) Leitherer, C., Schaerer, D., Goldader, J.D., González-Delgado, R.M., Robert, C., Kune, D.F., de Mello, D.F., Devost, D., Heckman,T.M. 1999, ApJS, 123, 3
- (38) Lejeune, T., Schaerer, D., A&A, 366, 538
- (39) Loeb, A., Barkana, R., 2001, ARAA, 39, 19
- (40) Loeb, A., Rybicki, G.B., 1999, ApJ, 524, 527
- (41) Madau, P., 2002, IAU Symp. 212, Eds. K. van der Hucht, A. Herrero, C. Esteban, in press
- (42) Maeder, A., Grebel, E.K., Mermilliod, J.-C., 1999, A&A, 346, 459
- (43) Maeder, A., Meynet, G., 1994, A&A, 287, 803
- (44) Maeder, A., Meynet, G., 2000, A&A, 361, 159
- (45) Malhotra, S., Rhoads, J.E., 2002, ApJ, 565, L7
- (46) Marigo, P., Girardi, L., Chiosi, C., Wood, R., 2001, A&A, 371, 152
- (47) Meynet, G., Maeder, A., 2002, A&A,390, 561
- (48) Mihalas, D., 1978, “Stellar Atmospheres”, W.H. Freeman and Co., San Francisco
- (49) Miralda-Escudé, J., Rees, M.J., 1997, ApJ, 478, L57
- (50) Moy, E., Rocca-Volmerange, B., Fioc, M., 2001, A&A, 365, 347
- (51) Nakamura, F., Umemura, M., 2001, ApJ, 548, 19
- (52) Oh, S.P., Haiman, Z., Rees, M.J., 2001, ApJ, 553, 73
- (53) Pelló, R., Schaerer, D., 2002, in preparation
- (54) Raimann, D., Bica, E., Storchi-Bergmann, T., Melnick, J., 2000, MNRAS, 314, 295
- (55) Rhoads, J.E., Malhotra, S., 2001, ApJ, 563, L5
- (56) Schaerer, D., 1996, ApJ, 467, L17
- Schaerer (1998) Schaerer, D. 1998, Highlights in Astronomy, 11, 134
- (58) Schaerer, D., 2000, in “Stars, Gas and Dust in Galaxies: Exploring the Links”, Eds. D. Alloin, K. Olsen, G. Galaz, ASP Conf. Series, 221, 99
- (59) Schaerer, D., 2002a, A&A, 382, 28 (S02)
- (60) Schaerer, D., 2002b, IAU Symp. 212, Eds. K. van der Hucht, A. Herrero, C. Esteban, in press (astro-ph/0208227)
- (61) Schaerer, D., Contini, T., Pindao, M., 1999, A&AS, 136, 35
- (62) Schaerer, D., de Koter, A. 1997, A&A, 322, 598
- (63) Schaerer, D., Vacca, W.D., 1998, ApJ, 497, 618 (SV98)
- (64) Schmutz, W., Leitherer, C., Gruenwald, R., 1992, PASP, 104, 1164
- Shioya et al. (2002) Shioya, Y., Taniguchi, Y., Murayama, T., Nishiura, S., Nagao, T., Kakazu, Y., 2002, ApJ, 576, 36
- (66) Smith, L., Norris, R., Crowther, P.A., 2002, MNRAS, in press (astro-ph/0207554)
- (67) Spitzer, L., 1978, “Physical Processes in the Interstellar Medium”, Wiley, New York
- (68) Stasińska, G., Izotov, Y.I., 2002, A&A, submitted
- (69) Stasińska, G., Schaerer, D., 1999, A&A, 351, 72
- (70) Stasińska, G., Schaerer, D., Leitherer, C., 2001, A&A, 370, 1
- (71) Stasińska, G., Tylenda, R., 1986, A&A, 155, 137
- Steidel, Giavalisco, Dickinson, & Adelberger (1996) Steidel, C. C., Giavalisco, M., Dickinson, M., Adelberger, K. L., 1996, AJ, 112, 352
- (73) Steidel, C.C., Pettini, M., Adelberger, K.L., 2001, ApJ, 546, 665
- Stern & Spinrad (1999) Stern, D., Spinrad, H., 1999, PASP, 111, 1475
- (75) Storey, P.J., Hummer, D.G., 1995, MNRAS, 272, 41
- (76) Sullivan, M., et al., 2001, ApJ, 558, 72
- Tenorio-Tagle et al. (1999) Tenorio-Tagle, G., Silich, S. A., Kunth, D., Terlevich, E., Terlevich, R., 1999, MNRAS, 309, 332
- (78) Tumlinson, J., Giroux, M.L., Shull, J.M., 2001, ApJ, 550, L1
- (79) Tumlinson, J., Shull, J.M., 2000, ApJ, 528, L65
- (80) Tumlinson, J., Shull, J.M., Venkatesan, A., 2002, ApJ, submitted (astro-ph/0206389)
- (81) Valls-Gabaud, D., 1993, ApJ, 419, 7
- (82) Valls-Gabaud, D., Schaerer, D., 2002, in preparation