Exploring the Role of Jets in the Radio/X-ray Correlations of GX 3394
The Galactic black hole candidate X-ray binary GX 3394 spends most of its time in the low/hard state, making it an ideal candidate for modeling the assumedly low accretion phase. The radio emission correlates very tightly with the X-rays over more than two orders of magnitude in X-ray flux density, suggesting that the jet plasma also plays a role at the higher frequencies. We compare the predictions of our jet model, with and without acceleration, to thirteen broadband simultaneous or quasi-simultaneous spectra over this changing flux history. In addition, we consider a simple standard thin disk which transitions to an optically thin accretion flow, in order to account for the assumedly thermal optical data seen in some observations. A solution without acceleration cannot describe the data without unrealistic energy requirements, nor explain the non-thermal radio spectrum seen during recent radio outbursts. But because of the low disk luminosity, and possibly the assumed disk geometry, acceleration in the jet is limited only by synchrotron cooling and can extend easily into the X-rays. We present a model which can account for all the broadband spectra included here, by changing only two parameters in the jet model: the input power and the location of the first acceleration zone. However, the model is most sensitive to changes in the jet power, the varying of which can also account for the slope of the observed radio/X-ray correlation analytically. At the highest low/hard state luminosities, the synchrotron self-Compton emission from the jet could be detectable with missions such as GLAST, providing a way to test the extent of the synchrotron contribution. We conclude that jet synchrotron is a possible way to explain the broadband features and this correlation, and discuss ways of incorporating this component into the “standard” corona picture.
Key Words.:
X-rays: binaries – X-rays: individual: GX 3394 – radiation mechanisms: non-thermal – stars: winds, outflows –black hole physics – accretion, accretion disks1 Introduction
The Galactic black hole candidate (BHC) X-ray binary (XRB) GX 3394 displays a wide variety of spectral states, and has recently resurfaced at a high flux level after being in an extended “off” state since 1999 (see, e.g., Kong et al. 2000). It has been extensively, and often simultaneously, observed across broad energy bands: from the radio (Hannikainen et al. 1998; Fender et al. 1999; Corbel et al. 2000—hereafter C00; Corbel et al. 2002, to be submitted—hereafter C02), infrared (IR) and optical (Soria et al. 1999; Shahbaz et al. 2001; Corbel & Fender 2002—hereafter CF02), to the X-rays (Wilms et al. 1999—hereafter W99; Nowak et al. 2002—hereafter NWD). These data sets are relatively untainted by contamination from the companion star. This, and the fact that GX 3394 often transitions between the canonical XRB states, makes it an ideal source for comparing the emission processes involved in these various states.
GX 3394 spends the great majority of its time in the low/hard state (LHS) (for a review of BHC states, see Nowak 1995), at flux levels varying over roughly three orders of magnitude in the X-ray waveband (NWD; C02). Its LHS spectra are fairly “typical” in that they show a flat-to-inverted radio component, a weak thermal contribution, and a hard power-law in the soft to hard X-rays (Zdziarski et al. 1998; Fender 2001; Revnivtsev et al. 2001; NWD). Although no jets have yet been resolved, the radio emission shows 2% linear polarization, and the brightness temperature (defined as where is the solid angle of the emitting region) requires a spatial extension greater than the binary separation (W99; C00). At the time of writing, GX 339-4 briefly entered the very high state (VHS) and made a transient-like radio outburst which was five times brighter than the brightest radio emission ever observed in the LHS. The optically thin spectrum had a spectral index () (R. Fender, S. Corbel, private comm.), which is characteristic of a transient bright jet. This makes GX 3394 the first source to show its radio properties clearly in the LHS, the high/soft state (HSS) and transient/VHS. Combined with the fact that jets have already been imaged in the other three persistent Galactic BHC which share similar LHS spectra (e.g., 1E1740.7-2942, Mirabel et al. 1992; GRS 1758-258, Rodríguez et al. 1992; and Cygnus X-1, Stirling et al. 2001), the case for a jet in this source is now very strong.
A special feature of GX 3394 is that its radio emission has been observed to correlate tightly with the X-ray emission over the entire range of LHS luminosities, and also down to a very weak level of emission in the “off” state (Hannikainen et al. 1998; C00; C02). Similarly, during changeover to the HSS, the seemingly linked radio and hard (20-100 keV) X-ray emission show an anti-correlation with the assumed thermal disk emission in the softer (2-12 keV) X-ray band (Fender et al. 1999; C00). This suggests not only that the plasma leading to the synchrotron radiation plays some role at higher energy, but also that the jet is either quenched (Fender et al., 1999) or otherwise unable to form when the thermal disk component dominates (Meier, 2001; Merloni & Fabian, 2002).
On the other hand, the LHS X-ray spectra from GX 3394 show additional features which have been interpreted as signs of reflection off colder disk material, and can be fit by one of several disk-corona models as discussed in detail in NWD. In this paper, the authors find correlations between the reflection covering fraction and both the soft X-ray flux (see also Zdziarski et al. 1999; Revnivtsev et al. 2001), and the time lags between the soft and hard X-ray variability. Similar to what Pottschmidt et al. (2000) report for Cyg X-1—which also shows radio/X-ray correlations (Brocksopp et al., 1999)—NWD find that these time lags anti-correlate with the coronal compactness, and peak shortly after the transition from the HSS to the LHS, when the assumed jet emission begins to rise. They suggest an interpretation that the time lags may be associated with the extended synchrotron-emitting plasma.
While the model fits presented in NWD can well explain the X-ray features, and suggest a link between the corona and jet, they do not explore the nature of this link or how this emission is related to that of the radio. One model which can explain the tight radio/X-ray correlations proposes that the jets directly contribute to the LHS X-ray spectrum via synchrotron emission (Markoff et al. 2001—hereafter MFF), as occurs in several AGN (e.g., 3C 66B, Hardcastle et al. 2001 and M87, Marshall et al. 2002; Wilson & Yang 2002). However, this model has only been applied until now to one source, XTE J1118480, which may be unusual in that it has extremely weak or absent reflection features (Miller et al., 2001).
In this paper, we discuss the application of a jet model to the collected simultaneous or quasi-simultaneous data sets for GX 3394 in order to investigate whether it succeeds in explaining the observed radio/X-ray correlations. We discuss how the model fares against the broadband data and compare the model parameters for the various data sets to each other, as well as to XTE J1118480.
2 Data
The 1981 data set was compiled by CF02, where it is explained in further detail. The X-rays come from the Ariel 6 instrument (Ricketts, 1983), with simultaneous optical/IR from Pedersen (1981) and Motch et al. (1981).
All radio observations were performed with the Australia Telescope Compact Array (ATCA) and, with the exception of the 2000 September 15 observation (to appear in C02), have been presented previously by C00. All observations from C00 in which the radio flux density was weak (i.e., mJy) were reanalyzed for this paper.
The X-ray data presented here have been discussed previously by NWD and C02. All data were obtained by the Rossi X-ray Timing Explorer (RXTE), with the exception of the 2000 September 15 data, which were obtained by BeppoSAX.
In this work we are attempting to describe the broadband features of the jet model, and to simultaneously explain radio, IR, optical, and X-ray data (taken with a wide variety of instruments). Furthermore, we are not yet attempting to explain detailed features within the X-ray, e.g., Fe lines or reflection features. Therefore, rather than forward fold the jet models through the detector response matrices, we instead compare the models to “unfolded” count flux rates. This is not strictly fitting, as we cannot obtain chi-squared estimates from unfolded data in this way, but for simplicity we will use the word “fit” to describe the comparison to the data throughout the paper.
To unfold the X-ray data, the RXTE data extraction, data binning, response matrix generation, and background subtraction were carried out in an identical manner as presented by NWD. We then fit models comprised of: a multi-temperature disk blackbody (e.g., Mitsuda et al. 1984; Makishima et al. 1986) with peak temperature fixed at 0.25 keV, an exponentially cutoff broken power-law with break energy at keV, and a (potentially) broad gaussian line with energy fixed to 6.4 keV. (This model is essentially identical to that discussed by W99). These model fits were then unfolded through the detector response matrix and multiplied by the ratio of the count rate data to the fitted model folded through the detector response. For the RXTE observations, data was considered only for the 3-200 keV range or less for the faintest data sets. Furthermore, HEXTE data was normalized to the PCA data (e.g., see W99).
| Label | Data Seta | Date (y.m.d) |
|---|---|---|
| 20181-01-01-00 | 1997.02.03 | |
| 20181-01-02-00 | 1997.02.10 | |
| 20181-01-03-00 | 1997.02.17 | |
| 40108-02-01-00 | 1999.04.02 | |
| 40108-02-02-00 | 1999.04.22 | |
| 40108-02-03-00 | 1999.05.14 | |
| 40105-02-02 | 1999.06.25 | |
| 40108-03-01-00 | 1999.07.07 | |
| 40108-03-02-00 | 1999.07.29 | |
| 40108-03-03-00 | 1999.08.17 | |
| 40104-01-08 | 1999.08.28b | |
| 21136001 | 2000.09.15c |
aData from W99, C00, C02 and NWD. All but 00 (which is BeppoSAX) are labeled
according to RXTE conventions.
bDate for X-ray observation. Radio taken on 1999.09.01.
cOptical data shown in Fig. 4b were taken 3 months prior.
As discussed by C02, simultaneous RXTE/ASCA observations indicate a probable faint background source that contaminates the RXTE spectrum— but not the narrow field of view ASCA spectrum—at extremely low flux levels. The RXTE observation of 1999 July 29 is assumed to be heavily dominated by this contaminating source, and this spectrum, multiplied by 0.78, is subtracted, before model fitting and data unfolding, from all RXTE observations occurring later than the observation of 1999 May 14. This normalization was determined by comparison of spectra obtained simultaneously by RXTE and ASCA on two separate occasions (the required normalization constants for these two observations were 0.73 and 0.83; see C02). Note that the 2000 September 15 BeppoSAX observation is most likely not contaminated by this background source, which could easily be half a degree away and still affect the RXTE observations, as BeppoSAX has a narrower field of view than RXTE. A more detailed discussion of this background source appears in C02.
The dates of the observations are listed in Table 1. Data sets labeled 20181 were first discussed by W99. Data sets 40108-02 were first discussed by NWD. Data sets 40108-03, first appearing in C02, were part of the same series of observations originally discussed by NWD; however, these latter observations were too faint for simultaneous spectral and X-ray variability analyses. Observations 40105-02-02, 40104-01-08 and 21136001 were part of a series of observations to study GX 3394 in quiescence, and are discussed by C02.
3 Model
The details of the jet model can be found in MFF, and references therein, and we give a brief summary here. We consider that an accretion disk may contribute to the near infrared (NIR), optical and possibly soft X-ray emission, but that the radio through at least far infrared (FIR) are due to synchrotron emission from the jets, which could possibly extend through the NIR to the X-rays. The inverse Compton (IC) upscattering by the hot jet electrons of both the thermal disk photons, as well as the synchrotron photons, is also included.
Our disk model is relatively simplistic, since we are currently exploring its limits in terms of contribution and there are already many detailed disk models in existence (see Poutanen 1998; NWD for reviews). We here consider one commonly invoked model in which a standard thin, optically thick disk (SD) (Shakura & Sunyaev, 1973) exists down to some transition radius , at which point the flow becomes hotter, optically thin and relatively non-radiative (e.g., Esin et al. 1997). This type of non-radiative inner disk has also been invoked for low-luminosity AGN such as NGC 4258 (Yuan et al., 2002). The thermal bump—seen in several of the GX 3394 data sets in the optical band—is assumed to originate in the disk, which also provides seed photons for jet IC as mentioned above. We assume for now that the jet is oriented 90∘ from the plane of the disk, but in the future we will consider other orientations (see, e.g., Maccarone 2002).
In their study of the BHC XTE J1118+480, MFF interpreted the extreme-ultraviolet (EUV) upper limits (Hynes et al., 2000) as the hottest, and thus innermost, emission from this outer disk. Therefore, they could place limits on its maximum temperature and luminosity. They derived a location for the transition radius of which is consistent with other models (e.g., Liu et al. 1999; Esin et al. 2001). However, no EUV data exist for GX 3394 , and so we constrain with the low-frequency X-ray data. We have also made the outer disk slightly more realistic than the simple one-temperature component we used before by considering a multi-temperature blackbody spectrum as its representation (e.g., Shakura & Sunyaev 1973; Mitsuda et al. 1984; Makishima et al. 1986). We then explore its possible geometry using the data sets where its signature seems the most prevalent.
A significant problem for modeling GX 3394 is that most of its system parameters are not well constrained. The only report of an orbital period based on optical photometry is from Callanan et al. (1992), who found 14.8 hours. This value remains unconfirmed (though Cowley et al. 2002 reconsidered the problem and found a similarly tentative period of 16.8 hours). However, it has been adopted over the years to limit the mass function, which is also problematic since the companion star is still unclassified. Finally, because the system has not yet been resolved, the inclination angle is also unknown but limited to because of the lack of eclipsing. Based on reasonable assumptions, a distance of 4 kpc has been adopted (see Zdziarski et al. 1998; W99; but also Shahbaz et al. 2001, who argue for kpc) and a mass for the black hole ranging from , where we here use .
We fix the inner temperature of the SD, , based on the 1981 data set. We then estimate the outer radius, , of the SD based on the physical parameters above, the best fit inclination angle, , and assuming a companion of , consistent with the 16.8 hour period. The exact luminosity contributed by the SD, , is not uniquely determined by the data, and so we can only roughly estimate the accretion rate, . Because of the simplicity of our disk model, this is not a main focus of this work, but we want to be sure we are consistent in terms of the energy budget. We express in units of erg s-1.
For accreting black holes it has been argued that the jet power is of order with an efficiency inferred to be of order (Falcke & Biermann, 1999; Meier, 2001). We consider a free parameter in our model, also expressed in units of erg s-1, and which we check for consistency with our limits on . While the jet formation itself is still a looming question in the field, the physics of calculating most of the jet emission is relatively straightforward because the flat-to-inverted spectrum stems from the part of the jet where it is basically undergoing free expansion. We briefly summarize the jet component as follows (and see also Falcke & Markoff 2000; MFF).
At the inner edge of the optically thin accretion flow, hot plasma is ejected out from symmetric nozzles, where it becomes supersonic. We assume free jets which accelerate along their axes only due to their longitudinal pressure gradients. This is the simplest scenario and provides a lower limit to the final velocity distribution. The velocity field along the jet is thus uniquely determined from the Euler equation (see, e.g., Falcke 1996), and at large distances from the base has a dependence . Thus, the maximum value of the bulk Lorentz factor is roughly determined by the distance at which the lowest frequency radio emission is emitted and is dependent on other parameters in this model but is itself not a fitted parameter. For both GX 3394 and XTE J1118+480, we find , which is consistent with the low beaming factors suggested by the recent work of Gallo et al. (2002).
We further assume the jets expand sideways with their initial proper sound speed, for a hot electron/cold proton plasma. Beyond the nozzle region, the radius is related to the distance by the Mach number along the jet, .
We choose the simplifying assumption that the internal energy, dominated by the magnetic field, is equal to the bulk kinetic energy of the particles, consistent with a magnetic launching mechanism. The plasma is assumed to originate in the hot accretion flow and therefore contains equal numbers of protons and electrons, with the exact temperature of the electrons at the base of the jet, , remaining a fitted parameter. A process such as pair-loading via interactions with the disk photon field will not be efficient enough in the LHS to be significant (see, e.g., Sikora & Madejski 2000). Under these assumptions, the magnetic energy density and particle density in each jet can thus be defined as and . Taking into account the non-constant velocity field, the dependencies of the magnetic field, , and density, , on distance are then similar to, but slightly stronger than, the canonical and dependencies for conical jets, respectively (Blandford & Königl, 1979; Hjellming & Johnston, 1988; Falcke & Biermann, 1995). In this way, the basic physical properties governing the emission at each point in the jet are fixed after specifying the jet power and nozzle scale , which determine and .
The thermal particles travel along the jet until they encounter an acceleration region which begins at . An acceleration process is inferred because of the observed optically thin synchrotron power-law seen in the recent transient radio events, indicating the presence of non-thermal particles. This is a standard process invoked to explain many features of AGN jet emission (Marscher & Gear, 1985). We consider the process to be diffusive shock acceleration, but it could really be one of a few possible scenarios (e.g., stochastic acceleration) which lead to a non-thermal power-law with spectral index (). For standard shock acceleration theory, (e.g., Jones & Ellison 1991). In order to maintain the non-thermal particles out along the jet to account for the entire radio spectrum, we assume distributed acceleration after . This is because the cooling timescales after acceleration are very fast compared to the dynamical timescales, a problem which has also required the assumption of distributed acceleration in the two best studied AGN jets, M87 and 3C 273 (Meisenheimer et al. 1996; Jester et al. 2001, but see also Perlman et al. 2001).
We assume that the accelerated distribution extends from the peak of the thermal distribution, with Lorentz factor . As discussed in MFF, the maximum occurs when the acceleration rate (assuming Bohm diffusion) is matched by the cooling rate giving
| (1) |
where is the shock speed in the plasma frame and is the magnetic field in Gauss. The parameter is the ratio between the diffusive scattering mean free path and the gyroradius of the particle. It measures how many times the particle gyrates per shock crossing, where the most efficient acceleration possible is when it crosses the shock once per gyroradius, thus giving a lower limit of . For quasi-perpendicular shocks , although in the case of a jet the field is likely quite tangled in which case an upper bound on is not known. While we do not know the exact value of , it must be larger than the speed of sound at the shock, , and no higher than the local bulk velocity. For very relativistic particles can be quite large, but conservative values lie in the range (e.g., Jokipii 1987). If we define as a reference value , the maximum synchrotron frequency is
| (2) |
where is the critical synchrotron frequency. This maximum corresponds approximately to the rollover of the power-law cutoff and in order to explain the “canonical” 100 keV cutoff for , we need , consistent with our physical expectations. This cutoff is not dependent on the magnetic field, the jet power, or the shock location as long as we are in the synchrotron cooling dominated regime. Because we would expect XRBs to have similar shock structures, we should get roughly similar cutoffs for different sources and accretion rates. In this sense and provide a reasonable physical explanation for the location of the cutoff in much the same way the coronal energy fraction and temperature determine it in coronal IC models (e.g., Sunyaev & Trümper 1979).
The location of the initial acceleration region is determined by the frequency where the flat, highly self-absorbed synchrotron spectrum turns over into the optically thin power-law produced at the shock. In MFF, we showed that from back-extrapolating the X-ray power-law, this maximum self-absorption frequency should occur somewhere in the IR/optical regime at Hz for XTE J1118+480. It is interesting to note that this now holds true for several other BHC sources in the LHS including GX 3394 and V404 Cyg (CF02; Brocksopp et al. 2002, in prep., Gallo et al. 2002, Gallo et al., MNRAS, in prep.).
There are thus seven free parameters relating to the jet component, , , , , and . These are not, however, entirely independent of each other. Furthermore, in our philosophy of comparing broadband spectral features to the jet model, we can choose reasonable constraints for a number of these parameters. For instance, if the X-rays are due to synchrotron emission, the spectral index of the accelerated particles is uniquely determined (). Starting with reasonable assumptions of the underlying disk/jet geometry in order to constrain and , and can then be determined from the radio spectrum because they fix its normalization and spectral index, respectively. The beginning of the acceleration region, , is then uniquely determined by where the turnover must occur to link the X-ray to the radio spectrum. For the purposes of the spectral models that we describe here, the critical fitted parameters are and , as they most directly determine the radio spectrum. For , the only observational constraint is that it is .
As described above, there are also additional parameters describing the cutoff in the X-rays as well as the disk component, and we will also argue below for an additional irradiation component. However, these are not an integral part of our model, in that they do not constrain the conditions of the radiating plasma in the jet. We include them for completeness, and to open the way for more complex, combined disk/jet models.
Some fraction of the emitted X-rays from the jet base will either directly interact with, or be scattered by hot electrons into, the cold disk, resulting in reflection. This calculation is not attempted here, however, since again this is very dependent on the disk geometry and we are focusing on the role of the jet. This, as well as other issues, will be the focus of an upcoming paper.
4 Results
4.1 1981 data set: constraining the GX 3394 model parameters
Of all the data sets for GX 3394 considered here, the most interesting is that of May 1981 (see Fig. 1), which is at the highest flux so far for which simultaneous broadband data have been published in the LHS. The IR/optical wavebands seem to indicate the clear presence of both jet and disk components, which has not been seen explicitly in any other XRB. The IR band shows a first component with a negative slope suggesting that we are seeing the expected turnover from the optically thick to optically thin regimes. The shape of this spectrum at higher frequencies is hidden under a component which is likely due to thermal emission from the SD, as indicated by the sharp rise in the optical points. However, if the simultaneously measured X-rays are traced back to the IR, they line up with the turnover remarkably well, supporting their interpretation as synchrotron emission.
While no simultaneous radio observation exists, an estimate of the 8.6 GHz radio flux can be found by extrapolating the radio/X-ray correlation curve to higher fluxes (C00; C02 and see Fig. 6), and is shown as a point in Figs. 1 & 2). As mentioned above, several other LHS sources show this interesting “turnover coincidence”. In the compact cores of most flat-spectrum AGN, the same kind of turnover is observed in the mm range (e.g., Bloom et al. 1994), but the more compact scales in XRBs push this to higher frequencies (e.g., Falcke et al. 2001).
The clear presence of the optically thick-to-thin turnover makes the 1981 data set a strong test of any theoretical model. Furthermore the radio/X-ray correlation, illustrated by the full set of simultaneous data shown here, suggest that any model for the X-rays from this source must address the lower-frequency data as well. This means that if—as is usually assumed—the X-rays are due entirely to IC upscattering off hot electrons in the base of the jet/coronal plasma, one has to show that these same electrons can reproduce the flat-to-inverted radio spectrum via their synchrotron emission, or that some other very strong coupling exists between “corona” and “jet”. As Blandford & Königl (1979) explain, to fit the flat-to-inverted radio spectrum particularly in the cm-band, one needs a conical geometry with outflowing plasma, otherwise the emitted synchrotron spectrum will be too inverted. We therefore think that a corona which has no relation to the jet cannot explain the data for GX 3394 . However, the corona may provide the launching point for the jet (Merloni & Fabian, 2002) or even comprise the base of the jet itself (Fender et al., 1999). Interestingly, Beloborodov (1999) found that magnetized plasma moving away from the disk with a velocity of can explain the weak reflection features in Cyg X-1, which would be consistent with this picture.
In order to understand the IR/optical data, we must first consider how the disk may be contributing in this region. Unfortunately, addressing the thermal disk component is not a uniquely defined problem for GX 3394 . If we assume the SD component extends up to the first X-ray data points and then drops off, we find K, which is the same value which W99 used for their fits to this source. We keep fixed to this value for all models discussed in this paper. However, a naive fit to the rising optical data with a multi-temperature blackbody would then require almost the entire being channeled into the SD emission. For the LHS, which is defined by its assumedly low accretion rate, this seems unrealistically high. One way around this is to assume a lower SD luminosity, and that the optical points are due to the irradiation of the outer disk material by intercepted X-rays. For the mass and inclination angle we use here, the outer disk radius would be on the order of cm. We use this as the nominal scale for the X-ray irradiated shell, noting that there could easily be a factor of a few leeway due to the large uncertainties in the system’s binary parameters. To fit the optical data, the temperature of this single blackbody needs to be K. This high temperature is not in conflict with possible disk instability models (e.g., Cannizzo et al. 1988) because we are observing already in outburst, after the effects of the instability would be felt.
For the models presented in Fig. 1, we fix the SD luminosity to a characteristic value of , and then make up any deficit in the optical region via the irradiation component. The ensuing fraction of the jet power contained in the irradiated component then can be determined due to the fact that an IR/optical break is observed. For the other data sets included in this paper, however, this break is not observationally resolved. For those models we therefore assume that the luminosity of the irradiated emission can be linked to the power in the jet, and we set as a canonical value.


It turns out that the 1981 data set is in fact so luminous that it creates a problem for our assumed black hole mass of . Even assuming in fact requires (in Eddington units) for the fixed K, which is much larger than one would expect for the LHS according to some models (e.g., Esin et al. 1997). We could solve this problem by choosing a lower and , thus having the SD contribution truncate before the X-ray data. However, then this only increases the need for more intercepted jet power in the irradiated component, which we already require to be at the upper bound of physical limits. We discuss the parameters in detail for the models below, but feel this problem is too unconstrained at this time to make any conclusions about the exact nature of the disk contribution.
4.2 1981 data set, no acceleration
Assuming that jets are responsible for the radio emission, the first issue to explore is how the solution would look if the jet plasma never encounters an acceleration region. This would be the simplest case model, where a portion of the thermal disk or coronal plasma is simply advected into the outflow, retaining its thermal or quasi-thermal distribution. In this case, the synchrotron spectrum from each segment of the jet will have a “hump” shape peaked around a particular self-absorption frequency determined from the physical parameters for the segment. The combination of all these humps, each located at a different frequency, gives a flat-to-inverted radio to at least IR spectrum which can be seen in Fig. 1. The slope of the spectrum depends on the amount of expansion and the velocity profile along the jet, as well as on .

As explained in the previous section, the electron temperature at the base of the jet is a free parameter, and so we explore two extremes for this scenario. The first, shown in Fig. 1a, is at the lowest end of the relativistic scale with electrons entering the jet base with initial K, and in Fig. 1b we show a more relativistic solution, with K, the maximum temperature we could accommodate in our modeling of XTE J1118+480 (MFF). In order to bring the highest frequency “hump” from the part of the jet closest to the accretion disk to low enough frequencies to come near the turnover in the IR data, we must vary the nozzle radius and the input power , thus controlling the magnetic field and density at the base of the jet while the temperature remains fixed. Similarly we must adjust to fit both the radio and the IR together with synchrotron, which changes the power requirements because of the beaming.
With the requirement that the non-accelerated models adequately describe the IR data as well as the maximum self-absorption turnover, the jet parameters for the fit shown in Fig. 1a are then , and , the former two being obviously unlikely values. The extremely high value of the the nozzle radius is necessary to decrease the self-absorption frequency to a value low enough to fit the IR data, which because of the resulting larger self-absorption also leads to a very peaked contribution from the denser nozzle. This does not seem feasible under the assumption that the jet originates at the inner edges of the accretion flow, or in the corona above it, and the match to the IR data itself is not particularly good. The “nozzle bump” is due to our assumption of this element of the geometry, as required for jet models of Sgr A* and LLAGN (e.g., Falcke & Markoff 2000; Yuan et al. 2002). Without a nozzle region, one could find a solution with a somewhat larger , but then this would require an even higher because the emission would be beamed away from the observer. The value of here is already several times higher than for a 5 central object. The irradiation component can provide the required rise in the optical data if the outer disk intercepts a small fraction of the jet power in X-rays, . Overall, however, this model is not so satisfactory.
The observations are slightly better described, at least at low-frequency, for the more relativistic case shown in Fig. 1b. The higher temperature electrons lead to less self absorption, giving a broader nozzle bump and requiring a somewhat smaller nozzle radius of with a more reasonable for . This nozzle width is still rather untenable, however, in the context of jet/corona models. For this scenario we also run into more trouble with the disk modeling, because we would require the outer disk to intercept roughly in X-ray luminosity to account for the optical data.
For both cases shown in Fig. 1, the IC emission in the X-rays is dominated by the upscattered thermal disk emission but, because of the low densities, lies under the data and also has the wrong shape. In this and all other figures in this paper, we do not include IC of photons from far out in the jet, since they are orders of magnitude under the data and will not affect the fit. Changing the disk geometry so that the thin disk underlies the base of the jet/corona may provide more IC emission, but would still not address the fundamental problem of explaining the radio thru IR data with reasonable parameters.
In summary, the energy budget in the non-accelerated case is not large enough to create enough synchrotron to fit the radio for a non-relativistic plasma, since the required for the already weakly relativistic temperature of Fig. 1a is super-Eddington. Considering that the radio through IR bands are likely due to jet synchrotron in the LHS, we conclude, based on all the above difficulties, that a model which does not include particle acceleration in the jet is unlikely. The extent to which the energy budget falls short is in part due to assumptions of the equipartition of energy, as described earlier. However, corona or other accretion flow models which attempt to explain the low-frequency data without a standard jet solution do not seem very feasible.

4.3 1981 data set, with acceleration
Therefore we want to focus on solutions where the particles in the jet are accelerated into a power-law distribution, as is typical in AGN. This solves the energy budget problem for the jet power, although we still need a very luminous thermal contribution.
We show four representative fits in Fig. 2, all with a nozzle radius of , which is more appropriate for the assumption that the jet originates at the edge of an accretion flow. As discussed above, we fix with and and then fit the optical data with the irradiated component, leaving the intercepted fraction of , , as a free parameter in the fit.
In panel (a) of Fig. 2, we show the resulting spectrum from a jet with mildly relativistic electrons, similar to the model shown in Fig 1a. The short-dashed line shows their contribution before encountering the acceleration region. Compared to Fig. 1 the nozzle “hump” lies at a higher frequency due to the more compact nozzle scale, and the slope is more inverted primarily to the greatly increased angle to the line-of-sight necessitated by the radio/IR fit, . The slope is flatter in the post-accelerated component (shown with the dot-dashed line), because of the effects of reacceleration and particle losses. Synchrotron from the accelerated particles dominates the entire spectrum with the exception of the optical, with the IR and X-rays stemming from the region near the start of the acceleration , while the radio comes from much further out along the jet. For a fixed , and are found by fitting the radio-IR spectrum, which then uniquely determines by fitting the IR turnover and extension to the X-rays. This also determines the slope of the accelerated particles, . The jet parameter values for this mildly relativistic case are: , , , and . The IC emission is dominated by upscattered thermal disk photons and is well under the synchrotron contribution.
The problem with this model is that—as in the model from Fig. 1a—the required power in the jet is unrealistically large, in order to compensate for the low electron temperature. This imbalance also leads to the magnetic field energy density in the jet being a few orders of magnitude super-equipartition with the hot, radiating electrons. While many jet formation models assume the magnetic energy density is in equipartition with the kinetic energy near the base of the jet (e.g., Blandford & Payne 1982; Li et al. 1992), which for a maximal jet would lead to magnetic domination, this may be rather extreme.
In Fig. 2b, we consider the highest temperature electrons allowed by this model, above which the X-ray predictions (from either synchrotron or IC from the jet) are too high, K. The jet free parameters are now: , , and . Raising the temperature thus serves mainly to reduce the power requirements and changes the location of the shock region slightly. With the same SD parameters as in (a), the irradiation component now comprises , still rather large but again given the uncertainties in the mass and outer radius, more viable. The hotter electrons now also contribute to a greater degree via IC upscattering, contributing some of the soft X-ray emission.
While there is no measurement of the inclination angle, some papers favor a lower value than what we find for our best fit above (e.g., Cowley et al. 2002). In Fig. 2c, we show what our model predicts for and the same temperature as in panel (b). The decreased angle greatly reduces the power requirements in the jet, but at the same time flattens the predicted radio-IR slope significantly, making a good radio/IR fit impossible. The parameters are , and . Although this radio point is only from an extrapolation of the radio/X-ray correlation relation (C00; C02), the slope is remarkably well-defined at these higher luminosities. On the other hand, does give good fits to most of the other data sets discussed below. Because the beaming reduces the power requirements for the jet, a low inclination angle also means that more power must irradiate the outer disk than is available, making this model problematic.
Finally in Fig. 2d we consider the case of a power-law of particles entering the base of the jet from the accretion flow instead of thermal particles, as may occur if acceleration also takes place at an accretion shock. Instead of defining a temperature, we take the minimum electron Lorentz factor , leaving a free parameter. In order to prevent the nozzle emission from violating the constraints of the soft X-ray data, we find , which would require extreme radiative cooling to truncate the accelerated power-law for this scenario to be realistic. This type of scenario may be necessary for certain low-luminosity AGN (see, e.g., Yuan et al. 2002). The other jet parameters are , , and . The high required jet power means that the irradiated component needs only to account for the optical data.
In this last model, the IC emission still lies under the synchrotron component, but not by much, and has the correct slope. In a different geometry where the SD underlies the corona/jet base, this may provide the best alternative for a solution where the IC dominates the synchrotron emission in the X-rays.
In all four model runs shown here, we needed a rather large fraction of the jet power to be intercepted by the outer disk and reradiated. If we allowed the SD to radiate away, we could lower the necessary , but then again we would be basically at the Eddington accretion rate, as discussed for the non-acceleration case. This problem is clearly not very constrained for this source, and a central mass of instead of 5 (as in, e.g., GRS 1915+105; Greiner et al. 2001), would easily resolve these issues.
In Fig. 3 we show the same model as in Fig. 2b with the flux multiplied by the frequency to show the distribution of power across the wavebands. One can see that most power seems to fall in the disk component, with the synchrotron then creating the second peak around the cutoff. The IC component is in fact dominated by the upscattered disk photons, but this is hidden beneath the synchrotron emission. The self-Comptonized synchrotron component peaks at Hz, or MeV, corresponding to the synchrotron peak upscattered by the hot electrons near the shock. At high frequencies, the shape is similar to the “camel back” spectra seen in blazars (e.g., Fossati et al. 1998), and in fact at this highest observed flux level is above the sensitivity of GLAST for a one year all-sky survey at 100 MeV. The less powerful epochs of this source presented in the next section may not be so observable, however, as they are orders of magnitude lower.
In conclusion, we have shown that in order to explain the low-frequency data from the 1981 observation of GX 3394 , a jet solution must include some form of particle acceleration. And further, once that condition is fulfilled, X-rays from jet synchrotron (in addition to IC) are unavoidable as long as IC emission is not the main cooling channel. But under the assumption of a disk geometry where a SD transforms to an optically thin, hot accretion flow at some inner radius, synchrotron cooling will dominate in a maximal jet. It is possible, however, that in the alternative geometry of a corona/jet base lying directly on top of the SD could lead to so much IC cooling that the synchrotron cutoff would occur below Hz, thus accommodating a dominant IC contribution in the X-rays. This would not, however, explain the interesting coincidence of IR turnover/X-ray spectrum seen here and now also in several sources in addition to XTE J1118+480. It may also be difficult to explain the radio/X-ray correlation with an IC model (see Sect. 5). We will, however, soon explore combined jet/corona solutions using lower temperature cyclo-synchrotron and IC scattering in different geometries.
We have explored the relativistic electron parameter range for the 1981 data set and find that the most reasonable parameters are obtained for the case of a fully relativistic initial thermal electron distribution. Besides requiring too much power, a mildly relativistic initial electron distribution would also result in the magnetic energy density being much higher (and further out of equipartition with) the accelerated particles at the shock, more so than would likely be expected for magnetic confinement. For these reasons, in this paper we consider only the higher temperature solutions for all fits, corresponding to the type of fit shown in Fig. 2b.
4.4 Other data sets
For the 12 data sets compiled during the other LHS episodes of GX 3394 , we can either optimize each fit individually leaving all parameters free, or fix as many parameters as possible to see if essentially the same model can account for all observed spectra. We here choose to take this latter approach, in order to explore the fundamental physics of the model. We will fix some of the parameters to those best constrained by the 1981 set and then study the affect of changing only two jet parameters. Our emphasis is on understanding the radio/X-ray correlations, and thus the jet component. However, we address the SD contribution as well, and attempt to test the jet/disk connection by finding a scaling solution. We set for all fits, and then fit to the optical data, when present.
While it seems clear that there are small variations in the soft X-ray spectra of these data sets (this is discussed in NWD, who fit a broken power law—we are fitting the lower energy segment), we choose to fix the accelerated spectral index to as in 1981. Similarly, while there are obvious changes in the SD contribution, they seem consistent with the likely underlying accretion changes that also affect the jet since both components decrease in luminosity with increasing time. We keep fixed at K and fixed at K based on the 1981 set, as a starting point. We will assume that the orientation of the jet remains fixed at (statistically is the most likely angle) and that the base of the jet is fixed at . Thus the only jet parameters allowed to vary are and , and the disk parameter is then adjusted to fit the thermal data, when present.

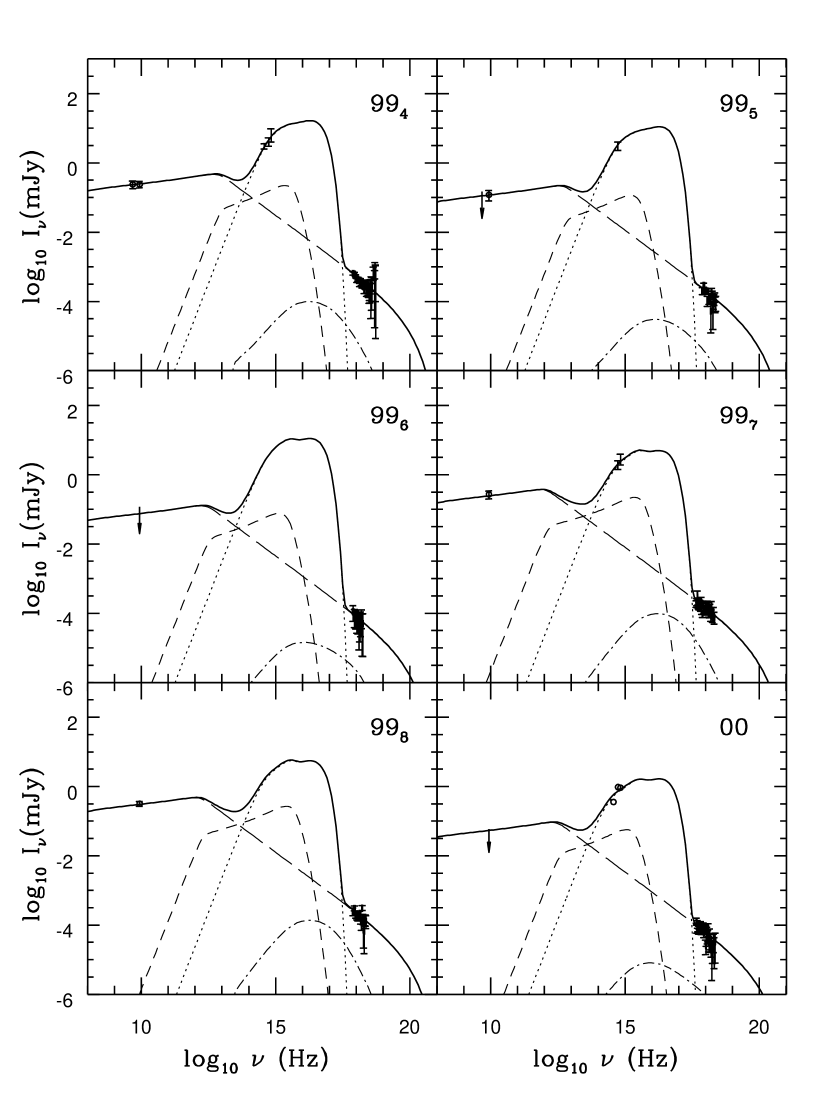
Figs. 4a & 4b show the broadband spectral fits to the data, with the corresponding fit parameters given in Table 2. For the data sets without optical data constraining the disk, is rather arbitrary, and we scaled the luminosity to the jet power.
Although the fits are surprisingly good given the limited fitting parameters, there are obvious features in the X-ray waveband such as a flattening at higher frequencies and peaks which our model cannot account for. These features are likely due to the impacting X-rays on the cooler material of the SD, but we have not yet incorporated this into our model. The softest X-rays should not be affected by these additional components, however, so we focus our fitting at the lower X-ray frequencies. For the lowest flux level data sets of 1999, which we label —, as well as 2000, the error bars are large enough to make the fitting more difficult.
The most important feature to note is that the radio/X-ray correlations detected in this source (C00; C02) can be explained by the variation of only one main parameter in the jet model: the input power. If we plot against the jet power (Fig. 5), we see that there is a slight dependence (), but this likely results from our rather artificially freezing of the other parameters. This small dependence is rather amazing when one thinks that is changing by about three orders of magnitude over the same range, if 1981 is included.
| Data Set | |||
| () | () | () | |
| * | 0.18 | ||
| * | 0.16 | ||
| * | 0.16 | ||
| * | 0.12 | ||
| * | |||
| * | |||
*Data sets where there is no direct constraint on the thermal disk
component.
aThe optical data constraining the SD are not simultaneous.

5 Understanding the radio/X-ray correlations
It seems likely that the real source of the variations is the power fed into the jet. In Fig. 6 we plot the prediction of our model against the data for the correlation between the 8.6 GHz radio flux and the integrated 3-9 keV X-rays (C02). We fix , to match the highest flux data point of 1981, which is not shown on this figure because the radio was not simultaneously measured. Then we adjust only while holding every other parameter constant, in order to fit the radio flux, and plot the resulting integrated 3-9 keV X-ray flux. In removing the dependence mentioned above, we are likely compromising the quality of the fit to some degree, but this could be compensated for if we allowed particularly the spectral index to vary.
By just changing the jet power we obtain a very good fit to the correlation data, with the exception of the two data sets and . In fact, the radio data in was taken a few days after the X-rays, and coincided with a small reflare in the hard X-rays (see Fig. 15 in C00). This is the likely explanation of the excess radio flux. Similarly, the reflare may also have an affect on , if there is, e.g., a lag between the changing fluxes.
The results shown in Fig. 6 provide strong support for a jet synchrotron model, since it correctly predicts the radio/X-ray correlation over orders of magnitude in flux levels, almost exactly matching the data. The fit is better at the higher flux end, where the error bars are smaller. The exact dependence (excluding and ) goes as , where , is the 8.6 GHz radio flux and is the integrated 3-9 keV X-ray flux.
The value for in fact follows directly from analytic predictions of the jet model. Eq. (52) in Falcke & Biermann (1995) shows111In Falcke & Biermann (1995), the quantities which we label , and correspond to , and , respectively. that if all parameters except the power are fixed, as we have done to produce Fig. 6, the frequency where the optically thick flat-to-inverted spectrum turns over to the optically thin regime depends on the power as
| (3) |
Similarly Eq. (56) (ibid.) shows that under the same freezing of other parameters, the flux at the turnover depends on the power as
| (4) |
These relations can then be normalized using the 1981 data set, where the flux and turnover frequency are visible.
Knowing these relations, and the spectral indices of the optically thick and thin components from the data, one can roughly calculate the expected correlation slope. Because the spectral indices for the radio-IR, , and X-ray, , do vary slightly over GX 3394 ’s observation history, taking constant values will make this less exact. We now want to calculate the slope between two points along the correlation curve, analogous to the model plotted in Fig. 6. Each point represents a different value of , corresponding to different values of and . The 8.6 GHz radio flux is then
| (5) |
| (6) |
where absorbs the exact dependences of the flux and frequency at the turnover on , and other constants.

Similarly, the X-ray flux at any frequency (as long as it falls on the power-law) is
| (7) |
which after using the forms from Eqs. (3) & (4) and integrating from 3-9 keV becomes
| (8) |
where again includes the constants of integration and the dependencies on .
For any two values of the jet power, and , the correlation slope is then
| (9) | |||||
| (10) |
after algebraic cancellations. Taking the values from the power-law fits to the 1981 data set from CF02, and , we find , which considering the simplifications in the model and our ignoring of the spectral variations, is surprisingly close to the value of 1.4 found for GX 3394 . In addition, this type of radio/X-ray correlation has also been seen in V404 Cygni, with exactly the same slope (Gallo et al. 2002; Gallo et al., MNRAS, in prep.). Our preliminary models of this source also show a turnover in the IR band and have similar jet parameters (Markoff et al. 2002, in prep.).
The fact that the well-determined slope extrapolates to the lower flux data also gives us greater confidence in the subtraction of the putative “background source” discussed in Sect. 2. Note also that the lowest flux point is from BeppoSAX, and therefore does not rely on the subtraction of a background source.
It is possible that an IC corona model could also explain the correlation slope, if the radio flux scales with the power (assumed to be linearly related to ) as expected from the jet and the X-ray flux scales with . This may be the case in some optically thin accretion solutions. However, it has yet to be shown that a self consistent solution can be found which also well fits all the broadband data available for this source. Similarly this would not explain why the X-rays trace back to the turnover in the IR as 1981 data, or why most if not all LHS sources show this turnover coincidence.
6 Conclusions
We show that a model comprising a dominantly synchrotron jet component, in combination with an optically thin accretion flow transitioning to a standard thin disk, is able to explain the broadband spectral data from 13 observations of GX 3394 . At the same time, the model can easily explain the slope of the radio/X-ray correlations by changing only the power input into the jet. This input power, , is assumed to be proportional to the accretion rate, and varies from for a 5 black hole. Above the highest luminosity, the source would likely transition to the HSS.
This model assumes an underlying disk geometry in which the standard thin disk exists beyond , and has a relatively low accretion rate. In a situation where the SD extends all the way down to the last stable orbit, the photon field at the base of the jet may be high enough to affect our conclusions, which are dependent on synchrotron losses dominating the cooling. If the available photon field for inverse Compton upscattering becomes large enough, it may truncate the accelerated particle distribution and lessen the extent of the synchrotron emission.
With the exception of this model, the non-thermal X-ray spectral component in all XRB states has been modeled in terms of inverse Compton processes in a hot corona, located either above or within the standard thin disk. These classes of models have significant success explaining both the spectral features and timing characteristics in the X-ray waveband, but fail to address the radio/IR spectra which in at least GX 3394 , V404 Cyg and Cyg X-1 seem intimately linked to the higher frequencies.
However, the existence of a hot, magnetized plasma at the base of the jet leads to obvious considerations of a unification scheme between it and this concept of a corona, which until now has not been explicitly observed. Both scenarios (jet and corona) address important features from the observations, but either cannot or have not yet attempted to account for everything. We feel that a concatenation of these two components would be fruitful as the next stage of our investigation. It is, however, important to note that under reasonable physical assumptions, the jet can easily produce X-ray emission via synchrotron radiation, and has significant success explaining the data when it does. This possibility must therefore be considered in spectral modeling; whether it really dominates the entire spectrum is a question of the environment and local acceleration conditions. It may be that it indeed dominates only in those sources which show only weak reflection features (e.g., XTE J1118+480; Miller et al. 2001), but it likely has a wider impact in all sources than has so far been appreciated.
Interestingly, the parameters we derive for the power and location of the shock are roughly consistent with earlier results modeling XTE J1118+480, which because of the higher temperature ( K) resulted in a lower necessary power input into the jet. In this source we found as compared to the found here, however considering that the jet can extend beyond , this range is quite small. In our recent modeling of other LHS BHC sources, we are in fact finding that all sources with simultaneous radio/X-ray data seem to require acceleration to begin in this same range, and we will discuss the physical implications of this elsewhere. For these sources we also find, as in GX 3394 and XTE J1118+480, that if the X-rays are traced back to lower frequencies, the optically thick-to-thin turnover always occurs in the IR range. If this turnover coincidence is real, it offers us the chance to explore the physical conditions at the acceleration zone of XRB jets.
This work illustrates how critical simultaneous multiwavelength observations are to increasing our understanding of the physics in these sources. With the advent of higher energy missions such as GLAST, INTEGRAL and ASTRO E-2, soon we can hopefully begin to probe the contribution of these smaller jets to the hard X-ray and -ray bands.
Acknowledgements.
This work is partially supported by AUGER Theory Grant O5CU1ERA/3 from the BMBF (S.M.). S.M. would like to thank Tom Maccarone and David Meier for very helpful discussions.References
- Beloborodov (1999) Beloborodov, A. M. 1999, ApJ, 510, L123
- Blandford & Königl (1979) Blandford, R. D. & Königl, A. 1979, ApJ, 232, 34
- Blandford & Payne (1982) Blandford, R. D. & Payne, D. G. 1982, MNRAS, 199, 883
- Bloom et al. (1994) Bloom, S. D., Marscher, A. P., Gear, W. K., et al. 1994, AJ, 108, 398
- Brocksopp et al. (1999) Brocksopp, C., Fender, R. P., Larionov, V., et al. 1999, MNRAS, 309, 1063
- Callanan et al. (1992) Callanan, P. J., Charles, P. A., Honey, W. B., & Thorstensen, J. R. 1992, MNRAS, 259, 395
- Cannizzo et al. (1988) Cannizzo, J. K., Shafter, A. W., & Wheeler, J. C. 1988, ApJ, 333, 227
- Corbel & Fender (2002) Corbel, S. & Fender, R. 2002, ApJ, 573, L35 (CF02)
- Corbel et al. (2000) Corbel, S., Fender, R. P., Tzioumis, A. K., et al. 2000, A&A, 359, 251 (C00)
- Cowley et al. (2002) Cowley, A. P., Schmidtke, P. C., Hutchings, J. B., & Crampton, D. 2002, AJ, 123, 1741
- Esin et al. (2001) Esin, A. A., McClintock, J. E., Drake, J. J., et al. 2001, ApJ, 555, 483
- Esin et al. (1997) Esin, A. A., McClintock, J. E., & Narayan, R. 1997, ApJ, 489, 865
- Falcke (1996) Falcke, H. 1996, ApJ, 464, L67
- Falcke et al. (2001) Falcke, H., Beckert, T., Markoff, S., et al. 2001, in Lighthouses of the Universe, Springer Verlag, ESO Astrophysics Symposia,Eds. R. Sunyaev, M. Gilfanov, E. Churazov, in press
- Falcke & Biermann (1995) Falcke, H. & Biermann, P. L. 1995, A&A, 293, 665
- Falcke & Biermann (1999) —. 1999, A&A, 342, 49
- Falcke & Markoff (2000) Falcke, H. & Markoff, S. 2000, A&A, 362, 113
- Fender et al. (1999) Fender, R., Corbel, S. ., Tzioumis, T., et al. 1999, ApJ, 519, L165
- Fender (2001) Fender, R. P. 2001, MNRAS, 322, 31
- Fossati et al. (1998) Fossati, G., Maraschi, L., Celotti, A., Comastri, A., & Ghisellini, G. 1998, MNRAS, 299, 433
- Gallo et al. (2002) Gallo, E., Fender, R., & Pooley, G. 2002, in Proc. of the 4th Microquasar Workshop, Center for Space Physics: Kolkata, eds. Durouchoux, Fuchs & Rodriguez, (astro-ph/0207551)
- Greiner et al. (2001) Greiner, J., Cuby, J. G., & McCaughrean, M. J. 2001, Nat., 414, 522
- Hannikainen et al. (1998) Hannikainen, D. C., Hunstead, R. W., Campbell-Wilson, D., & Sood, R. K. 1998, A&A, 337, 460
- Hardcastle et al. (2001) Hardcastle, M. J., Birkinshaw, M., & Worrall, D. M. 2001, MNRAS, 326, 1499
- Hjellming & Johnston (1988) Hjellming, R. M. & Johnston, K. J. 1988, ApJ, 328, 600
- Hynes et al. (2000) Hynes, R. I., Mauche, C. W., Haswell, C. A., et al. 2000, ApJ, 539, L37
- Jester et al. (2001) Jester, S., Röser, H.-J., Meisenheimer, K., Perley, R., & Conway, R. 2001, A&A, 373, 447
- Jokipii (1987) Jokipii, J. R. 1987, ApJ, 313, 842
- Jones & Ellison (1991) Jones, F. C. & Ellison, D. C. 1991, Space Science Reviews, 58, 259
- Kong et al. (2000) Kong, A. K. H., Kuulkers, E., Charles, P. A., & Homer, L. 2000, MNRAS, 312, L49
- Li et al. (1992) Li, Z., Chiueh, T., & Begelman, M. C. 1992, ApJ, 394, 459
- Liu et al. (1999) Liu, B. F., Yuan, W., Meyer, F., Meyer-Hofmeister, E., & Xie, G. Z. 1999, ApJ, 527, L17
- Maccarone (2002) Maccarone, T. J. 2002, MNRAS, submitted
- Makishima et al. (1986) Makishima, K., Maejima, Y., Mitsuda, K., et al. 1986, ApJ, 308, 635
- Markoff et al. (2001) Markoff, S., Falcke, H., & Fender, R. 2001, A&A, 372, L25 (MFF)
- Marscher & Gear (1985) Marscher, A. P. & Gear, W. K. 1985, ApJ, 298, 114
- Marshall et al. (2002) Marshall, H. L., Miller, B. P., Davis, D. S., et al. 2002, ApJ, 564, 683
- Meier (2001) Meier, D. L. 2001, ApJ, 548, L9
- Meisenheimer et al. (1996) Meisenheimer, K., Röser, H.-J., & Schlötelburg, M. 1996, A&A, 307, 61
- Merloni & Fabian (2002) Merloni, A. & Fabian, A. C. 2002, MNRAS, submitted, (astro-ph/0112451)
- Miller et al. (2001) Miller, J. M., Ballantyne, D. R., Fabian, A. C., & Lewin, W. H. G. 2001, MNRAS, in press (astro-ph/0111027)
- Mirabel et al. (1992) Mirabel, I. F., Rodríguez, L. F., Cordier, B., Paul, J., & Lebrun, F. 1992, Nat., 358, 215
- Mitsuda et al. (1984) Mitsuda, K., Inoue, H., Koyama, K., et al. 1984, PASJ, 36, 741
- Motch et al. (1981) Motch, C., Ilovaisky, S. A., & Chevalier, C. 1981, IAU Circ., 3609, 2
- Nowak (1995) Nowak, M. A. 1995, PASP, 107, 1207
- Nowak et al. (2002) Nowak, M. A., Wilms, J., & Dove, J. B. 2002, MNRAS, in press, (astro-ph/0201383) (NWD)
- Pedersen (1981) Pedersen, H. 1981, IAU Circ., 3613
- Perlman et al. (2001) Perlman, E. S., Biretta, J. A., Sparks, W. B., Macchetto, F. D., & Leahy, J. P. 2001, ApJ, 551, 206
- Pottschmidt et al. (2000) Pottschmidt, K., Wilms, J., Nowak, M. A., et al. 2000, A&A, 357, L17
- Poutanen (1998) Poutanen, J. 1998, in Theory of Black Hole Accretion Disks, Cambridge University Press, 100
- Revnivtsev et al. (2001) Revnivtsev, M., Gilfanov, M., & Churazov, E. 2001, A&A, 380, 520
- Ricketts (1983) Ricketts, M. J. 1983, A&A, 118, L3
- Rodríguez et al. (1992) Rodríguez, L. F., Mirabel, I. F., & Martí, J. 1992, ApJ, 401, L15
- Shahbaz et al. (2001) Shahbaz, T., Fender, R., & Charles, P. A. 2001, A&A, 376, L17
- Shakura & Sunyaev (1973) Shakura, N. I. & Sunyaev, R. A. 1973, A&A, 24, 337
- Sikora & Madejski (2000) Sikora, M. & Madejski, G. 2000, ApJ, 534, 109
- Soria et al. (1999) Soria, R., Wu, K., & Johnston, H. M. 1999, MNRAS, 310, 71
- Stirling et al. (2001) Stirling, A. M., Spencer, R. E., de la Force, C. J., et al. 2001, MNRAS, 327, 1273
- Sunyaev & Trümper (1979) Sunyaev, R. A. & Trümper, J. 1979, Nat., 279, 506
- Wilms et al. (1999) Wilms, J., Nowak, M. A., Dove, J. B., Fender, R. P., & di Matteo, T. 1999, ApJ, 522, 460 (W99)
- Wilson & Yang (2002) Wilson, A. S. & Yang, Y. 2002, ApJ, 568, 133
- Yuan et al. (2002) Yuan, F., Markoff, S., Falcke, H., & Biermann, P. L. 2002, A&A, in press (astro-ph/0205531)
- Zdziarski et al. (1999) Zdziarski, A. A., Lubiński, P., & Smith, D. A. 1999, MNRAS, 303, L11
- Zdziarski et al. (1998) Zdziarski, A. A., Poutanen, J., Mikolajewska, J., et al. 1998, MNRAS, 301, 435