Closest Star Seen Orbiting the Supermassive Black Hole at the Centre of the Milky Wayaaabased on observations at the Very Large Telescope (VLT) of the European Observatory in Chile
R. Sch del, T. Ott, R. Genzel∗, R. Hofmann, M. Lehnert
Max-Planck-Institut für extraterrestrische Physik, Giessenbachstr., 85748 Garching, Germany
∗ also Dept. Dept.of Physics, University of California, Berkeley CA 94720, USA
A. Eckart, N. Mouawad
I. Physikalisches Institut, Universität zu Köln, Zülpicher Straße 77, 50937 Köln, Germany
T. Alexander
The Weizmann Institute of Science, Faculty of Physics, PO Box 26,
Rehovot 76100, Israel
M.J. Reid
Harvard-Smithsonian Center for Astrophysics MS42, 60 Garden St,
Cambridge, MA 02138, USA
R. Lenzen, M. Hartung
Max-Planck-Institut f r Astronomie, K nigstuhl 17, 69117 Heidelberg, Germany
F. Lacombe, D. Rouan, E. Gendron
Observatoire de Paris - Section de Meudon, 5, Place Jules Janssen,
92195 Meudon Cédex, France
G. Rousset
Office National d’Etudes et de Recherches Aerospatiales, BP 72,
92322 Chatillon cedex, France
A.-M. Lagrange
Laboratoire d’Astrophysique, Observatoire de Grenoble, BP 53, F-38041
Grenoble Cédex 9, France
W. Brandner, N. Ageorges, C. Lidman, A.F.M. Moorwood,
J. Spyromilio, N. Hubin
European Southern Observatory, Karl-Schwarzschild-Str.2, D-85748
Garching, Germany
K.M. Menten
Max-Planck-Institut f r Radioastronomie, Auf dem H gel 69, D-53121
Bonn, Germany
Measurements of stellar velocities1-6 and variable X-ray emission7 near the centre of the Milky Way have provided the strongest evidence so far that the dark mass concentrations seen in many galactic nuclei 8 are likely supermassive black holes, but have not yet excluded several alternative configurations. Here we report ten years of high resolution astrometric imaging that allow us to trace two thirds of the orbit of the star currently closest to the compact radio source and massive black hole candidate SgrA*. In particular, we have observed both peri- and apocentre passages. Our observations show that the star is on a bound, highly elliptical Keplerian orbit around SgrA*, with an orbital period of 15.2 years and a peri-centre distance of only 17 light hours. The orbital elements require an enclosed point mass of solar masses. The data exclude with high confidence that the central dark mass consists of a cluster of astrophysical objects or massive, degenerate fermions, and strongly constrain the central density structure.
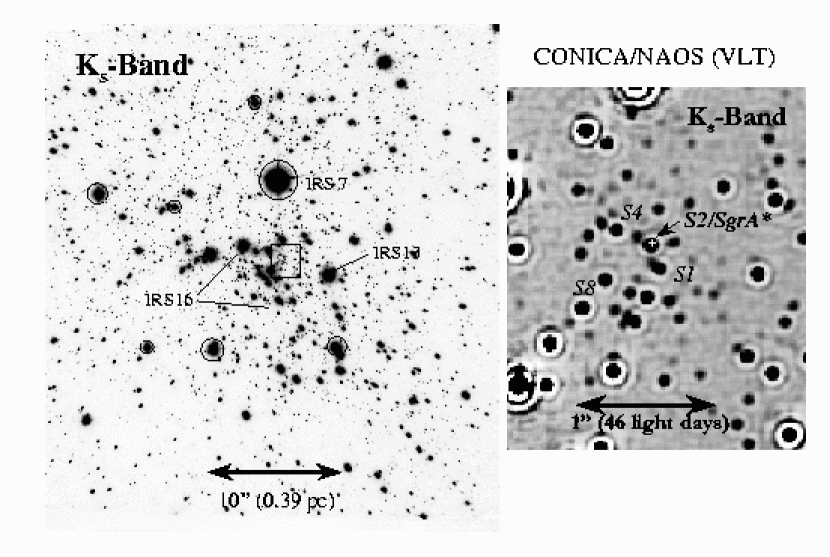
For the past ten years we have been carrying out high resolution near-IR imaging and spectroscopy of the central few light years of our Milky Way for a detailed study of the stellar dynamics in the vicinity of the compact radio source SgrA*1-2,4,6, the most likely counterpart of the putative black hole9,10. From a statistical analysis of the stellar proper motions (velocities on the plane of the sky derived from multi-epoch imaging data) and line of sight velocities (Doppler motions derived from spectral lines) we deduced the presence of a mass of 2.6 to 3.3 million solar masses (M⊙) concentrated within 10 light days of SgrA*1,2,4. To further improve the sensitivity (by 20) and the angular resolution/astrometric precision of our study (by 3), we have begun this year to use the new CONICA/NAOS adaptive optics assisted imager/spectrometer on the 8m UT4 (Yepun) of the ESO VLT11-13. Figure 1 shows a diffraction limited (60milli-arcsec (mas) FWHM) Ks-band (2.1 ) image of the central 40” of the Milky Way taken with CONICA/NAOS in May 2002. A key factor in constraining the mass distribution is the alignment of the infrared images, where the stars are observed, with the astrometrically accurate radio images, where SgrA* is observed. For this purpose we aligned our CONICA/NAOS images with the astrometric grid using 7 SiO maser sources in the field of view (circles in Fig.1) whose positions are known through measurements with the VLA and the VLBA to accuracies of a few milli arcseconds (Reid M.J. et al., 2002, in preparation). Having thus derived astrometric infrared positions for 2002, we were then able to compute exact stellar positions relative to SgrA* (in right ascension and declination) for all epochs (including data taken with the SHARP camera at the ESO NTT) between 1992 and 2002. The resulting position of the radio source SgrA* on the infrared image has a 1 uncertainty of 10mas, or about a factor 3 better than previously14. The new position of SgrA* is 50 mas E of the position given in reference 14. In spring 2002 the orbiting star S2 had approached SgrA* to within 10-20mas, thus giving the unique opportunity of determining the mass a factor 10-20 times closer in than in previous work.
The first measurements of orbital accelerations for S2 and S1, the two stars
closest to SgrA*, were consistent with orbits bound to a 3 million solar
mass central object, but still allowed a wide range of possible orbital
parameters5,6. Specifically, possible orbital periods for S2 ranged from
15 to 500 years5. With our new data, we are now able to determine a unique
orbit for S2 from astrometric proper motions and provide strong constraints on
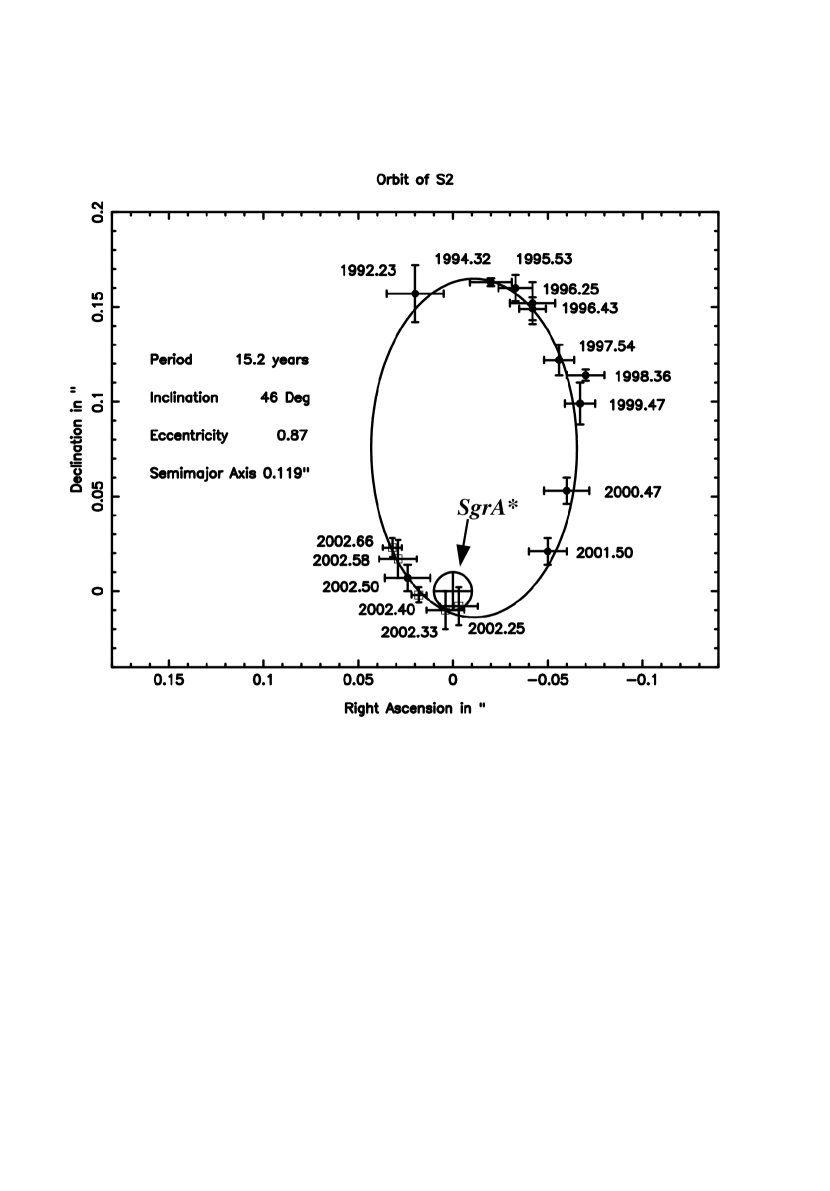
the mass distribution on distances below one light day. Figure 2 shows the
measured 1992-2002 positions of S2 relative to SgrA*. In spring 2002 we
happened to catch the peri-centre passage of the star, at which point the
measured velocity exceeded 5000 km/s, about 8 times greater than 6 years
ago1,2 when S2 was at apo-centre. The S2 data points trace two thirds of
a closed orbit and are robustly fit by a bound Keplerian orbit around a
central point mass located at the position of SgrA*. The parameters of the
best fitting orbit, along with their fit and astrometric errors are given in
Table 1. They were derived using the publicly available Binary Star Combined
Solution Package15. For the nominal SgrA* position, the uncertainties of
the fit parameters are generally . The additional uncertainty
introduced by the astrometric errors is of similar size. The semi-major axis
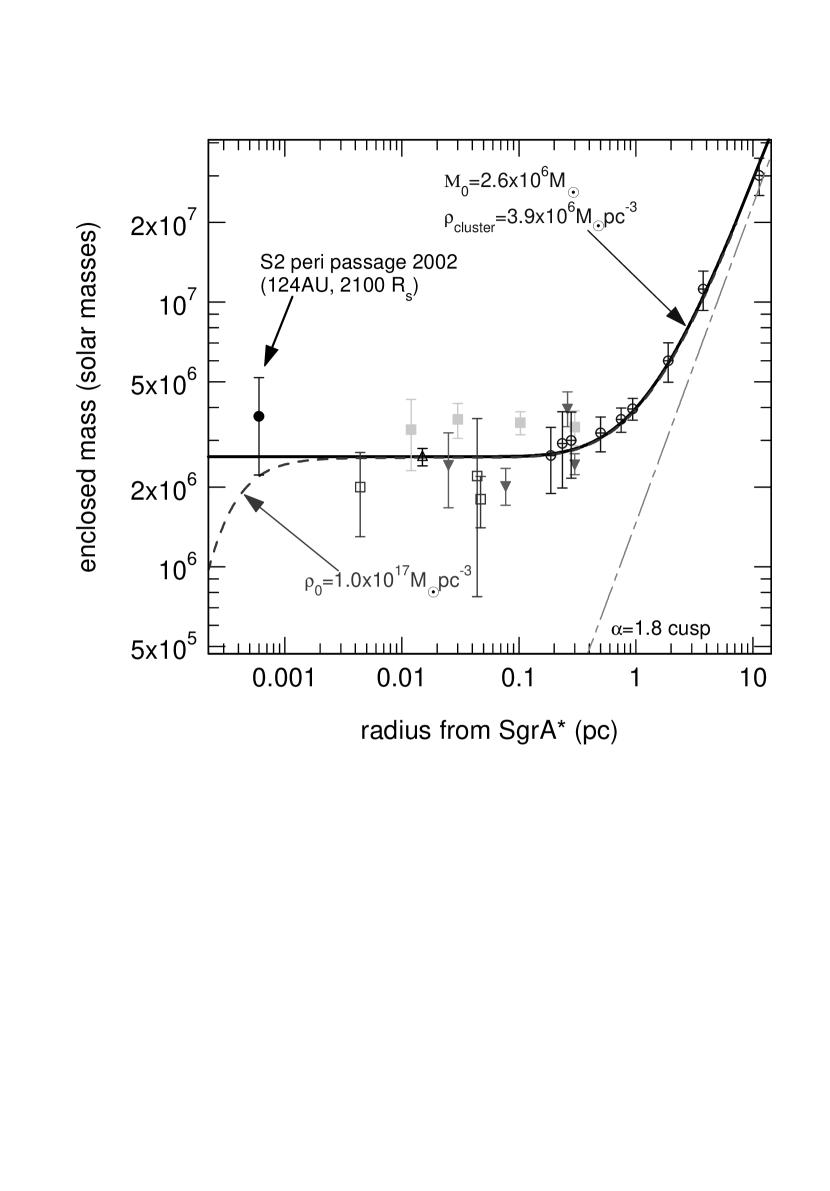
(a=5.5 light days) and orbital period (15.2 yrs) imply a mass of 3.7(1.5)106 M⊙ within the peri-centre radius of 124 AU,
or 17 light hours. The peri-centre passage of S2 in April/May 2002 thus
probes the mass concentration at 2100 times the Schwarzschild radius of
a 3 million solar mass black hole. The peri-centre distance radius of S2 is
70 times greater than the distance from the black hole where the star would be
disrupted by tidal forces (about 16 light minutes for a 15M⊙,
7R⊙ star like S22). Since tidal energy deposition falls faster
than the sixth power of the ratio of tidal radius to orbital radius, tidal
effects near the perinigricon of S2 are expected to be negligible, consistent
with its lack of infrared
variability.
The remarkable consequence of the orbital technique is that the mass can be determined from a single stellar orbit, in comparison to the statistical techniques that use several tens to hundreds of stellar velocities at 10 to 300 light days from SgrA* (Fig.3). In addition, the orbital technique requires fewer assumptions than the other estimates (e.g. equilibrium and isotropy of orbits), and thus is less vulnerable to systematic effects.
The Galactic centre mass distribution resulting from all available data is well fit by the combination of a M⊙ point mass (the supermassive black hole), plus the visible stellar cluster of core radius 0.34 pc, an outer power-law density distribution with exponent =1.8 and central density M⊙pc-3 (Figure 3). If the central point mass is replaced by a Plummer mass distribution, which is the most compact one expected realistically (with a power-law index of 5), in order to mimic the flatness of the observed mass distribution over 3 order of magnitude in radius4), its central density would have to exceed 1017M⊙pc-3, more than 4 orders of magnitude greater than previous estimates4,5,6. Such a Plummer distribution would be appropriate if the dark mass consisted of a dark cluster of low mass stars, neutron stars, or stellar black holes. The maximum lifetime of such a cluster mass against collapse (to a black hole) or evaporation would be less than a few 105 years16, clearly a highly implausible configuration. Further, theoretical simluations of very dense, core collapsed clusters predict much shallower, near isothermal density distributions (, see discussion in reference 2). We conclude that such a dark cluster model can now be safely rejected. Our new data also robustly exclude one of two remaining, ’dark particle matter’ models as alternatives to a supermassive black hole, namely a ball of heavy (10-17 keV/c2) fermions (sterile neutrinos, gravitinos or axinos) held up by degeneracy pressure17,18 , which in principle could account for the entire range of dark mass concentrations in galactic nuclei with a single physical model. Because of the finite size (0.9′′ diameter) of a non-relativistic, M⊙ ball of 16 keV fermions, the maximum (escape) velocity is about 1700 km/s and the shortest possible orbital period for S2 in such a fermion ball model would be about 37 years18, clearly inconsistent with the orbit of S2. The enclosed mass at perinigricon would require a neutrino mass of 50 keV, a value which can safely be excluded for neutrino ball models trying to explain the entire range of observed masses in galactic nuclei17,18. The only dark particle matter explanation that cannot be ruled out by the present data is a ball of bosons, as such a configuration would have a radius only several times greater than the Schwarzschild radius of a black hole16,19 However, it would be very hard to understand how the bosons first manage to reach such a high concentration, and then avoid forming a black hole by baryonic accretion16,19.The data on the Galactic centre thus show that the central mass distribution is remarkably well described by the potential of a point mass over 3 orders in magnitude in spatial scale, from 0.8 light days to 2 light years. The contribution of the extended stellar cluster around SgrA* to the total mass cannot be more than a few hundred solar masses within the peri-centre distance of the orbit of S2.
In this letter we have presented the first step in a new phase of near-infrared observations of the immediate surroundings of the central dark mass in the centre of the Milky Way. The observation of orbits of stars surrounding the central dark object offers a clean new way of constraining its mass distribution and testing the supermassive black hole model with the simple assumption of Keplerian orbits. Within the next years we hope to observe the accelerations and orbits of several faint stars near SgrA* that have become observable with the increased resolution and sensibility of the CONICA/NAOS camera/AO system at the VLT. Even more detailed observations of the SgrA* environment will become possible with infrared interferometry at the Large Binocular Telescope, the ESO VLTI and the Keck interferometer, which will provide a few to 10 mas (a few light hours) resolution and offer exciting prospects for the exploration of relativistic motions at 10-100 Schwarzschild radii from the central black hole20.
References
- (1) Eckart, A. & Genzel, R., Observations of stellar proper motions near the Galactic Centre. Nature, 383, 415–417 (1996).
- (2) Genzel, T., Eckart, A., Ott, T. & Eisenhauer, F., On the nature of the dark mass in the centre of the Milky Way. Mon.Not.R.Soc., 291, 219-234 (1997).
- (3) Ghez, A., Klein, B.L., Morris, M. & Becklin, E.E., High Proper-Motion Stars in the Vicinity of Sagittarius A*: Evidence for a Supermassive Black Hole at the Center of Our Galaxy. Astrophys.J., 509, 678-686 (1998).
- (4) Genzel, R., Pichon, C., Eckart, A., Gerhard, O. & Ott, T., Stellar dynamics in the Galactic Centre: proper motions and anisotropy. Mon.Not.R.Soc., 317, 348-374 (2000).
- (5) Ghez, A., Morris, M., Becklin, E.E., Tanner, A. & Kremenek, T., The accelerations of stars orbiting the Milky Way’s central black hole. Nature, 407, 349-351 (2000).
- (6) Eckart, A., Genzel, R., Ott, T. & Sch del, R., Stellar orbits near Sagittarius A*. Mon.Not.R.Soc., 331, 917-934 (2002).
- (7) Baganoff, F.K., et al., Rapid X-ray flaring from the direction of the supermassive black hole at the Galactic Centre. Nature, 413, 45–48 (2001).
- (8) Kormendy, J., & Richstone, D., Inward Bound – The Search for Supermassive Black Holes in Galactic Nuclei. ARA&A, 33, 581–624 (1995).
- (9) Backer, D.C. & Sramek, R.A., Proper Motion of the Compact, Nonthermal Radio Source in the Galactic Center, Sagittarius A*. Astrophys.J., 524, 805–815 (1999).
- (10) Reid, M.J., Readhead, A.C.S., Vermeulen, R.C. & Treuhaft, R., The Proper Motion of Sagittarius A*. I. First VLBA Results. Astrophys. J., 524, 816–823 (1999).
- (11) Lenzen, R., Hofmann, R., Bizenberger, P. & Tusche, A., CONICA: the high-resolution near-infrared camera for the ESO VLT. Proc. SPIE, IR Astronomical Instrum. (A.M.Fowler ed), 3354, 606–614 (1998).
- (12) Rousset, G. et al., Design of the Nasmyth adaptive optics system (NAOS) of the VLT. Proc.SPIE Adaptive Optics Technology, (D.Bonaccini & R.K.Tyson eds), 3353, 508–516 (1998).
- (13) Brandner, W. et al., NAOS+CONICA at YEPUN: First VLT Adaptive Optics System Sees First Light, The ESO Messenger, 107, 1–6 (2002).
- (14) Menten, K.M., Reid, M.J., Eckart, A. & Genzel, R., The Position of Sagittarius A*: Accurate Alignment of the Radio and Infrared Reference Frames at the Galactic Center. R. Astrophys.J., 475, L111–115 (1997).
- (15) Gudehus, D.H., A Multiple-Star Combined Solution Program - Application to the Population II Binary Cas. American Astronomical Society Meeting, 198, #47.09 (2001).
- (16) Maoz, E., Dynamical Constraints on Alternatives to Supermassive Black Holes in Galactic Nuclei, Astrophys. J., 494, L181–184 (1998).
- (17) Tsiklauri, D. & Viollier, R.D., Dark Matter Concentration in the Galactic Center. Astrophys. J., 500, 591–595 (1998).
- (18) Munyaneza, F. & Viollier, The Motion of Stars near the Galactic Center: A Comparison of the Black Hole and Fermion Ball Scenarios. R.D. Astrophys. J., 564, 274–283 (2002)
- (19) Torres, D. F., Capozziello, S. & Liambase, G., Supermassive boson star at the galactic centre?. Phys.Rev.D., 62, id.104012 (2000).
- (20) Rubilar, G.T. & Eckart, A., Periastron shifts of stellar orbits near the Galactic center. Astron.Astrophys.374,95-104 (2001)
- (21) Reid, M.J., The distance to the center of the Galaxy. Ann.Rev.Astron.Astrophys., 31, 345–372 (1993).
- (22) Chakrabarty, D. & Saha, P., A non-parametric estimate of the mass of the central black hole in the Galaxy. Astron.J., 122, 232-241 (2001).
Acknowledgments We thank the teams who developed and constructed the near-infrared camera CONICA and the adaptive optics system NAOS. We are grateful to all the instrument scientists and ESO staff involved in the commissioning of CONICA/NAOS for generous observations of the Galactic Center. We thank C. H. Townes and J. Kormendy for valuable comments. We thank D. Gudehus for his friendly assistance with the Binary-Star Combined Solution Program.
| Parameter | Value | Formal Error | Astrom. Error |
| Black hole mass [10M⊙] | 3.7 | 1.0 | 1.1 |
| Period [years] | 15.2 | 0.6 | 0.8 |
| Time of peri-centre passage [year] | 2002.30 | 0.01 | 0.05 |
| Eccentricity | 0.87 | 0.01 | 0.03 |
| Angle of line of nodes [degrees] | 36 | 5 | 8 |
| Inclination [degrees] | 46 | 3 | 3 |
| Angle of node to peri-centre [degrees] | 250 | 4 | 3 |
| Semi-major axis [mpc] | 4.62 | 0.39 | 0.43 |
| Separation of peri-centre [mpc] | 0.60 | 0.07 | 0.15 |
Figure 1: Ks-band image of the centre of the Milky Way.
Left: Diffraction limited (60 mas FWHM) Ks-band (2.1m) image of the
central of the Milky Way, obtained with the
CONICA/NAOS adaptive optics imager on UT4 (Yepun) of the VLT on May 3rd, 2002.
North is up and East to the left, scales are for an assumed distance of 8 kpc
(26,000 light years)4,21. The unique infrared wavefront sensor was used
to close the loop of the adaptive optics system on the bright supergiant IRS
7, 6′′ north of SgrA*. The Strehl ratio is
40%. The radio positions of 7 SiO maser stars (open circles) were used to
align the infrared image with the radio astrometry frame (Reid et al. 2002, in
prep.). The SiO masers originate in the central mas of the
circumstellar envelopes of infrared bright, red giants/supergiants. The
radio-to-infrared registration is accurate to mas (including the
effect of variation of the point spread function across the field), a factor 3
improvement over reference 14. There we could only use two SiO sources,
giving the centre position, rotation angle and a single pixel scale for the
infrared images. Our new analysis allows solving, in addition, for second
order imaging terms (small for CONICA/NAOS, but significant for the earlier
SHARP/NTT data). Right: The central region
(rectangle in left inset) around the compact radio source SgrA* (cross). This
image is a sum of images taken in May 2002 and has been deconvolved with a
linear Wiener filter method to remove the seeing halos. The ring structures
around the brighter stars are artefacts of the linear deconvolution algorithm
that arise because information on the point spread function in Fourier space
is not known up to infinite frequencies. Several of the stars near SgrA* are
marked, including the presently closest star (S2).
Figure 2: Orbit of S2 around SgrA*.
Orbit of S2, relative to the position of SgrA* (large cross and circle,
denoting the mas uncertainties of the infrared-radio astrometry).
The filled small circles (with 1 errors) between 1992 and 2001, and
at 2002.50, denote the results of our speckle imaging with the SHARP camera on
the ESO NTT4,6. The five open rectangles are the CONICA/NAOS data points
on 2002.25, 2002.33, 2002.40, 2002.58 and 2002.66. The projection of the best
fitting Kepler orbit is shown as a thick continuous curve, with main
parameters listed adjacent to the orbit (see also Table 1). For determination
of the orbital elements (Table 1) we used the publicly available Binary Star
Combined Solution Package15, which computes best fit orbits from
position-time series (including their errors). Uncertainties in the derived
parameters are determined from a covariance matrix analysis. The additional
uncertainty introduced by the astrometric errors is of similar size and was
estimated by letting the position of SgrA* vary randomly within its 1
astrometric uncertainty limits and examining the change in the resulting
orbital parameters. Since we do not know the line-of-sight velocity of the
star, the sign of the inclination given in Table 1 is undetermined. The angle
of the line of nodes (36 deg) is counted E of N, with N up and E to the left.
The angle from node to peri-centre is counted from the node in the NE
quadrant in the direction of the motion of S2.
Figure 3: Mass distribution in the Galactic Centre.
Mass distribution in the Galactic centre (for an 8 kpc distance21). The
filled circle denotes the mass derived from the orbit of S2. The error bar
combines the orbital fit and astrometry errors (Table 1). Filled triangles
denote Leonard-Merritt projected mass estimators from a new NTT proper motion
data set by Ott et al. (2002, in preparation), separating late and early type
stars, and correcting for the volume bias in those mass estimators by scaling
with correction factors (0.88-0.95) determined from Monte Carlo modeling of
theoretical clusters4. An open rectangle
denotes the Bahcall-Tremaine mass estimate obtained from Keck proper motions3. Light filled rectangles are mass estimates from a parameterized
Jeans-equation model from reference 4, including anisotropy and
differentiating between late and early type stars. Open circles are mass
estimates from a parameterized Jeans-equation model of the radial velocities
of late type stars, assuming isotropy4. Open rectangles denote mass
estimates from a non-parametric, maximum likelihood model, assuming isotropy
and combining late and early type stars22. The different statistical
estimates (in part using the same or similar data) agree within their
uncertainties but the variations show the sensitivity to the input
assumptions. In contrast, the new orbital technique for S2 is much simpler
and less affected by the assumptions. The continuous curve is the overall best fit model to all data. It is a sum of a M⊙ point mass, plus a stellar cluster of central density M⊙/pc3, core radius 0.34 pc and power-law index . The long dash-short dash curve shows the same stellar cluster
separately, but for an infinitely small core (i.e. a ’cusp’). The thick dashed
curve is the sum of the visible cluster, plus a Plummer model of a
hypothetical concentrated (, very compact (R0.00019 pc)
dark cluster of central density M⊙pc-3.