BL Lacertae: the multiwavelength campaign of 2000
Abstract
We present two BeppoSAX observations of BL Lacertae as part of a multiwavelength radio–to–TeV campaign. During the first observation we observe a faint Compton spectrum, while during the second, we detect a synchrotron spectrum with the highest [2-10] keV flux ever measured; above 10 keV an inverse Compton component begin to dominate. The synchrotron flux is very variable with time scales of hr. We describe four different SED shifting the synchrotron peak both in frequency and flux intensity and we sketch a scenario in which a blob moves along a jet and can be located in or outside the BLR. This implies different radiative mechanism at work, SSC or external Compton, producing different high energy spectra.
1 Introduction
Blazars are radio loud active galactic nuclei characterized by
an extremely wide spectral range, from radio to –ray
(sometimes up to TeV frequencies) and by fast and large variability:
simultaneous multiwavelength observations are therefore the
most powerful tool to reveal the underlying mechanisms.
During the last 20 years, BL Lacertae, the BL Lac prototype,
has been the target of many multiwavelength campaigns
(Bregman et al., 1990; Kawai et al., 1991;
Sambruna et al., 1999; Madejski et al., 1999; Ravasio et al., 2002).
X–ray observations are particularly interesting for this source,
because they have revealed the transition from
synchrotron, which is rapidly varying, to the more quiet
inverse Compton emission (Ravasio et al., 2002).
Therefore during the second half of 2000 a new multiwavelength campaign
was organized, ranging from radio to TeV energies: the X–ray band
was covered by BeppoSAX,
with a sec run in the core of the campaign (July 17 – August 11;
Ravasio et al., in prep.)
and by RXTE, which assured 3 short pointings per week
(Marscher et al., in prep.).
Besides X–ray, the campaign comprised radio
(4.8, 8, 14.5 GHz: Michigan Radio Astronomy Observatory;
22, 37 GHz: Metsähovi Radio Telescope) , optical (WEBT collaboration,
Villata et al., 2000) and VHE –ray observations (CAT; HEGRA).
Because of an increase in the activity of the source (Villata et al., 2002),
the campaign was prolonged until the end of 2000,
with a second BeppoSAX observation started at the end of October.
During the autumn, the HEGRA team
accumulated 10.5 hrs on–source time and was
able to set an upper limit of of the Crab flux above 0.7 TeV
(Mang et al., 2001). For a more detailed description of the campaign,
we refer to Böttcher et al. (in prep).
2 X–ray observations
BeppoSAX observed the source while in two different optical states:
during October–November BL Lac was 1.5-2 times brigher
than in July (M).
The differencies are further evident
in the X–ray: when optically faint the source was not detected
by the PDS experiment and
the [0.6-10] keV LECS–MECS spectrum can be interpreted as inverse Compton
emission, since it is well fitted
by a hard power law model of index (NH fixed to
cm-2;
Sambruna et al., 1999; Ravasio et al., 2002).
During the second observation,
the PDS detected the source up to keV;
the [0.3-10] keV flux was the highest recorded for BL Lac
and the spectrum was well
fitted by a convex broken power law, softening at E keV
(see table 1). PDS data lie above the described model
leaving positive residuals becoming larger towards higher energies:
this can be explained as the transition from a steepening synchrotron
component to an hard inverse Compton, dominating above keV.
BeppoSAX data are confirmed by the simultaneous RXTE [3-15] keV
spectra: fitting them with power law models, we obtained
and
for the summer and autumn observations respectively (see table 1).
| Date | Instrument | Eb | F2-10keV | ||
|---|---|---|---|---|---|
| (keV) | (ergs cm-2 s-1) | ||||
| 26–27/7/2000 | BeppoSAX | ||||
| 26/7/2000 | RXTE | ||||
| 31/10–2/11/2000 | BeppoSAX | ||||
| 2/11/2000 | RXTE |
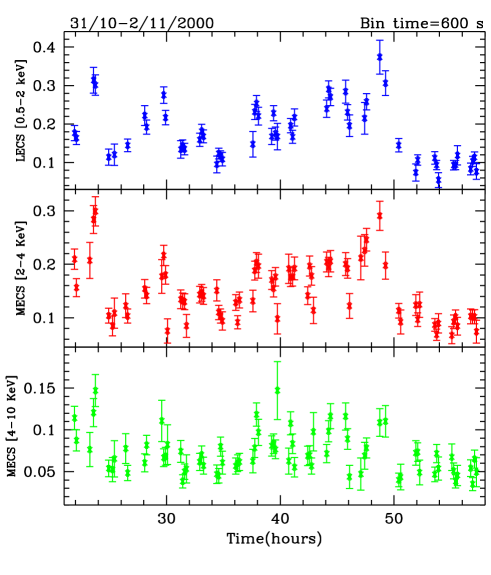
The temporal behaviour of the source confirmed the high state of activity
during the autumnal observation :
BeppoSAX detected flux variations of more than a factor 3 in
time scales of 1 hr (see fig. 1).
This is similar to the event flare detected during
the observation of July 1999 (Ravasio et al., 2002). In that occasion,
the BL Lac X–ray spectrum was displaying
the transition between the two emission
mechanisms: the flare was visible only in the energy range where synchrotron
radiation was dominating. In autumn 2000, instead,
both LECS and MECS were seeing synchrotron emission:
the fast and large variability is found in the full 0.1–10 keV energy
range.
This extreme behaviour is not surprising since we are observing
the emission of very energetic electrons ()
that cool very quickly ( sec).
Furthermore, the spectrum is steep: a small change in the spectral slope
will produce large flux variations.
3 Discussion
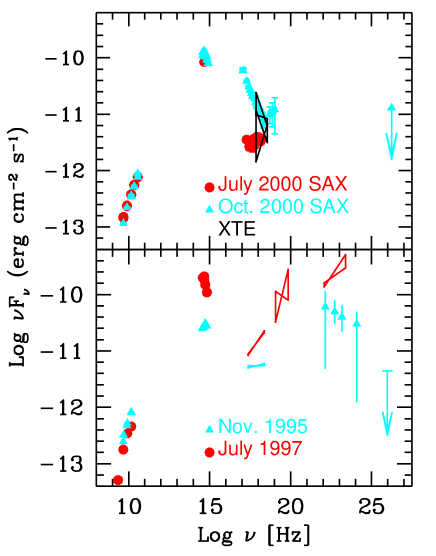
The great differencies discussed above are clearly evidenced in the
Spectral Energy Distributions reported in fig. LABEL:fig2.
To show the complex behaviour of BL Lac
we plotted also two historical simultaneous SEDs, relative to
the faint state of November 1995
and to the big flare of July 1997:
the high energy peak of this first SED
was interpreted by Sambruna et al. (1999)
as SSC emission (Maraschi, Ghisellini & Celotti, 1992), while the
hardness of the X–to––ray flaring spectrum was attributed
by Madejski et al. (1999) to an
External Compton mechanism (Sikora, Begelmann & Rees, 1994).
Shifting the synchrotron component in frequencies and fluxes
we can phenomenologically reproduce
all the observed SEDs, except the one of the big flare of July 1997:
in that case,
the X–ray Compton spectra was extremely higher (more than a factor 4)
than all the other Compton spectra, while the synchrotron
component was similar. This uniqueness
can be accounted for using a simple scenario: a synchrotron emitting blob
moving along a jet can be inside or outside the Broad Line Region
(see also Ravasio et al., 2002).
If outside, the synchrotron photons will be the only available
targets for inverse Compton scattering; if inside, otherwise, there will be
also the disk emission reprocessed by the BLR. In the special case
in which a BLR cloud is present along the jet, there would
be a futher target radiation field, composed by the synchrotron radiation
reprocessed by the cloud (Ghisellini & Madau, 1996).
This latter case could explain the extraordinary
X–to––ray spectra seen during July 1997.
We are not able to distinguish the engine producing the spectra
of 2000, since we lack –ray informations. Anyway the fast variability
suggest the compactness of the emitting region: during the second observation,
the blob could be inside the BLR, producing an hard high energy component.
Acknowledgments
This research was financially supported by the MURST and by the Italian Space Agency.
References
References
- [1] Böttcher M. et al., in prep.
- [2] Bregman J.N., Glassgold A.E., Huggins P.J. et al., 1990, ApJ, 352, 574
- [3] Ghisellini G. & Madau P., 1996, MNRAS, 280, 67
- [4] Kawai N., Matsuoka M. et al., 1991, ApJ, 382, 508
- [5] Madejski G.M., Sikora M., Jaffe T., Blażejowski M., Jahoda K., Moderski R., 1999, ApJ, 521, 145
- [6] Mang O. et al., 2001, in proc. of the 27th ICRC, 2658
- [7] Maraschi L., Ghisellini G. & Celotti A., 1992, ApJ, 397, L5
- [8] Marscher A.P. et al., in prep.
- [9] Ravasio M., Tagliaferri G., Ghisellini G. et al., 2002, A&A, 383, 763
- [10] Ravasio M., Tagliaferri G., Ghisellini G. et al., in prep.
- [11] Sambruna R.M., Ghisellini G., Hooper E., Kollgard R.I., Pesce J.E., Urry C.M., 1999, ApJ, 515, 140
- [12] Sikora M., Begelman M.C. & Rees M., 1994, ApJ, 421, 153
- [13] Villata M. et al., 2000, A&A, 363, 108
- [14] Villata M., Raiteri C.M. et al., 2002, A&A, 390, 407