Emission and Absorption in the M87 LINER11affiliation: Based on observations with the NASA/ESA Hubble Space Telescope obtained at the Space Telescope Science Institute, which is operated by the Association of Universities for Research in Astronomy, Inc., under NASA contract NAS5-26555.
Table 1: HST STIS and FOS Observations
Table 2: Observed Emission-Line Fluxes (STIS & FOS)
Table 3: Photoionization Predictions1
Table 4: Absorption Lines (STIS, G140L)
Table 5: Absorption Lines (FOS, G270H, G400H, G570H)
Abstract
The nucleus of M87 displays a LINER spectrum at optical wavelengths, with a nuclear disk of nebulosity that is resolved by the Hubble Space Telescope. We present new results from optical and ultraviolet spectra of the central pc as measured by HST. In contrast with previous results for the extended disk, the emission-line spectrum of the central region is best reproduced by a multi-component photoionization scenario, rather than shock heating. The nebular properties as well as energetic considerations suggest a transition on scales of several tens of parsecs, from predominantly photoionization by a central accretion source, to shock ionization within the disk. If this source is at all representative, it suggests that many LINERs may be composite in terms of the energetic processes that give rise to the emission spectrum. We also report measurements of resonance-line absorption for the nucleus. The absorption spectrum, like the emission lines, is characterized by low ionization. The absorption line measurements coupled with independent constraints suggest a total hydrogen column density of cm-2, outflowing from the galaxy center with a velocity of km s-1. The kinematic signature of an outflow, along with evidence that the absorber covers the power-law continuum source but not the emission-line clouds, suggests that the absorbing matter is related to accretion phenomena in the nucleus. The presence of such an outflow resembles similar behavior in luminous AGNs, although the low ionization that characterizes LINERs is probably indicative of a different mode of accretion in these sources.
1 Introduction
A large fraction of nearby galaxies harbor low-ionization nuclear emission-line regions (LINERs; e.g., Heckman 1980; Ho, Filippenko, & Sargent 1997). A variety of mechanisms have been suggested for the underlying power source in these objects, including shocks, black hole accretion, and hot stars. LINER case studies have revealed candidate prototypes for each of these phenomena, strengthening speculation that LINERs are a heterogeneous class (e.g., Filippenko 1996).
The LINER galaxy M87 is a particularly interesting example. Ground-based optical spectra of its nucleus show narrow-line emission with a complex velocity profile, but no clear signature of the broad permitted lines that are the hallmark of quasar activity. Observations with the Hubble Space Telescope (HST) reveal a spatially resolved disk of emission at the nucleus, and analysis of emission from the disk provides strong evidence of shock excitation (Dopita et al. 1997, hereafter D97). Considered alone, these properties give little indication that the system is related to luminous AGNs; yet this object provides one of the best cases for accretion-powered activity in the nucleus of a galaxy. The evidence takes the form of its famous synchrotron jet (e.g., Boksenberg et al. 1992; Bicknell & Begelman 1996) and a velocity field in the nuclear gas disk requiring the presence of a central dark object with a mass of M⊙ (Ford et al. 1994; Harms et al. 1994; Macchetto et al. 1997).
One possible interpretation of the existing results for M87 is that LINER emission is caused primarily by shocks, even when coexistent with an accretion power source that may generate substantial ionizing radiation. This scenario contrasts markedly with the behavior of Seyfert galaxies, which have narrow-line emission powered primarily by photoionization (e.g., Laor 1998). Moreover, the evidence for shocks in the M87 disk comes from ultraviolet emission-line ratios, but the same diagnostics observed in a handful of other LINERs do not provide similar indications of mechanical heating (e.g., Barth et al. 1996, 1997; Maoz et al. 1998). The latter finding may imply that the LINER in M87 is an anomaly; however, another possibility is that the uncharacteristic result for this source reflects the unusual circumstance that its central nebulosity is resolved, and the previous HST study considered emission from only a part of the disk that did not include the nucleus per se. In order to understand fully the nature of the nebulosity at the center of M87, and to assess the larger implications for LINERs, measurement of the UV/optical spectrum of the nucleus is clearly desirable. In this paper we present the results of spectroscopic observations carried out with HST for this purpose.
2 Observation and Data Analysis
Long-slit spectra of the nucleus of M87 were obtained with the Space Telescope Imaging Spectrograph (STIS) on 1999 February 1 UT, using the 52″ 05 aperture and the gratings listed in Table 1. The slit was oriented at position angles and for the optical (CCD) and UV (MAMA) data, respectively. (The difference in position angle resulted unintentionally from a roll-angle adjustment during the observation sequence.) The resulting spectra provide continuous wavelength coverage of the nucleus in the range Å. The relatively large slit width leads to rather low spectral resolution (see Table 1) but was selected in order to maximize the measured signal in the UV bandpass, while maintaining a uniform aperture dimension across the entire spectrum. The full-width at half maximum (FWHM) spatial resolution is for the MAMAs, and for the CCDs. The data were calibrated “On-The-Fly” upon retrieval from the data archive at the Space Telescope Science Institute. All data reduction and analysis was performed with IRAF111IRAF is distributed by the National Optical Astronomy Observatories, which are operated by the Association of Universities for Research in Astronomy, Inc., under cooperative agreement with the National Science Foundation.. With this slit width, geocoronal Ly is blended with the redshifted Ly from M87. We measured the background geocoronal emission in the G140L spectrum near the ends of the slit, and subtracted the result from each row of the two-dimensional spectrum, making sure that we also propagate errors in the correct way.
Spectra of the nucleus were extracted for an aperture size of along the slit (i.e., 10 MAMA pixels and 5 CCD pixels, corresponding to approximately twice the spatial FWHM for the CCD). The result is shown in Figure 1. In order to aid in removing any underlying galaxy starlight, we generated a stellar continuum template by averaging the spectra of off-nucleus regions that were emission-free. The resulting aperture was ( for UV spectra) wide and centered at ( for UV spectra) southwest of the nucleus. Emission from the nebular disk at these scales is negligible within our aperture, in comparison with that measured from the nucleus. HST images show a rapid fall-off of nebular surface brightness with radius (e.g., D97). In contrast with the FOS study reported by D97, which measured the spectrum 06 from the nucleus with a 10 aperture, the data reported here employ a narrower slit, and consequently do not exhibit a signal-to-noise ratio sufficient to measure nebular features outside the central aperture defined above.
We measured the fluxes of the emission features while simultaneously fitting the continuum, via minimization, using SPECFIT as implemented in IRAF (Kriss 1994). We fitted Gaussians to the emission lines, and represented the continuum as the sum of a featureless power law and the galaxy template. The results of the measurements are given in Table 2. In all cases, the fit results were consistent with the continuum being dominated by the power-law component. Errors were evaluated by SPECFIT from the accompanying error extensions to the spectra. The FWHM velocity for H is km s-1, after correcting for the instrumental profile for a point source, and km s-1 if the emission is extended uniformly across the slit; the latter value can thus be taken as a lower limit. Due to the significant intrinsic velocity width and the low spectral resolution, H was heavily blended with [N II] 6548, 6583, and the [S II] 6717, 6731 lines were also heavily blended with each other; no attempt was made at deblending these composite features, which we instead fit by single Gaussians. The width and redshift of the [O I] 6364 template were linked to those of [O I] 6300 and, as dictated by atomic physics (Osterbrock 1989), [O I] . The same procedure was followed for [O III] 4959, 5007.
A joint analysis of the optical and UV spectra is potentially sensitive to reddening. The fact that H was heavily blended with the [N II] lines makes it impossible to get a direct measure of reddening using the H/H ratio. Moreover, H is blended with [S II] 4069, 4076, and H leads to unphysical extinction values when combined with H; this may be due to an overestimate of the H flux caused by blended emission in [O III] 4363. Our spectral range includes the recombination lines He II 4686 and He II 1640. For Case B recombination, the ratio He II (Hummer & Storey 1987). Our spectra set a upper limit on He II 4686 of 20% of H. This limit is calculated according to the formula (14Å), where is the root-mean-square uncertainty per Ångstrom in the local continuum, and 14 Å is the measured Gaussian dispersion of the H profile. (This prescription corresponds to a Gaussian profile with amplitude .) The result is (He II . Employing the extinction curve of Cardelli, Clayton, & Mathis (1989), we find that mag. The Galactic foreground extinction toward M87 is expected to be much less than this value, and independent estimates of the total absorption (§3) suggest that the Galactic component dominates the total extinction, with mag.
Additional spectra of the nucleus of M87 spanning 1140 – 6820 Å were obtained on 1996 July 2 UT with the FOS, using the 021 aperture (Table 1). The calibrated data were obtained from the public domain archive. We measured the emission lines as for the STIS spectra, assuming a power-law form for the continuum. Uncertainties in the line fluxes are generally larger for the FOS observations, reflecting a somewhat lower signal-to-noise ratio. Measurements from the two spectra are in general agreement although significant differences are present in Ly, which may be affected by uncertain geocoronal subtraction for the FOS spectrum, and [Ne III] 3869.
In addition to emission lines, there is a wealth of UV absorption features seen in the spectra. The velocity shifts of some lines are consistent with absorption within the Galaxy, while others appear associated with M87. We used spectra with the highest spectral resolution for our absorption-line measurements. Table 1 shows that all the FOS gratings have higher spectral resolution than those employed with STIS, except for FOS G160L, which has a lower resolution than STIS G140L. The absorption lines in the FOS spectra segregate into two systems distinguished by their line widths; those with FWHM 200 km s-1 are of Galactic origin (and are unresolved), while those with FWHM 400 km s-1 are intrinsic to M87, where the FWHM values quoted here have not been corrected for the instrument profile of FWHM km s-1. The absorption lines in the STIS G140L have FWHM km s-1, uncorrected for the line-spread function of FWHM km s-1 for a point source; the velocity widths of many features in this spectrum are potentially affected by blends. Identification of features was based on wavelength correspondence with line lists from Verner, Barthel, & Tytler (1994), and consistency tests with the measured line strengths or upper limits for resonance features from the same ions.
The STIS and FOS observations are separated by years. The equivalent widths of the absorption lines agree to within the measurement errors. The continuum level in the FOS spectrum is higher by 20%, with greater contrast at shorter wavelength. Tsvetanov et al. (1998) discussed variability in the optical continuum during 1994 and 1995, and found differences of a factor of on a timescale of 2.5 months, so variability is clearly a concern when comparing measurements from different epochs.
3 Results and Interpretation
The physical interpretation of nebular emission in LINERs is complicated by the fact that several different energy sources may give rise to such emission. Theoretical predictions of optical lines are degenerate in the sense that the same line ratios can be explained equally well by more than one physical scenario, including in particular shocks and photoionization (e.g., D97; Allen, Dopita, & Tsvetanov 1998). Allen et al. (1998) have suggested that the inclusion of ultraviolet emission diagnostics provides a basis for distinguishing between shocks and photoionization, and UV emission lines figure prominently in the analysis by D97 implicating shocks in the extended nuclear disk in M87. In the present study we extend this analysis to the interpretation of the emission of nuclear emission as measured in the central , corresponding to pc (for an assumed distance of 16.1 Mpc; Tonry et al. 2001).
3.1 Line Ratio Diagrams and the Excitation Mechanism
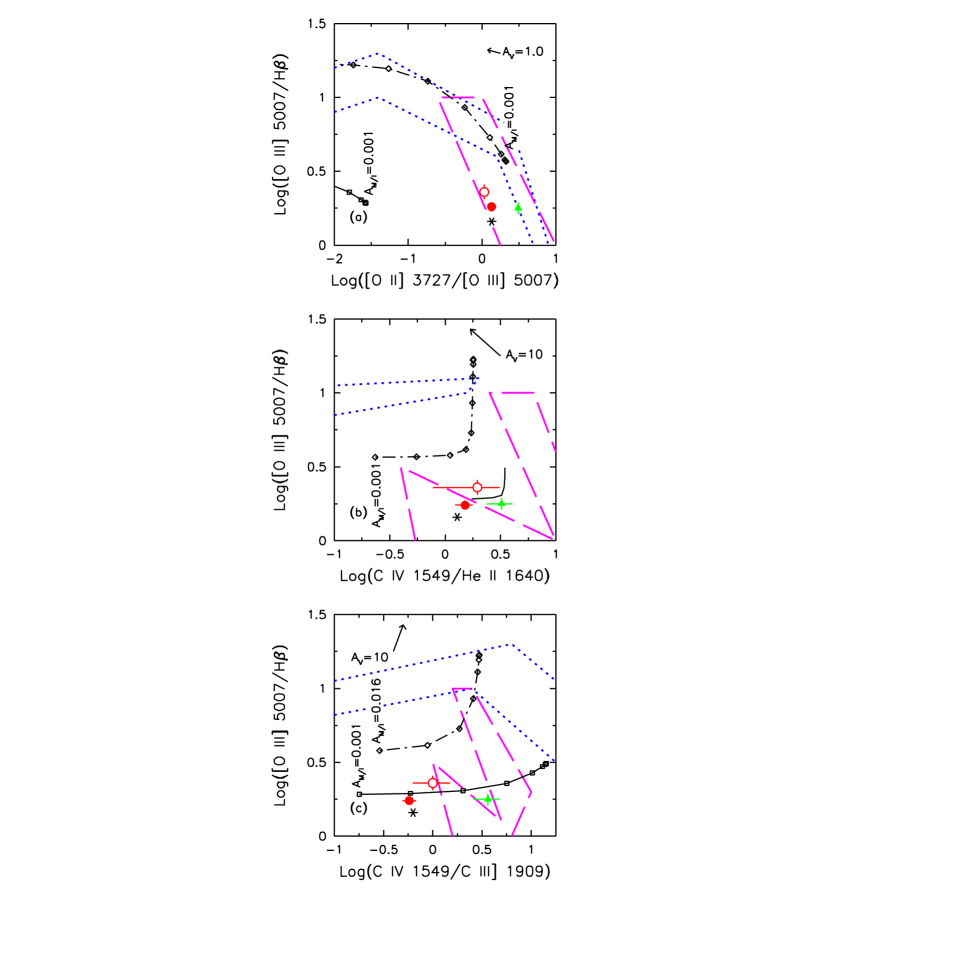
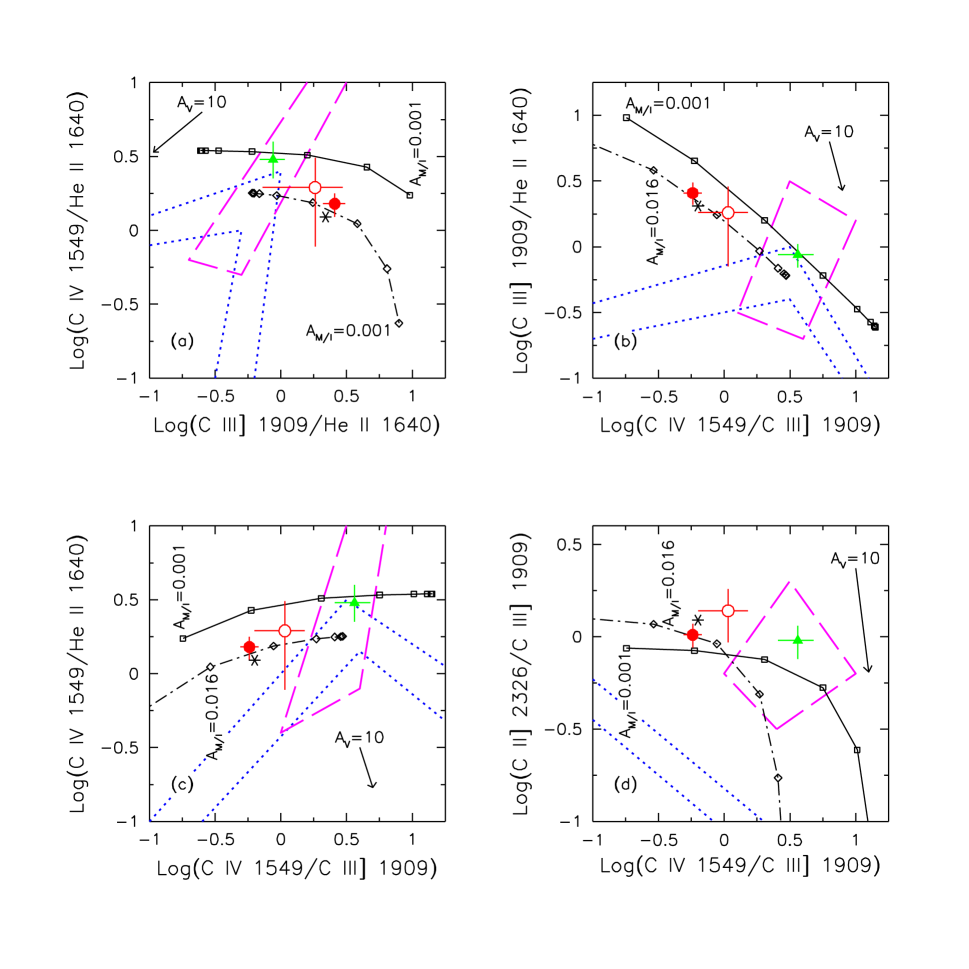
Comparisons of our measurements with theoretical predictions are presented in two-dimensional line ratio diagrams in Figure 2, which employs optical and UV lines, and Figure 3, which uses exclusively UV lines. These diagrams are selected from those shown by D97 and Allen et al. (1998) to hold promise for distinguishing ionization processes. In addition to our STIS results, line ratios from the FOS spectra of the nucleus (our measurements) and of the ionized disk (D97) are also shown. The diagrams involve intensity ratios of lines close in wavelength, so that they are relatively insensitive to reddening; the plotted data points have consequently not been corrected for reddening.
Predictions for several excitation mechanisms are overplotted in Figures 2 and 3. Predicted ratios for shock excitation are taken from Dopita & Sutherland (1995); for their models, the parameters that produce the range in line ratios are the shock velocity and the magnetic parameter , where is the magnetic field strength and is the hydrogen number density. Predictions for photoionized plasma assume power-law continua with a spectral index (assuming ), density cm-3, and ionization parameter , where is the ratio of ionizing photon and hydrogen densities at the face of the irradiated cloud (Binette, Wilson, & Storchi-Bergmann 1996).
A possible limitation of these photoionization models is their assumption of a single population of ionization-bounded clouds. Binette et al. (1996) have argued that the spectra of AGN narrow-line regions can be better reproduced by photoionization scenarios with multi-component cloud systems; in particular, they emphasize the possible importance of a mix of ionization- and matter-bounded clouds. We have consequently also shown for comparison in Figures 2 and 3 the predictions of a two-zone photoionization model, in which we have reproduced the Binette et al. results using the photoionization code CLOUDY, version 90.05 (Ferland et al. 1998). In this scenario, matter-bounded (MB) clouds filter the ionizing continuum from the AGN before it irradiates the ionization bounded (IB) clouds. The MB clouds are irradiated by a power law with , and are characterized by and cm-3, while the IB clouds have and cm-3. The relative contribution of emission from the two cloud populations is parametrized by , which is the ratio of solid angles subtended by MB and IB clouds. Formally, is always larger than one, but in calculating the resulting spectrum, it can be effectively less than one if the MB clouds are hidden along our line of sight but seen by the IB gas.
The measured ratios reported by D97 at an off-nuclear position, and for the nucleus as given here, are different, and Figures 2 and 3 suggest different interpretations for the two locations. A similar inference was noted by Sankrit, Sembach, & Canizares (1999) based on FOS measurements of the C IV/Ly ratio alone. As discussed by D97 and illustrated also here, the line ratios for the off-nucleus measurement of M87 are consistent in all of these diagrams with a shock interpetation; the photoionization predictions, particularly the single cloud models, do not agree with the data. The line ratios measured for the M87 nucleus are, however, less clear-cut in their interpretation. In Figure 2 (optical and UV lines), the nucleus ratios generally fall within the shock model loci and are inconsistent with both single-cloud and photoionization predictions. However, in Figure 3 (UV lines) the nucleus measurements fall outside the predictions for shocks. Single-cloud photoionization models are likewise inconsistent with these data; but the sequence intersects the measured ratios in all of the plots in Figure 3, and in most cases the data are in fact consistent with predictions for a single value of . This result provides a strong suggestion that photoionization is, in fact, important in the nucleus. In contrast, comparison of the observed ratios with the detailed shock models of Dopita & Sutherland (1995) shows that the optical line ratios in Figure 2 are not reproduced by a single combination of shock parameters. The model remains problematic, however, for explaining the optical line ratios in Figure 2 as well as generally underpredicting the strengths of the UV lines relative to H for the nucleus.
Is it possible to reconcile a single excitation scenario with the nucleus line ratios plotted in both Figures 2 and 3? It is interesting to note that the division between optical and UV lines separates strong transitions not only by excitation energy, but also by the critical densities for the collisionally excited lines: lower for the optical lines, which are forbidden transitions, and higher for the UV lines, which are intercombination or resonance features. As a result, increasing the plasma density will affect the predicted line strengths in different ways; the forbidden lines will become suppressed, while the lines with high will strengthen as they take over a larger share of the nebular cooling. For the M87 nucleus, increasing the nebular density might thus be expected to improve the success of photoionization models by decreasing the [O III]/H ratio and boosting the strengths of the UV lines relative to H. Nebular components spanning a wide range of density are known to exist within AGNs, as revealed by line width- correlations (e.g., Pelat, Alloin, & Fosbury 1981; Filippenko & Halpern 1984; Filippenko 1985), and dense components on small spatial scales are explicitly revealed in nuclei through HST studies (e.g., Barth et al. 2001).
To investigate these effects, we experimented with sequences with increased densities and found that many characteristics of the nuclear spectrum are reproduced if cm-3 and cm-3. The calculation results are again shown for comparison in Figures 2 and 3. The observed line ratios fall consistently near the predictions for the high- , except in Figure 2a. In the latter case, the predicted [O II] 3727 strength is very weak, due to the low critical density of this line. A likely remedy to this problem is the inclusion of an additional low-density IB (low- IB) component that emits efficiently in this transition while minimally perturbing the other line ratios.
We modeled this third component as the low-density IB of Binette et al. (1996), except that it was irradiated by an ionizing continuum, the same power-law continuum discussed above, which has not been filtered through the MB clouds. To achieve the final combination of high- + low- IB, we assumed that our observation aperture is filled with high- nebulae and low- IB clouds. Relevant line ratios for each component, normalized by H, are listed in Table 3. The composite model represents a weighted sum of the three components, and a good overall match with the nucleus observations was obtained with relative H contributions from (high- MB): (high- IB): (low- IB) = 0.02 : 0.68 : 0.3 (note that the high- MB : high- IB ratio is already fixed by ). The composite predicted ratios and observed values are listed in the last two columns of Table 3.
While the 3-component simulation should not be taken too literally as a physical representation of the nebular structure in the M87 nucleus, the comparison presented here nonetheless provides an important demonstration that a multi-component photoionized plasma may account for the emission-line properties of this source. The choice of nebular parameters in this picture is not entirely arbitrary. Gas with densities ranging from cm-3 to cm-3 exists in the cores of AGNs, and more general arguments exist for the importance of composite cloud populations in these environments. In particular, Baldwin et al. (1995) and Ferguson et al. (1997) have discussed the phenomenon of locally optimally emitting clouds (LOCs), in which emission in a particular line emerges predominantly from the subset of clouds with appropriately favorable nebular conditions for that transition. In the spirit of the LOC models, we conclude that it appears likely that a combination of high-density nebulae emit most of the lines observed in the nucleus of M87, while lower density clouds lead to the emission from ions with low critical densities, such as [O II] 3727 and [S II] 6717, 6731. Analyses of other LINERs have similarly suggested that multiple cloud populations may be required to account for the observed emission-line properties (e.g., Péquignot 1984; Barth et al. 2001).
An interesting point which our high- calculations raise is whether the UV line-ratio diagrams are in fact robust in distinguishing between shock heating and photoionization, if density effects are taken into consideration. Figures 2 and 3 show that the line ratios from the ionized disk of M87 could be well described by the high- , except for [O II] 3727. We again attempted to construct a composite model with different combinations of the high- and low- IB components. We found that the same fractional contributions of the components used above (with H proportions 0.7 : 0.3) give reasonably satisfactory results, although low- lines such as [O II] and [S II] 6717, 6731 remain underpredicted by a factor of . We conclude that the extended disk of M87 remains a good candidate for shock ionization, but emphasize that the UV line diagnostics advocated by D97 and Allen et al. (1998) may encounter limitations when applied to composite nebular systems that include high-density components.
3.2 Energetics
A consistency test for photoionization interpretations of the nuclear nebula in M87 is whether the central source provides sufficient ionizing photons to power the line emission. To address this point, we employed recent measurements of the nuclear continuum as measured by XMM-Newton in 2000 (Böhringer et al. 2001). These data have the advantage of simultaneously sampling the UV and X-ray bandpasses; while the central source is known to be variable, we employ these measurements as a representative snapshot of the broad-band continuum. The narrow lines in this source are neither known nor expected to be variable. In the UV bandpass, the XMM-Newton data provide a flux density for the M87 nucleus of erg s-1 cm-2 Hz-1 at 2120 Å, and an integrated X-ray flux of erg s-1 cm-2 for 2 – 10 keV.
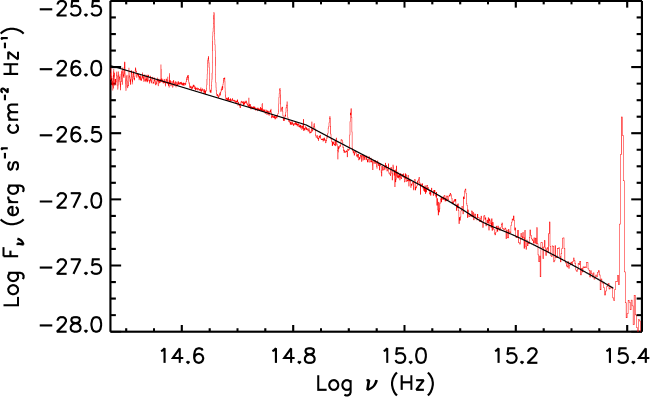
We can extrapolate the XMM-Newton UV flux by assuming that the spectral shape is the same as during our HST observation. We first attempted to derive an analytic fit to the continuum we measured for the nucleus, using SPECFIT as before. The continuum was represented by a broken power law subject to reddening, combined with a stellar component represented by the template described in §2. The fit indicates that the galaxy starlight contribution is negligible, and the continuum is well-represented by only a power law with a break at Å, subject to reddening given by mag. This amount of reddening is reasonably consistent with the value of mag predicted from the Galactic H I column density toward M87 [ cm-2; Sankrit et al. 1999] and a standard ratio (Bohlin, Savage, & Drake 1978). The spectral indices of the power law are and for the red and blue portions, respectively. The spectrum of the nucleus along with this fit are shown in Figure 4. A similar fit to the FOS spectra was reported by Tsvetanov et al. (1999b). Our 1999 STIS flux at 2120 Å is erg s-1 cm-2 Hz-1, a factor of 2.6 below that obtained in 2000 by XMM-Newton, which provides one indicator of the level of variability between these two measurements. Scaling our continuum observation to bring it into agreement with the XMM-Newton data, and removing reddening corresponding to mag, implies a flux density at 2500 Å of erg s-1 cm-2 Hz-1.
At higher energies, the continuum is constrained by the XMM-Newton X-ray measurements. Böhringer et al. (2001) reported that the keV spectrum was successfully described assuming Galactic absorption only, and a power law with best-fitting . Using the same spectral index with the keV flux noted above implies that the 2 keV flux density is erg s-1 cm-2 Hz-1. The two-point spectral index connecting 2500 Å and 2 keV is then . While this value is the same as that measured in X-rays, it is shallower than the measured UV index of , implying that the spectrum must show some spectral curvature across the ionizing ultraviolet region. If we approximate the continuum with a single power law with , normalized to match the dereddened 2500 Å flux, the hydrogen-ionizing photon flux at the Earth in the absence of absorption would be 0.12 photons s-1 cm-2. After correction for mag, the H photon flux in our STIS nucleus aperture is photons s-1 cm-2, implying a photon ratio . For comparison, Case B recombination at a temperature of K and density of cm-3 predicts (Hummer & Storey 1987). It thus seems likely that the central source provides enough ionizing photons to power the emission nebula within the central ″, if the covering factor for the nebular gas is % .
The nebular disk extends beyond the aperture employed here for the nucleus, however. The surface brightness distribution for the nebular disk has been studied by Ford et al. (1994), D97, and Tsvetanov et al. (1999a) using HST narrow-band imaging of H + [N II]. Within 1″ of the nucleus, the resulting integrated H + [N II] flux is erg cm-2 s-1 (Ford et al. 1994). If we integrate out from this radius the analytic fit provided by Tsvetanov et al. (1999a) for the surface brightness distribution, the total extrapolated H + [N II] flux for the disk is then erg s-1 cm-2. This flux exceeds our nuclear measurement by a factor of ; if we scale our H flux by a corresponding amount, the ratio , which still allows consistency with photoionization if the covering factor is at least %.
The calculation described above for the ionizing photon flux is uncertain in several ways. First, it requires an uncertain extrapolation across the unobservable ionizing UV bandpass that contains most of . In addition, the continuum source is variable. It is therefore uncertain whether our choice of flux level adopted for this calculation is close to an average value. The calculation above involves a further assumption that the continuum we measure is emitted isotropically at the source. If a portion of this continuum is in fact beamed in our direction, our estimate of the photon production available for photoionizing the nebula would be overestimated. Some amount of beaming would not be surprising in light of other similarities between the M87 nucleus and BL Lac objects (see Tsvetanov et al. 1998 for discussion). In any case, it appears likely that the energetics change from being driven primarily by the nuclear radiation field, to other processes at larger radii; on large scales (″), the total integrated line flux grows to erg s-1 cm-2, implying as above , which is likely to be problematic. Taken at face value, the models for photoionization of the nucleus (§3.1) and shock heating of the disk (D97) suggest that this transition occurs within only a few tens of parsecs from the center.
3.3 Absorption Lines
The absorption lines detected in our spectra provide another diagnostic of material that may be in close proximity to the AGN. The data with the best combination of (high) spectral resolution and signal-to-noise ratio, from STIS G140L and FOS G270H, can be used to estimate some of the properties of the absorbing matter. Absorption lines identified in these spectra and measurements of their equivalent widths (EWs) are presented in Table 4, where we have also included measurements of the Ca II K + H and Na I D lines from the FOS G400H and G570H spectra, respectively. The lines were measured using SPECFIT assuming Gaussian profiles. We show in Figure 5 close-up views of the spectra and fits around the absorption lines. Tsvetanov et al. (1999b) have reported the detection of absorption lines in the same FOS spectra that we are using.
The velocity of the absorption lines relative to that of the emission lines in M87 is of importance for determining the nature and physical state of the absorber. The measured wavelengths listed in Table 4 reflect the wavelength scale resulting from the pipeline reduction of the spectra, which may be subject to significant zero-point shifts. The average velocity of the absorption lines measured with the FOS G270H, not including lines blended with Galactic features, is km s-1; for the STIS G140L spectrum, the mean velocity is km s-1. These values are consistent within their uncertainties, and for each grating considered individually the velocities of the individual lines are likewise consistent with each other. We also fit emission lines in the same spectra. For FOS G270H, C II 2326 appears at Å, corresponding to a velocity of km s-1; for STIS G140L, C IV 1549 appears at Å and He II 1640 appears at Å, yielding velocities of km s-1 (assuming an optically thin C IV doublet ratio) and km s-1, respectively. These results indicate that the absorber and the emitter are at approximately the same redshift. The G140L measurement yields a wavelength for Ly of Å, corresponding to km s-1, which is significantly larger than the results for the other lines; however, this finding is consistent with expectations that the Ly emission may be modified significantly (30% – 40% flux reduction) due to absorption by Galactic H I, resulting in a redward shift of the transmitted line centroid (Sankrit et al. 1999).
We can improve estimates of absolute velocity from these spectra by associating the Galactic absorption features with H I 21 cm absorption measured toward M87. Results from Davis & Cummings (1975) indicate that radio absorption arising in the Milky Way along this sightline is spread over a 50 km s-1 range, with the major component at km s-1 with respect to the Local Standard of Rest; this velocity corresponds to a heliocentric value of km s-1. The average redshift of Galactic lines in the FOS G270H spectrum is nominally km s-1, implying that a correction of km s-1 should be added to velocities derived from this spectrum in order to obtain heliocentric values. The heliocentric velocity of the M87 absorber is then km s-1, based on the G270H measurement. This result means that the absorber is blueshifted by km s-1 with respect to M87, which is at km s-1 as determined from stellar absorption lines (van der Marel 1994). The data for C II in the G270H spectrum likewise implies that the emission-line plasma is also blueshifted with respect to the host galaxy, by km s-1.
We carried out a curve-of-growth analysis to calculate the column densities of the absorbing ions. We followed the procedure outlined in Spitzer (1978) using our observed equivalent widths. One major uncertainty in this derivation is the detailed shape of the absorption features, since the lines that we detect are not entirely resolved; some substructure within the lines is suggested from previous observations of the Na I D lines (Carter, Johnstone, & Fabian 1997). We consequently chose a Doppler parameter km s-1 for consistency with the intrinsic FWHM of the lines as measured in the FOS and STIS spectra. We used the oscillator strengths from Verner et al. (1994). The resulting values of the column densities are listed in Tables 4 and 5. Given the low spectral resolution and possibility of unresolved substructure in the lines, the resulting estimates should be treated as lower limits. This point is reinforced by the tendency for some ions to display lower calculated column densities for lines with larger oscillator strengths, consistent with the presence of saturated substructure within these lines.
The results for the individual ions can be used to place constraints on the total column density of the absorber. Each gives a lower limit to the corresponding , which in turn provides a lower limit to the total hydrogen column density , assuming solar abundances (Anders & Grevesse 1989). The inferred from the various ions, whose absorption lines are not contaminated by absorption from other absorption features, indicates that cm-2, except from the column densities of Ca II ( cm-2) and Mn II ( cm-2).
The total in the M87 absorber can be constrained by other means. Dwarakanath, van Gorkom, & Owen (1994) used H I 21 cm observations to place an upper limit on the absorbing H I column density of cm-2. (This value is sensitive to the spin temperature, assumed by these authors to be 100 K.) Since the absorption lines detected in the HST spectra arise only from very low ionization species (requiring ionization energies eV to produce), the hydrogen in the absorber is expected to be mostly neutral, and this value can thus be taken as a useful limit on the total . As noted in §3.2 for the nucleus, the reddening of the optical/UV continuum and the X-ray absorbing column as measured by XMM-Newton both appear to be dominated by the Galactic contribution, suggesting that the absorber associated with M87 has cm-2. Recent Chandra X-ray measurements reported by Di Matteo et al. (2002) indicate that any absorbing matter associated with the nucleus has cm-2. A consistent picture thus emerges in which the absorber has cm-2. The only potential disagreement arises from the lower limit of cm-2 obtained above from the Mn II absorption lines. The Mn II 2577 line is potentially contaminated by Galactic absorption in Fe II 2587, and Mn II 2594 suffers a similar problem with Galactic Mn II 2606, leaving the Mn II 2606 in M87 as the best option for measuring this ion; the measurement uncertainty for this feature is relatively large, however (1 error of 26% ; see also Fig. 5), suggesting that it does not represent a significant inconsistency.
A fundamental question concerning the absorber in M87 is its relation, if any, to the accretion-powered activity in the nucleus. LINERs commonly exhibit resonance-line absorption tracing modest column densities, and these absorbers characteristically display a low-ionization state that mirrors the low ionization of the emission plasma in these sources (Shields et al. 2002, and references therein). These absorbers are not particularly exotic in their properties, and a natural question is whether they have any connection to the active nucleus, or simply represent normal components of the interstellar medium of the host galaxy that happen to fall along our line of sight to the central UV source. The latter possibility is underscored by the similarity in detected ions and equivalent widths for the Galactic and M87 absorbers (Tables 4 and 5).
While the nature of absorbers in LINERs in general remains ambiguous, in the case of M87 there are indications that the absorbing material is, in fact, associated with the central accretion phenomenon. The offset in velocity between the absorber and the underlying galaxy, indicative of outflow of the absorbing matter, is highly reminiscent of absorption commonly associated with more luminous AGNs, which is often blueshifted with typical velocities of a few km s-1 (e.g, Crenshaw et al. 1999). In addition, Sankrit et al. (1999) concluded that the substantial strength of the Ly emission feature requires that the absorber cover the continuum source, but little if any of the emission-line clouds, if cm-2, as seems to be the case. The most straightforward way of interpreting this finding geometrically is that the absorber has a distance from the central source and a size that are smaller than the typical dimensions of the emission clouds. Since the HST aperture employed by Sankrit et al. had a diameter of pc, the size and scale of the absorber are probably much smaller than this dimension, which would be consistent with an origin in the central accretion structure or its environs.
The absorption characteristics of M87 and possibly other LINERs may lead to important insights into the accretion process in these objects. The low ionization describing both absorption and emission sets these sources apart from Seyfert nuclei and QSOs, and likely arises from a characteristically different mode of accretion at low accretion rates. In particular, physical scenarios employing advection-dominated accretion flows (ADAFs), adiabatic inflow-outflow solutions (ADIOS), or other low radiative efficiency accretion structures are showing promise for interpreting these sources (see Quataert 2001 for a recent review). Substantial outflows of hot gas are predicted in some versions of these models (e.g., Blandford & Begelman 1999; Beckert 2000), and potentially some cooler material is accelerated in these winds, giving rise to the observed absorption. One quantity of interest for comparison with theoretical predictions is the rate of mass ejection represented by the M87 absorber. From simple geometrical considerations, , where is the mean atomic mass per H atom, is the proton mass, is the global covering factor, is the radial location of the absorber, and is the outflow velocity. Assuming solar abundances (; Däppen 2000), this can be expressed as
This result indicates that is much less than the Bondi accretion rate for the central object, which is M⊙ yr-1 (Di Matteo et al. 2002), but consistent with the idea that the absorbed gas may be material entrained in an outflow from the central accretion structure. Observations with higher spectral resolution will be necessary to establish the detailed kinematic and spatial structure of the absorbing gas in M87 and other LINERs.
4 Conclusions
The present study of UV/optical emission and absorption in the nearby LINER M87 provides several new insights into the nature of this source. Within a radius of pc, emission-line ratios for the nucleus are well-described by photoionization of a multi-phase medium with a range of densities; shock models are less successful. The data also show a low-ionization absorber that evidently resides on small scales and is outflowing. These attributes, along with the famous radio jet, strongly resemble those of more luminous AGNs, and clearly point to accretion as the underlying power source responsible for the LINER behavior.
M87 is, however, a good case for a composite system in terms of the ionization process generating the optical LINER. The emission-line characteristics of the resolved nebula change significantly away from the center; the emission-line ratios (D97) as well as energetics arguments suggest that mechanical heating becomes important for this gas on scales of tens of parsecs. If this pattern is typical, larger apertures common in ground-based measurements will sample emission plasma that may trace a complex mix of energetic processes. Efforts to identify a single, or even dominant, ionization mechanism in these systems may thus be unproductive, although the question of whether alternatives to accretion power are important provides a good reason to conduct detailed investigations of other LINER galaxies that lack broad lines or other clear signatures of accretion.
References
- (1)
- (2) Allen, M. G., Dopita, M. A., & Tsvetanov, Z. I. 1998, ApJ, 493, 571
- (3)
- (4) Anders, E., & Grevesse, N. 1989, Geochim. Cosmochim. Acta, 53, 197
- (5)
- (6) Baldwin, J., Ferland, G., Korista, K., & Verner, D. 1995, ApJ, 455, L119
- (7)
- (8) Barth, A. J., Ho, L. C., Filippenko, A. V., Rix, H.-W., & Sargent, W. L. W. 2001, ApJ, 546, 205
- (9)
- (10) Barth, A. J., Reichert, G. A., Filippenko, A. V., Ho, L. C., Shields, J. C., Mushotzky, R. F., & Puchnarewicz, E. M. 1996, AJ, 112, 1829
- (11)
- (12) Barth, A. J., Reichert, G. A., Ho, L. C., Shields, J. C., Filippenko, A. V., & Puchnarewicz, E. M. 1997, AJ, 114, 2313
- (13)
- (14) Beckert, T. 2000, ApJ, 539, 223
- (15)
- (16) Bicknell, G. F., & Begelman, M. C. 1996, ApJ, 467, 597
- (17)
- (18) Binette, L., Wilson, A. S., & Storchi-Bergmann, T. 1996, A&A, 312, 365
- (19)
- (20) Blandford, R. D., & Begelman, M. C. 1999, MNRAS, 303, L1
- (21)
- (22) Bohlin, R. C., Savage, B. D., & Drake, J. F. 1978, ApJ, 224, 132
- (23)
- (24) Boksenberg, A., et al. 1992, A&A, 261, 393
- (25)
- (26) Cardelli, J. A., Clayton, G. C., & Mathis, J. S. 1989, ApJ, 345, 245
- (27)
- (28) Carter, D., Johnstone, R. M., & Fabian, A. C. 1997, MNRAS, 285, L20
- (29)
- (30) Crenshaw, D. M., Kraemer, S. B., Boggess, A., Maran, S. P., Mushotzky, R. F., & Wu, C.-C. 1999, ApJ, 516, 750
- (31)
- (32) Däppen, W. 2000, in Allen’s Astrophysical Quantities, 4th ed., ed. A. N. Cox (New York: Springer), 29
- (33)
- (34) Davies, R. D., & Cummings, E. R. 1975, MNRAS, 170, 95
- (35)
- (36) Di Matteo, T., Allen, S. W., Fabian, A. C., Wilson, A. S., & Young, A. J. 2002, ApJ, in press (astro-ph/0202238v3)
- (37)
- (38) Dopita, M. A., & Sutherland, R. S. 1995, ApJS, 102, 161
- (39)
- (40) Dopita, M. A., et al. 1997, ApJ, 490, 202 (D97)
- (41)
- (42) Dwarakanath, K. S., van Gorkom, J. H., & Owen, F. N. 1994, ApJ, 432, 469
- (43)
- (44) Ferguson, J. W., Korista, K. T., Baldwin, J. A., & Ferland, G. J. 1997, ApJ, 487, 122
- (45)
- (46) Ferland, G. J., Korista, K. T., Verner, D. A., Ferguson, J. W., Kingdon, J. B., & Verner, E. M. 1998, PASP, 749, 761
- (47)
- (48) Filippenko, A. V. 1985, ApJ, 289, 475
- (49)
- (50) Filippenko, A. V. 1996, in ASP Conf. Ser. 103, The Physics of LINERs, ed. M. Eracleous et al. (San Francisco: ASP), 17
- (51)
- (52) Filippenko, A. V., & Halpern, J. P. 1984, ApJ, 285, 458
- (53)
- (54) Ford, H. C., et al. 1994, ApJ, 435, 27
- (55)
- (56) Harms, R. J., et al. 1994, ApJ, 435, 35
- (57)
- (58) Heckman, T. M. 1980, A&A, 87, 152
- (59)
- (60) Ho, L. C., Filippenko, A. V., & Sargent, W. L. W. 1997, ApJ, 487, 568
- (61)
- (62) Hummer, D. G., & Storey, P. J. 1987, MNRAS, 224, 801
- (63)
- (64) Kriss, G. 1994, in ASP Conf. Ser. 61, Astronomical Data Analysis Software and Systems III, ed. D. R. Crabtree, R. J. Hanisch, & J. Barnes (San Francisco: ASP), 437
- (65)
- (66) Laor, A. 1998, ApJ, 496, L71
- (67)
- (68) Macchetto, F., Marconi, A., Axon, D. J., Capetti, A., Sparks, W., & Crane, P. 1997, ApJ, 489, 579
- (69)
- (70) Maoz, D., Koratkar, A., Shields, J. C., Ho, L. C., Filippenko, A. V., & Sternberg, A. 1998, AJ, 116, 55
- (71)
- (72) Nicholson, K. L., Reichert, G. A., Mason, K. O., Puchnarewicz, E. M., Ho, L. C., Shields, J. C., & Filippenko, A. V. 1998, MNRAS, 300, 893
- (73)
- (74) Osterbrock, D. E. 1989, Astrophysics of Gaseous Nebulae and Active Galactic Nuclei (Mill Valley, CA: University Science Books)
- (75)
- (76) Pelat, D., Alloin, D., & Fosbury, R. A. E. 1981, MNRAS, 195, 787
- (77)
- (78) Péquignot, D. 1984, A&A, 131, 159
- (79)
- (80) Quataert, E. 2001, in ASP Conf. Ser. 224, Probing the Physics of Active Galaxies by Multiwavelength Monitoring, ed. B. M. Peterson, R. S. Polidan, & R. W. Pogge (San Francisco: ASP), 71
- (81)
- (82) Reynolds, C. S., Di Matteo, T., Fabian, A. C., Hwang, U., & Canizares, C. R. 1996, MNRAS, L111
- (83)
- (84) Sankrit, R., Sembach, K. R., & Canizares, C. R. 1999, ApJ, 527, 733
- (85)
- (86) Schlegel, D. J., Finkbeiner, D. P., & Davis, M. 1998, ApJ, 500, 525
- (87)
- (88) Shields, J. C., Sabra, B. M., Ho, L. C., Barth, A. J., & Filippenko, A. V. 2002, in ASP Conf. Ser. 255, Mass Outflow in Active Galactic Nuclei: New Perspectives, ed. D. M. Crenshaw, S. B. Kraemer, & I. M. George (San Francisco: ASP), 105
- (89)
- (90) Spitzer, L., Jr. 1978, Physical Processes in the Interstellar Medium (New York: Wiley)
- (91)
- (92) Tonry, J. L., Dressler, A., Blakeslee, J. P., Ajhar, E. A., Fletcher, A. B., Luppino, G. A., Metzger, M. R. & Moore, C. B. 2001, ApJ, 546, 681
- (93)
- (94) Tsvetanov, Z. I., Allen, M. G., Ford, H. C., & Harms, R. J. 1999a, in the Radio Galaxy Messier 87, ed. H.-J. Röser & K. Meisenheimer (Berlin: Springer), 301
- (95)
- (96) Tsvetanov, Z. I., Hartig, G. E., Ford, H. C., Dopita, M. A., Kriss, G. A., Pei, Y. C., Dressel, L. L., & Harms, R. J. 1998, ApJ, 493, L83
- (97)
- (98) Tsvetanov, Z. I., Hartig, G. E., Ford, H. C., Kriss, G. A., Dopita, M. A., Dressel, L. L., & Harms, R. J. 1999b, in the Radio Galaxy Messier 87, ed. H.-J. Röser & K. Meisenheimer (Berlin: Springer), 307
- (99)
- (100) van der Marel, R. P. 1994, MNRAS, 270, 271
- (101)
- (102) Verner, D. A., Barthel, P. D., & Tytler, D. 1994, ApJS, 108, 287
- (103)
- (104) Whysong, D., & Antonucci, R. 2002, astro-ph/0207385v1
- (105)


| STIS | Spectral Resolution1 | ||||
|---|---|---|---|---|---|
| Grating | Detector | Coverage (Å) | Point Source | Extended | Exp. (seconds) |
| G140L | FUV-MAMA | 1150-1720 | 190 | 2500 | 2590 |
| G230L | NUV-MAMA | 1590-3160 | 600 | 4000 | 2296 |
| G430L | CCD | 2900-5710 | 380 | 1900 | 900 |
| G750L | CCD | 5270-10270 | 390 | 1900 | 1000 |
| FOS | |||||
| Grating | Detector | Coverage (Å) | Point Source | Extended | Exp. (seconds) |
| G160L | FOS/BL | 1140-2510 | 1300 | 1300 | 2300 |
| G270H | FOS/RD | 2220-3275 | 230 | 230 | 2300 |
| G400H | FOS/RD | 3235-4780 | 230 | 230 | 2300 |
| G570H | FOS/RD | 4560-6820 | 230 | 230 | 2300 |
1 FWHM resolution in km s-1.
| Emission Line | STIS Flux1 | FOS Flux2 |
|---|---|---|
| Ly | 14.070.59 | 30.862.96 |
| C IV 1549 | 0.600.06 | 0.990.28 |
| He II 1640 | 0.400.06 | 0.510.27 |
| C III] 1909 | 1.030.13 | 0.920.27 |
| C II] 2326 | 1.050.08 | 1.260.17 |
| Mg II 2796, 2804 | 1.120.09 | 1.240.17 |
| O II 3727 | 2.470.11 | 2.450.18 |
| Ne III 3869 | 0.360.04 | 0.790.09 |
| S II 40723 | 1.520.08 | 2.220.19 |
| H | 0.490.04 | 0.520.08 |
| H | 1.000.05 | 1.000.10 |
| O III 4959 | 0.610.03 | 0.760.06 |
| O III 5007 | 1.840.08 | 2.290.18 |
| O I 6300 | 1.620.08 | 2.280.195 |
| O I 6364 | 0.530.03 | …………. |
| HN II 6548,83 | 12.330.49 | 13.290.95 |
| S II 6717,6731 | 3.100.13 | 2.320.21 |
| Ar III 71656 | 0.100.04 | …………. |
| O II 7325 | 0.870.08 | …………. |
1 Normalized to
H erg s-1 cm-2, uncorrected for reddening.
2 Normalized to
H erg s-1 cm-2, uncorrected for reddening.
3 Blended with H.
4 Blended with [O III] 4363.
5 Includes [O I] 6364.
6 Uncertain.
| Line | high- MB | high- IB | low- IB | Total2 | Observed3 | |
|---|---|---|---|---|---|---|
| C IV 1549 | 26.76 | 0.05 | 0.76 | 0.00 | 0.53 | 0.60 |
| He II 1640 | 7.70 | 0.08 | 0.28 | 0.70 | 0.41 | 0.40 |
| C III] 1909 | 1.88 | 1.26 | 1.28 | 0.10 | 0.93 | 1.03 |
| C II] 2326 | 0.00 | 1.11 | 1.08 | 0.66 | 0.95 | 1.05 |
| O II 3727 | 0.00 | 0.05 | 0.05 | 6.48 | 1.98 | 2.47 |
| Ne III 3869 | 0.41 | 1.82 | 1.78 | 0.96 | 1.53 | 0.36 |
| O III 5007 | 3.11 | 1.91 | 1.95 | 0.32 | 1.46 | 1.84 |
| O I 6300 | 0.00 | 2.33 | 2.27 | 1.47 | 2.03 | 1.62 |
| H + N II | 0.00 | 3.80 | 3.78 | 9.81 | 5.59 | 12.33 |
| S II 6717,6731 | 0.00 | 0.26 | 0.25 | 6.91 | 2.25 | 2.32 |
1 All fluxes expressed relative to H.
2 Fluxes predicted for the composite, 3-component photoionization model.
3 STIS measurements, uncorrected for reddening.
| Line ID | (Å) | EW(Å) | log(N cm-2) | Origin |
|---|---|---|---|---|
| Si I 12551 | 1259.310.16 | 0.750.10 | 14.35 | M87 |
| Si II 12602 | 1264.490.33 | 0.400.03 | 12.42 | M87 |
| S I 12703 | 1271.400.29 | 0.330.12 | 15.86 | Gal.(?) |
| S I 14013 | 1399.440.16 | 0.790.10 | 15.59 | Gal. |
| Ni II 14133 | 1417.960.38 | 0.380.10 | 15.55 | M87 |
| S I 14253 | 1424.640.36 | 0.470.14 | 14.38 | Gal. |
| ……… | 1432.490.15 | 0.390.09 | ….. | Unknown |
| ……… | 1435.130.41 | 0.550.15 | ….. | Unknown |
| ……… | 1446.640.65 | 0.590.16 | ….. | Unknown |
| Ni II 14504 | 1455.690.36 | 0.500.16 | 15.93 | M87 |
| Ni II 14685 | 1468.550.79 | 0.730.18 | 16.30 | Gal.(?) |
| Si II 1527 | 1531.620.26 | 0.700.19 | 14.47 | M87 |
1 Contributions from Galactic S I 1259.52 and
Fe II 1260.53.
2 Contributions from M87 S I 1259.52 and
Fe II 1260.53.
3 Multiple components.
4 Contributions from M87 Co II 1448.01 and Galactic
Ni II 1454.84.
5 Contributions from Galactic Co II 1466.20 and
Ni II 1467.26.
| Line ID | (Å) | EW(Å) | log(N cm-2) | Origin |
|---|---|---|---|---|
| Fe II 2344 | 2343.230.15 | 0.630.11 | 14.11 | Gal. |
| Fe II 2344 | 2352.870.39 | 0.590.16 | 14.08 | M87 |
| Fe II 2374 | 2373.860.28 | 0.800.24 | 14.80 | Gal. |
| Fe II 2383 | 2382.220.22 | 1.130.15 | 13.94 | Gal.1 |
| Fe II 2383 | 2391.090.22 | 1.330.15 | 13.04 | M87 |
| Mn II 2577 | 2586.210.52 | 0.700.48 | 13.57 | M87 |
| Fe II 2587 | 2586.110.39 | 0.390.35 | 14.03 | Gal. |
| Fe II 2587 | 2595.620.36 | 1.210.21 | 14.59 | M872 |
| Fe II 2600 | 2599.740.24 | 0.730.17 | 13.78 | Gal. |
| Fe II 2600 | 2609.700.26 | 1.660.16 | 14.20 | M87 |
| Mn II 2606 | 2606.030.57 | 0.870.21 | 13.92 | Gal. |
| Mn II 2606 | 2617.190.78 | 0.720.19 | 13.83 | M87 |
| Mg II 2796 | 2795.910.10 | 1.280.12 | 13.58 | Gal.3 |
| Mg II 2796 | 2803.080.11 | 1.590.40 | 13.70 | M874 |
| Mg II 2803 | 2813.610.24 | 1.910.55 | 14.05 | M87 |
| Mg I 2853 | 2863.190.35 | 1.270.18 | 12.08 | M87 |
| Ca II 3935 | 3949.400.26 | 2.100.20 | 13.45 | M87 |
| Ca II 3970 | 3984.290.32 | 1.830.12 | 13.80 | M87 |
| Na I 5891 | 5909.442.15 | 0.610.69 | 12.48 | M87 |
| Na I 5897 | 5915.011.07 | 2.960.72 | 12.53 | M87 |
1 Contaminated by M87 Fe II 2376.
2 Contaminated by Galactic Mn II 2594.
3 Contaminated by Galactic Mn I 2795.
4 Contaminated by Galactic Mg II 2803 and M87
Mn I 2795.