The Mass to Light ratio and the Initial Mass Function in galactic discs
Abstract
A low mass–to–light ratio for the baryonic component of spiral galaxies is advocated by a number of dynamical studies and by cosmological simulations of galaxy formation. We discuss the possibility of obtaining low mass–to–light ratios for the stellar component in discs, by changing the Initial Mass Function and the Star Formation History.
guessConjecture {article} {opening}
1 Introduction
Recent N–body+SPH cosmological simulations of the formation of disc galaxies reproduce the observed Tully-Fisher (TF) relation, provided the mass–to–light (M/L) ratio of the stellar component is low, M/L0.8 in the I–band (Sommer-Larsen & Dolgov 2001, Sommer-Larsen et al. 2002). Various arguments support in fact this possibility.
A straightforward estimate of the stellar mass of the Milky Way yields M; to lie on the observed TF relation as other spirals, its M/LI must be 0.8 (Sommer-Larsen & Dolgov 2001).
Bar instability arguments put upper limits on the M/L ratio of discs, M/L, i.e. M/L for (Syer et al. 1997).
Even in case of maximal stellar discs, lower M/L ratios for the stellar component are required, than those predicted by the Salpeter IMF (Bell & de Jong 2001). And it is still much debated whether discs are maximal or sub–maximal; for his favoured sub–maximal disc model, Bottema (2002) finds M/L.
Finally, two recent dynamical studies of individual spiral galaxies yield M/L1 in the B, V and I band for the Sc galaxy NGC 4414 (Vallejo et al. 2002) and M/LI=1.1 for the disc of the Sab spiral 2237+0305, Huchra’s lens (Trott & Webster 2002).
2 Initial Mass Function and Star Formation History
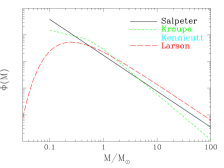
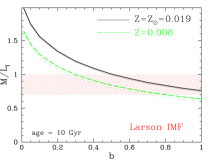
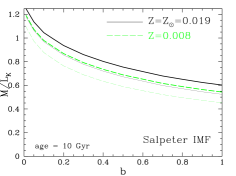
A standard Salpeter IMF, extended over the mass range [0.1–100] , certainly yields much higher M/L ratios than those mentioned above (Fig. 2, top left). There is however plenty of observational evidence that the IMF flattens below , possibly with a turn–over at low masses, and hence is “bottom–light” with respect to the Salpeter IMF.
Here we consider the following IMFs (Fig. 1, left panel): the Salpeter IMF; the Kroupa (1998) IMF, derived from field stars in the Solar Neighbourhood; the Kennicutt IMF, derived from the global properties of spiral galaxies (Kennicutt et al. 1994); the Larson (1998) IMF, with an exponential cut–off at low masses as favoured by recent determinations of the local IMF down to the sub–dwarf regime (Chabrier 2001, 2002).

Besides the IMF, the M/L ratio of a galaxy depends on its star formation history (SFH), that is related to Hubble type: Kennicutt et al. (1994) demonstrated that the sequence of spiral types is a sequence of different SFHs in the discs, as traced by the birthrate parameter
or the ratio between the present and the past average star formation rate (SFR); see also Fig. 1, right panel.
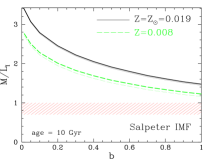
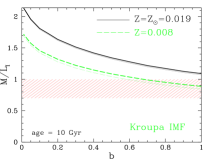
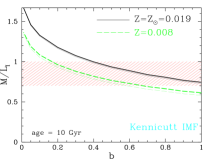
The reference TF relation by Giovanelli et al. (1997), suggesting the low M/L ratios quoted in the introduction, is typical for Sbc–Sc spirals. Kennicutt et al. find that Sbc–Sc discs correspond to .
3 Results from simple models
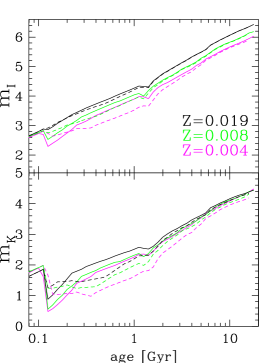
We will discuss in particular the M/L ratio in the I–band, which is an excellent optical mass tracer because the I–band luminosity is less sensitive to recent sporadic star formation and to corrections for dust extinction than bluer bands. Besides, the M/L ratio of Single Stellar Populations (SSPs) in the I–band is less metallicity dependent than in other bands, and it is less sensitive to the specific treatment of the AGB phase than redder, NIR bands (§ 3.1).
We computed SSPs based on the latest Padua isochrones (Girardi et al. 2002), for the different IMFs in § 2. These are to be convolved with suitable SFHs. A variety of SFHs characterized by different values of the –parameter can be simply computed adopting an exponentially decaying with different decaying rates. Metallicities within a factor of 2 solar can be considered typical for spiral galaxies. The resulting M/L ratio of the global stellar population (including remnants) as a function of the –parameter is displayed in Fig. 2, for the different IMFs. The range is representative of Sbc–Sc spirals. The shaded area indicates the range in M/L=0.7–1 suggested in § 1.
Fig. 2 shows that bottom–light IMFs can in fact yield M/L for late–type spirals, but one probably needs somewhat “lighter” IMFs than the local (Kroupa) one. Full self–consistent chemo–photometric disc models are being developed to improve the analysis and to assess whether these IMFs are also compatible with the observed chemical properties of spirals (Portinari et al. 2002).
3.1 Effects of the AGB modelling
We also calculated an alternative set of SSPs based on the isochrones by Marigo & Girardi (2001), which incorporate a more detailed modelling of the Asymptotic Giant Branch (AGB) phase, with important effects on the integrated luminosity in the NIR bands (Fig. 3).
In Fig. 2, thin lines correspond to the alternative SSP set. The effect on the predicted M/L ratios is minor in the I–band, so that results of photometric models are rather solid. In NIR bands like the K–band, instead, the different accuracy in AGB modelling can imply 20% higher luminosities (Fig. 3, right panel), rendering NIR luminosities a less straightforward tracer of stellar mass.
References
- [1]
- [2] Bell E.F., de Jong R.S., 2001, ApJ 550, 212
- [3] Bottema R., 2002,A&A 388, 809
- [4] Chabrier G., 2001, ApJ 554, 1274
- [5] Chabrier G., 2002, ApJ 567, 304
- [6] Giovanelli R., Haynes M.P., Herter T., Vogt N.P., 1997, ApJ 477, L1
- [7] Girardi L., et al., 2002, A&A 391, 195
- [8] Kennicutt R.C., Tamblyn P., Congdon C.W., 1994, ApJ 435, 22 (KTC94)
- [9] Kroupa P., 1998, MNRAS 298, 231
- [10] Larson R.B., 1998, MNRAS 301, 569
- [11] Marigo P., Girardi L., 2001, A&A 377, 132
- [12] Portinari L., Sommer–Larsen J., Tantalo R., 2002, in preparation
- [13] Sommer–Larsen J., Dolgov A., 2001, ApJ 551, 608
- [14] Sommer–Larsen J., Götz M., Portinari L., 2002, ApJ submitted (astro-ph/0204366)
- [15] Syer D., Mao S., Mo H.J., 1997, astro-ph/9711160
- [16] Trott C.M., Webster R.L., 2002, MNRAS 334, 621
- [17] Vallejo O., Braine J., Baudry A., 2002, A&A 387, 429