4C +12.50: A Superluminal Precessing Jet in the Recent
Merger System IRAS 13451+1232
Abstract
We present the results of a multi-epoch VLBA study of the powerful radio source 4C +12.50 (PKS 1345+125) at a wavelength of 2 cm. This compact radio source is associated with a hidden quasar whose host galaxy shows signs of a recent merger. It has been classified as a compact symmetric source (CSO) due to its small overall size ( pc) and twin-jet morphology, although it also has faint extended emission that may be a relic of previous activity. We report the detection of exceedingly high linear fractional polarization in isolated features of the southern jet (up to 60 %), which is highly unusual for a CSO. Given the large amount of gas present in the host galaxy, we would expect significant Faraday depolarization across the whole source, unless the depolarizing gas is fairly clumpy. The southern jet also contains two features that are moving outward from the core at apparent speeds of and . These represent the first positive detections of superluminal motion in a CSO, and taken together with the jet to counter-jet flux ratio, suggest an intrinsic flow speed of . The apparent ridgeline of the jet and counter-jet are consistent with a conical helix of wavelength 280 pc that is the result of Kelvin-Helmholtz instabilities driven by a slow precession of the jet nozzle. A fit to the data implies that the nozzle is precessing around a cone with half-angle , whose axis lies at an angle of to the line of sight. We suggest that the “S”-shaped jet morphologies commonly seen in recent AGN outflows such as 4C +12.50 may simply reflect the fact that their black hole spin axes are still precessing, and have not had sufficient time to align with their accretion disks.
1 Introduction
A significant fraction of all active galactic nuclei found in high frequency radio surveys is made up of gigahertz peaked-spectrum (GPS) and compact steep-spectrum (CSS) sources. These AGN have convex radio spectra that peak at rest-frame frequencies of up to 50 GHz (Edge et al., 1996). There is a well known correlation between peak frequency () and overall source size in the radio (; O’Dea 1998) that is likely an evolutionary effect associated with either free-free (Bicknell, Dopita, & O’Dea, 1997) or synchrotron self-absorption (O’Dea & Baum, 1997). The historical division between GPS and CSS classifications has been somewhat arbitrary, with the latter having observed peak frequencies that usually lie below MHz, and are therefore difficult to measure. As a consequence of the –size correlation, CSS typically have sizes larger than 1 kpc, which is sometimes used as a canonical value for dividing CSS and GPS objects.
There has been much recent work involving a particular sub-class of GPS sources that show two-sided radio jets on parsec scales. Their radio morphology is dominated by two “mini-lobes” which are typically separating at (Polatidis, Conway, & Owsianik, 2002). The core components are usually weak or not detected in VLBI images (with some exceptions; see, e.g., Augusto, Wilkinson, & Browne 1998). Their subluminal expansion speeds, relatively stable flux densities, and two-sided morphologies suggest that their jets lie close to the plane of the sky, and that their high apparent luminosities () are not the result of relativistic beaming. Although these AGN are usually referred to as “compact symmetric objects” (CSOs), their parsec-scale jets are rarely symmetric, and in some cases are associated with much larger radio sources that extend out to many kiloparsecs (Stanghellini et al., 1990, 1998). In such sources (e.g., 0108+388; Baum et al. 1990), it has been speculated that the CSO represents a renewed period of activity in the life cycle of the AGN, since the kinematic age of the CSO ( years; Owsianik, Conway, & Polatidis 1999) is much smaller than that inferred for the large-scale structure.
If CSOs are indeed radio sources that have only recently become (re)active, it should still be possible to find traces of the triggering events in their host galaxies. The current paradigm for relativistic jet formation in AGN is that a merger disturbs the gas in the inner regions of the host galaxy, sending it toward the central black hole. An accretion disk forms and then provides the fuel for a relativistic outflow. Although this scheme is now widely accepted, there are relatively few nearby AGN in which the predictions can be examined in detail. One such system is the ultra-luminous infrared galaxy (ULIG) IRAS 13451+1232, which contains a double nucleus and appears to have undergone a recent merger. What makes this AGN particularly useful for investigating both the merger and CSO “youth” scenarios is that it harbors the powerful radio source 4C +12.50, which is one of the closest known GPS/CSS sources. Although 4C +12.50 has a CSO-type morphology on parsec-scales, it also has weak, extended radio emission which is possibly a relic of previous nuclear activity.
Here we present multi-epoch VLBA111The Very Long Baseline Array (VLBA) is a facility of the National Radio Astronomy Observatory, operated by Associated Universities Inc., under cooperative agreement with the National Science Foundation. observations of 4C +12.50 which reveal for the first time both the existence of superluminal motion and high linear polarization in the jets of a CSO. We find evidence that suggests that the jet nozzle of 4C +12.50 is slowly precessing with time. We discuss whether the twisted, symmetric jet morphologies seen in some CSOs may simply reflect the fact that their black hole spin axes are still precessing, and have not had sufficient time to reach a stable orientation.
In § 2 we describe our observations and data reduction. We discuss the overall host galaxy and radio properties of 4C +12.50 in §§3.1 and 3.2, respectively. In § 4 we examine the proper motions in the jet, and discuss the constraints on the viewing angle and flow speed in § 4.1. In § 5 we develop a helical precession model that accounts for the dramatic jet curvature in the source, and consider the evidence for 4C +12.50 being a young radio source in § 6. We summarize our findings in § 7.
In this paper we assume a standard cosmology with , , and . The redshift of IRAS 13451+1232 () implies a luminosity distance of 570 Mpc, and an angular size of 1 mas on the sky corresponds to 2.20 pc.
2 Observations and data reduction
In order to study the jet kinematics of 4C +12.50, we have used five individual epochs of 2 cm VLBA data from three separate observing programs that spanned the time range 1996 to 2001. The first epoch consists of archival VLBA data observed by Stanghellini et al. (2001). The next three epochs are from the VLBA 2 cm survey (Kellermann et al., 1998; Zensus et al., 2002), and the final epoch is from a full-track observation carried out specifically for this study. The first and last epochs were recorded in dual circular polarization, and included a single VLA antenna in addition to the ten antennas of the VLBA (see Table 1).
The data from the individual epochs were all correlated with the VLBA correlator in Socorro, NM and were processed in identical fashion using AIPS and Difmap. We applied a-priori amplitude corrections using antenna gains and system temperatures measured during the run, but did not perform any atmospheric opacity corrections, as the antenna gains were adequately calibrated in subsequent self-calibration and imaging iterations in Difmap.
We determined the antenna polarization leakage factors for the final epoch by running the AIPS task LPCAL on the calibrator sources OQ 208 (1404+286) and PKS 1413+135. These sources were observed at regular intervals during the run in order to obtain a large range of parallactic angles. The leakage factors ranged up to , with typical values of . By comparing the results obtained from both calibrators, we estimate that our leakage factor solutions are accurate to within . Our re-analysis of the first epoch data observed by Stanghellini et al. (2001) using the sources OQ 208, 0738+313, 0742+103, and 0743–006 gave similar results.
We established the absolute electric vector position angle (EVPA) on the sky for the last epoch using five scans of the calibrator 3C 279 separated in hour angle throughout the observing run. The integrated EVPA of 3C 279 was measured at 1.3, 3.6, and 6 cm on 2000 Dec 28 with the VLA as part of the VLA/VLBA Polarization Monitoring Program (Taylor & Myers, 2000). By fitting a rotation measure of 54.7 to these data, we interpolated an EVPA of 51.6 at 2 cm for this epoch. We then rotated the VLBA EVPAs so that in they were in agreement with this value. Based on previous applications of this technique (e.g., Lister & Smith 2000; Lister 2001), we estimate that our EVPAs are accurate to within .
We calibrated the EVPAs of the first epoch by comparing single-dish measurements of the compact sources 0552+398 and 2134+004 made at the University of Michigan Observatory (UMRAO) to our integrated VLBA EVPAs. A rotation of degrees was needed to bring the VLBA EVPAs into agreement with the Michigan data. A comparison of our 1996 and 2001 images shows no changes in polarization structure between these epochs, with EVPAs differing by less than 2 degrees.
3 Discussion
In this section we discuss previous observations of 4C +12.50, as well as those of its host galaxy IRAS 13451+1232. We describe the results of our VLBA observations in § 3.2.2.
3.1 Host galaxy properties
IRAS 13451+1232 has been imaged extensively by space- and ground-based observatories in the optical and infrared (e.g., Scoville et al. 2000). Early optical images by Gilmore & Shaw (1986) revealed two nuclei separated by 1.6 arcsec (3.5 kpc), and a V-band image by Heckman et al. (1986) showed irregular isophotes, several nearby small companion galaxies, and a strongly curved tidal tail. The disturbed features of this system and the relatively large nuclear separation are indicative of a recent merger event involving at least one spiral, gas-rich galaxy (Gilmore & Shaw, 1986). The east nucleus is optically dull and appears as reddened starlight. The northwest nucleus, which is coincident with the radio source (Axon et al., 2000), has a Seyfert 2 optical spectrum and is highly polarized in the ultraviolet (; Hurt et al. 1999). It is highly reddened (; Surace & Sanders 2000) with an estimated of 3.5 (Kim, 1995), and has broad Pa() emission in the infrared (Veilleux, Sanders, & Kim, 1997). These observations suggest the presence of a quasar buried behind a foreground dust screen, which is further supported by the detection of hard X-rays from this source by ASCA (Imanishi & Ueno 1999; O’Dea et al. 2000).
The likely source of fuel for the quasar is a vast quantity of molecular gas that appears to be left over from the merger. The northwest nucleus marks the peak of strong compact CO () emission at 2.7 mm, which Evans et al. (1999) found to be concentrated to within the inner 2 kpc of the galaxy. In addition to the CO emission, Mirabel et al. (1989) detected HI absorption in front of 4C +12.50. The HI and CO profiles span the same velocity range and are likely spatially coincident. Mirabel et al. (1989) derive a molecular gas mass of , which is among the highest ever measured for an ULIG.
3.2 Radio properties of 4C +12.50
4C +12.50 is a relatively powerful radio source, with . It has a curved radio spectrum with a spectral index of approximately at frequencies between 0.4 and 30 GHz. There is a sharp cutoff at low frequency ( MHz) characteristic of free-free or synchrotron self absorption. Its radio flux density is relatively stable at 318 and 430 MHz; Salgado et al. (1999) report only very weak () variations over a 14 year time interval. Long term 8 GHz monitoring at UMRAO222http://www.astro.lsa.umich.edu/obs/radiotel/umrao.html showed a slow rise of 300 mJy over several years in the early 1980s (also seen at 5 GHz by Bennett et al. 1984), followed by a period of relatively constant flux density until the end of monitoring in 1992. During the rise period the GHz spectral index was considerably flatter than at other times, which was likely due to a brightening of the flat spectrum core (see § 3.2.2). When UMRAO observations resumed in 2000, the 8 GHz flux density had returned to its original 1980 level.
3.2.1 Arcsecond-scale morphology
The radio morphology of 4C +12.50 is generally compact, with 18 and 6 cm VLA A- and B-array observations showing that most of the flux density comes from a region arcsec (220 pc) in extent (Spencer et al., 1989; Antonucci, 1985; Ulvestad et al., 1981). This size has been confirmed with MERLIN at 18 cm (Xiang et al., 2002). The total interferometric flux densities at 18 cm are generally consistent with single-dish measurements (e.g., Mitchell et al. 1994), suggesting that the compact component accounts for nearly all of the cm-wave flux density. However, a VLA D-array image at 6 cm by Condon & Broderick (1991) does show two very weak (a few mJy) extensions of diffuse emission, one north of the core, and one to the southwest. An extracted 20 cm image from the VLA FIRST survey 333http://sundog.stsci.edu also shows slightly extensions in these directions. The total extent of the diffuse emission is approximately 20 arcsec (44 kpc). Without more sensitive, high-resolution observations it is difficult to speculate whether or not this represents material emitted during an earlier period of AGN activity in the system. We note that the spatial extent of 4C +12.50 is similar to that of 0108+388 (30 kpc; Baum et al. 1990).
3.2.2 Milliarcsecond-scale morphology
The compact structure in 4C +12.50 has been imaged with VLBI at wavelengths ranging from 2 to 18 cm (Fey, Clegg, & Fomalont, 1996; Stanghellini et al., 1997; Fomalont et al., 2000; Stanghellini et al., 2001; Zensus et al., 2002; Xiang et al., 2002). In the following discussion we will use, as much as possible, the same component nomenclature as Stanghellini et al. (1997). In Figure 1 we show our full-track 2 cm VLBA image (epoch 2001.01), which has a significantly lower noise level () than the epoch 1996.30 image of Stanghellini et al. (2001), due to the larger bandwidth and longer integration time (see Table 1). The overall structure consists of a compact core component (A1) associated with the active nucleus, a well-defined jet extending 75 mas to the south, a faint extension to the north of the core, and a more diffuse region to the northwest (F).
Stanghellini et al. (2001) and Xiang et al. (2002) both identified component A1 with the core on the basis of its relatively flat spectral index between 2 and 18 cm. We find additional evidence supporting this identification, in that it is the brightest, most compact feature in our image. In blazars, the core is usually appreciably polarized (e.g., Lister 2001), and indeed A1 is the only polarized feature in this region of the source (see Fig. 2). The relatively high brightness of the core compared to the lobes is typical for CSOs found in nearby galaxies with large apparent magnitudes (Augusto, Wilkinson, & Browne, 1998).
The northern jet is significantly fainter and shorter than the southern jet. It is well-collimated near the core, but then disappears, only to reappear as a region of diffuse emission further to the northwest. This emission was also detected at 6 and 18 cm by Stanghellini et al. (1997) and Xiang et al. (2002), respectively, leading to the initial classification of 4C +12.50 as a CSO.
The southern jet is somewhat knotty, and has an unusually high length-to-width ratio compared to the jets of typical AGN. For the purposes of measuring apparent motions, we have modeled it using 8 distinct emission regions labeled A1 through F in Figure 1. The jet remains narrow and well-collimated until it undergoes a sharp bend near D1. The small opening angle and knottiness prior to D1 suggests a high internal Mach number that is typical of powerful FR-II type jets. Past D1 the jet widens considerably and becomes rather diffuse, with much of the flux being resolved out in our high resolution image. A simultaneous 2 cm observation at UMRAO gave a total flux density of 1420 mJy, compared to only 950 mJy recovered in our VLBA observation (M. and H. Aller, private communication). The 6 cm VLBI image of Stanghellini et al. (1997) shows that the southern jet past D1 is embedded in a roughly circular, steep-spectrum emission region with diameter 30 mas. Their image lacks a similar amount of the total flux at 6 cm ( 400 mJy).
It is useful to examine whether the increase in apparent opening angle past D1 could be a projection effect resulting from bending toward the line of sight. As we will show in § 4, the jet flow prior to the bend is relativistic, and is likely oriented close to the plane of the sky. The apparent jet opening angle before to the bend is , while after the bend it increases to . Assuming an initial viewing angle of , then the change in viewing angle past the bend is . This would imply a change of viewing angle of toward the line of sight. Since the jet flow is relativistic, beaming effects would be expected to cause a significant apparent brightening in the jet past D1, yet the surface brightness remains relatively constant before and after the bend. We therefore conclude that the increase in opening angle past D1 is real and not a projection effect.

3.2.3 Polarization properties
The integrated linear polarization of 4C +12.50 is extremely low. VLA-A configuration observations of Stanghellini et al. (1998) give an upper limit () at wavelengths from 3.6 to 18 cm; similar upper limits were obtained at 2, 3.6 and 6 cm during the UMRAO monitoring program. Although Weiler & de Pater (1983) claimed to measure very weak circular polarization at 49 cm (V = Jy), there have been no reported detections of circular polarization at other wavelengths. The generally low polarizations of CSO and GPS sources have been attributed to Faraday depolarization, possibly by a foreground screen associated with the narrow-line region (O’Dea, 1998).
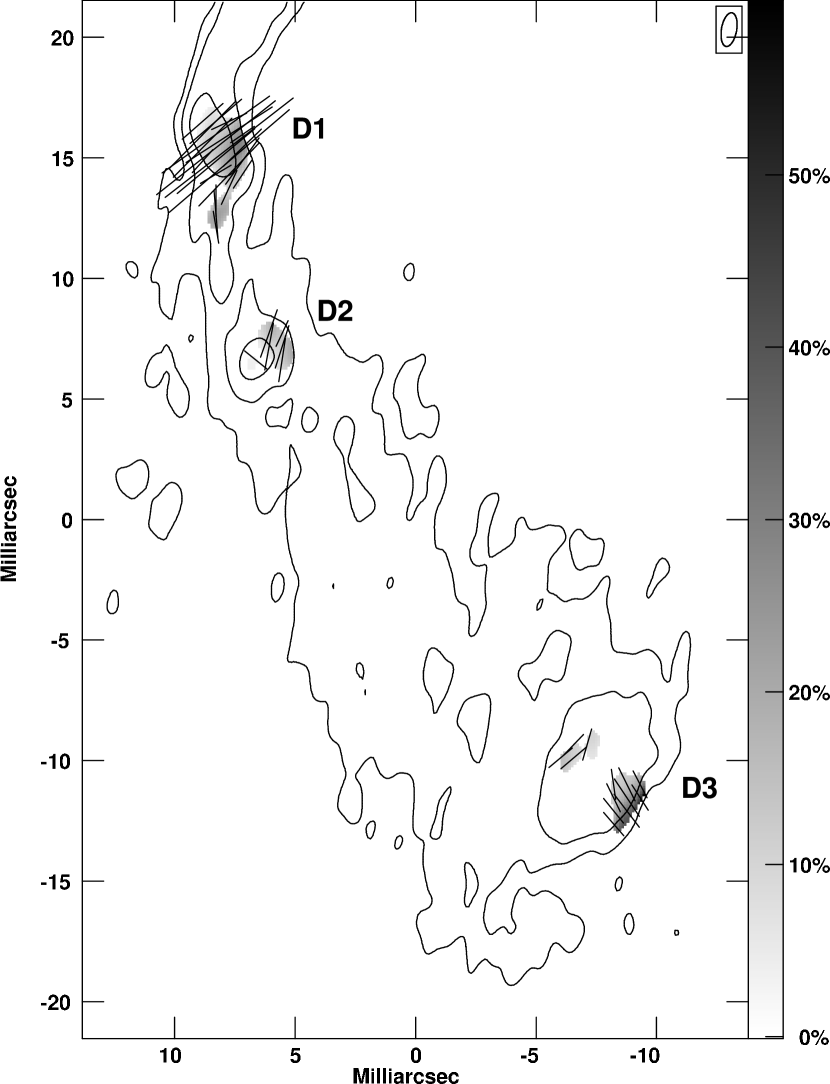
The milliarcsecond-scale linear polarization structure of 4C +12.50 at epoch 2001.01 is shown in Figures 2 and 3. As expected, the integrated fractional polarization level over the entire source is very low (), with the fractional polarization at the fitted core position being only (0.3 %). The mean level for the surrounding region is . However, surprisingly high fractional polarization levels are found in the southern region of the jet. Both the total and polarized intensity contours at D1 are extended toward the southwest, with the electric vectors being aligned roughly perpendicular to this direction. The fractional polarization gradually increases toward the southwest, reaching a maximum value of at the outer edge. The fractional polarization averaged over the entire feature is 11%. The polarized emission at D2 is also concentrated toward the west, and has mean and peak values of 9 and 20%, respectively. The most interesting polarization feature lies at the extreme southern end of the jet, near component D3. Along an extension of the line connecting components D2 and D3, the fractional polarization steadily increases to a maximum of at the outer edge, where both the I and P contours become extremely steep. The high degree of field order and perpendicular E vectors of this feature are consistent with a termination shock or “working surface” where the jet encounters the interstellar medium and rapidly decelerates.
The polarized features at D1 and D2 are likely associated with shocks that energize relativistic particles in the flow and order the magnetic field. As a jet loses kinetic energy through a series of internal shocks, its Mach number will drop, which can eventually lead to subsonic flow and subsequent expansion and decollimation (Mendoza & Longair, 2002). Such a situation may be present in the inner kpc-scale jets of FR-I sources such as 3C 31, in which standing shocks are thought to trigger a sudden flaring in the jet opening angle (Laing & Bridle, 2002). The jet of M87 also has a relatively constant opening angle until it is disrupted at the site of an oblique shock (Bicknell & Begelman, 1996). Such shocks can arise from the well-known helical () Kelvin-Helmholtz instability produced as the jet propagates through the interstellar medium. We will discuss further evidence for K-H instabilities in the jet of 4C +12.50 in § 5.2.
The isolated regions of high polarization seen in 4C+12.50 are highly unusual for a GPS/CSS source, and are somewhat unexpected, given the large quantity of gas present in its host galaxy. If sufficiently magnetized, such a medium would be expected to efficiently depolarize any synchrotron radiation from the jet. It is possible, however, that the intervening medium has a low filling factor and is rather clumpy. Recent Faraday rotation studies (e.g., Zavala & Taylor 2002) have revealed highly non-uniform environments in the inner regions of AGN. Indeed, there are several isolated regions of the jet (e.g., B1, B2, and C) that have comparable brightness to D2 and D3, but have low fractional polarization, perhaps as a result of external Faraday depolarization. Also, the sharp intensity and polarization gradients at D3 suggest that the jet has been disrupted after slamming into a high density region.

4 Jet kinematics
We have investigated proper motions within the radio jet by using the “modelfit” task in Difmap to fit elliptical Gaussian components to isolated bright features (with the exception of component B1 where we used a function component). We began by fitting a model to a single epoch (1999 Nov 1). We then fit the other epochs by allowing the component fluxes and positions to vary, and keeping all other parameters fixed. We also experimented using combinations of circular and -function components, and allowing all parameters to vary, but these methods yielded a much higher degree of scatter in the component positions across epochs.
The formal of our fits were significantly higher than unity due to the large amount of diffuse structure present in the jet, which cannot be easily modeled with Gaussian components. To obtain error estimates on the component positions, we used the Difwrap package (Lovell, 2000). This program varies the component positions by regular increments until the model no longer provides an acceptable fit to the visibilities. We list the fitted component positions and associated errors for each epoch in Table 2. For the bright, isolated components, our positional errors are typically the width of the restoring beam.
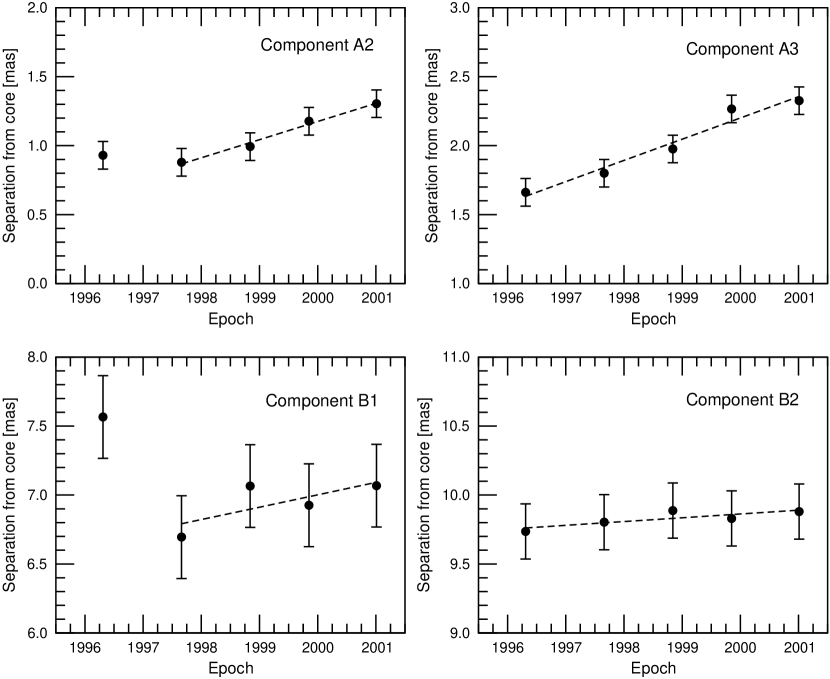
In Figure 4 we show separation versus time plots for the four innermost jet components (A2, A3, B1, and B2) with respect to the core component (A1), which we consider to be stationary. With the exception of the first epoch for components A2 and B1, the component positions are well-described by linear motion outward from the core. In the case of A2, the fitted position at epoch 1996.30 is likely affected by blending with the core. The discrepancy in the 1996.30 position of B1 is much larger, however, and could be due to a component misidentification at this epoch.
We performed linear regression fits to all of the component positions, the results of which are listed in Table 3. The only components with statistically significant proper motions are A2 and A3. The remainder are all consistent with zero speed to within the errors. Our time baseline of 4.7 years allows us to set an upper limit of on their speeds.
The mildly superluminal speeds of A2 and A3 ( and , respectively) indicate that the inner jet of 4C +12.50 has only a moderate Lorentz factor and/or is viewed at a large angle to the line of sight. Although slow apparent speeds are possible in a highly relativistic jet that is viewed inside the critical angle , where is the bulk Lorentz factor, this is not likely to be the case for 4C +12.50. Its lack of blazar properties (i.e., strong variability and polarization) and its two-sided morphology suggest that the jets lie fairly close to the plane of the sky. Provided that the pattern speed is the same as that of the bulk flow, the apparent speed of component A3 limits the viewing angle in that region of the jet to be within 80 degrees of the line of sight, and the bulk flow speed to be greater than .
Superluminal motion has so far been detected in only a few CSS sources: 3C 138 (Cotton et al., 1997), 3C 147 (Alef, Preuss, & Kellermann, 1990), 3C 216 (Paragi et al., 2000), CTA 102 (Jorstad et al., 2001), and 3C 380 (Polatidis & Wilkinson, 1998). All of these sources have one-sided jets on parsec scales. To date there have been no reported superluminal speeds in the jets of CSOs. Taylor & Vermeulen (1997) reported a speed of for one component (N5) of 1946+708, but with a high degree of uncertainty due to positional errors associated with component blending.
4.1 Constraints on jet speed and viewing angle
The relative flux densities of the jet and counter-jets in 4C +12.50 can be used to constrain their speed and orientations, provided that they have intrinsically identical properties. The overall morphology and jet ridgeline of the northern counter-jet region (CJ) differs considerably from the southern jet, even taking into account the possibility of relativistic time-delays. In particular, there is no diffuse lobe of emission surrounding the northern jet, which suggests that the external environments at the ends of the northern and southern jets are considerably different. Any local differences in the external medium are likely to be less extreme in the small region close to the central engine, so we have chosen to confine our measurements of the jet-to-counter-jet flux density ratio () to within 6 mas of the core.
The integrated flux density of the region mas north of the core is 4 mJy, while the same region south of the core has mJy, giving a ratio of (we have excluded the region mas in order to eliminate any contribution of the core flux due to smearing of the restoring beam along the jet axis). At the position of component A3, the flux ratio is approximately 7. We therefore adopt a value of for the inner jet in the following analysis.
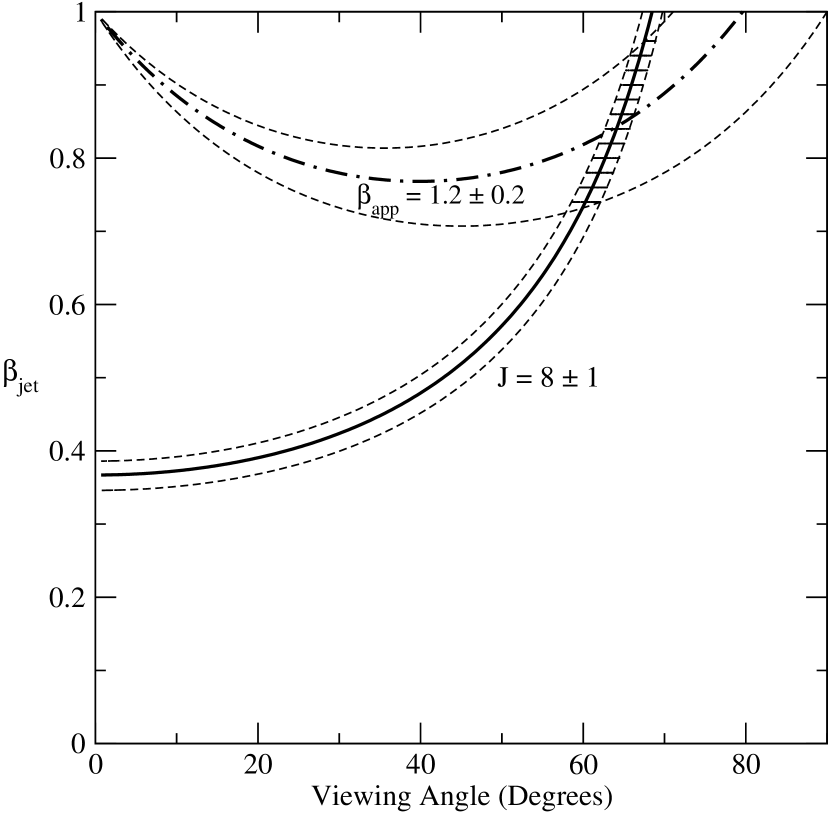
Assuming Doppler beaming (e.g., Urry & Padovani 1995), , where is the intrinsic jet speed in units of , is the angle to the line of sight, and for continuous jet emission. Here we assume a typical value of for the jet spectral index.
If we make a further assumption that the pattern speed of component A3 ( c) is representative of the bulk speed responsible for the Doppler boosting, then the bulk Lorentz factor is , and . The inferred viewing angle at component A3 is . In Figure 5 we show a graphical representation of these constraints in the plane. The hashed region shows the allowed range of speed and viewing angle for the jet at the position of component A3.
The high intrinsic speed of the 4C +12.50 jet suggests that there are likely to be other CSOs with end-on orientations that are appreciably beamed. Such a population has not yet been positively identified. However, their high intrinsic luminosities suggest that they are likely bright enough to already be present in current radio source catalogs. Given that the maximum possible Doppler factor of 4C +12.50 () is much less than those inferred for the most highly beamed blazars (e.g., ; Fujisawa et al. 1999), the beamed versions of CSOs would be expected to have less extreme properties. Their integrated fractional polarizations should be much lower than blazars, due to Faraday depolarization by dense surrounding gas.
5 Evidence for jet precession
The jet ridgeline in 4C +12.50 traces out an “” shape that is highly reminiscent of those seen in galactic microquasars such as SS 433 (Hjellming & Johnston, 1981; Schilizzi et al., 1981). The latter have been successfully fit by jet models in which the nozzle axis precesses slowly and material flows out on ballistic trajectories. In these models the jet ridgeline appears to trace out an apparent three dimensional helical path on a conical surface, but the velocity vectors of the jet material are all directed radially outward from the nozzle. In cases where the velocities are relativistic, the receding jet ridgeline appears compressed, since we are seeing radiation emitted at an earlier time than that of the main (forward) jet.
5.1 Ballistic or streaming motion?
On first inspection, the morphology of 4C +12.50 appears to fit the main predictions of the ballistic model: the counter-jet appears compressed and has a similar bend to the main jet, and all of the jet emission is confined within two conical regions whose apexes are located at the core. Most importantly, the sinusoidal path of the southern jet ridgeline is consistent with that of a helix seen in projection. A closer examination of the southern jet, however, reveals several features which suggest that the jet material is not moving on simple ballistic trajectories. The most convincing evidence can be found at the very tip of the southern jet (component D3 in Fig. 3). Both the E vectors and the gradients in total intensity and in fractional polarization run nearly perfectly parallel to the jet ridgeline that joins D2 and D3. If the material at D3 were moving radially outward from the core, one would have to postulate that all of these alignments occurred simply by chance, which is highly unlikely. Also, the fact that the sites of high fractional polarization are located at the major bend and terminus of the southern jet cannot be easily explained by the ballistic model. A more plausible explanation is that the jet material is streaming parallel to the jet ridgeline, and undergoes shocks at D1 and D3. Strong evidence for helical streaming motion has already been found in other AGN jets such as 3C 273 (Lobanov & Zensus, 2001) and BL Lacertae (Denn, Mutel, & Marscher, 2000).
5.2 Helical streaming model
Theoretical studies of Kelvin-Helmholtz (K-H) instabilities in relativistic jets (e.g., Hardee 1987) have shown that they are susceptible to large helical twisting patterns provided there is a suitable perturbation mechanism present at the jet nozzle. These findings have been confirmed by extensive numerical simulations (e.g., Hardee, Cooper, & Clarke 1994) that show a variety of K-H surface and displacement modes. According to the K-H model of Hardee (1987), the n = 1 helical fundamental mode displaces the entire jet. Higher modes merely produce helical fluting patterns on the surface, but do not displace the jet ridgeline. For the mode in a conical jet, the dependence of helix wavelength on distance along the jet axis () is of the form , where depends on the external pressure gradient and the adiabatic index of the jet. The conical boundaries of the helix imply that the pitch angle remains constant (i.e., if ), or decreases with r (if ). The pitch angle of the jet in 4C +12.50 appears to increase down the jet, however, which would imply . Such a situation could arise if the instability is driven by precession and the wave speed remains constant down the jet (P. Hardee, private communication).
5.3 Helical model fitting
A major difficulty in fitting helical models to relativistic jets is that a minimum of six parameters are needed to describe a helix in three-dimensional space (see Table 4). In our case, however, we can narrow the parameter space considerably by using the constraints on the speed and orientation of the inner jet from § 4.1. In fitting a conical helix to the jets of 4C +12.50, we have chosen to adopt the right-hand coordinate system of Gower et al. (1982), in which the observer’s line of sight lies along the x axis, and the y–z plane represents the plane of the sky. The helix axis () lies in the x–z plane at an angle to the x axis. The helix has a constant wavelength, and lies on the surface of a cone of half angle whose axis is coincident with . The parametric equation for the helix is
| (1) |
where represents the distance along . The phase angle of the helix varies according to , where , is the wave number, and for a right-handed helix. The viewing angle to the local velocity vector along the jet is given by
| (2) |
Substituting equation (1) into equation (2) gives
| (3) |
For simplicity we adopt a speed of along the entire jet. The observational constraints on the fitted helix are the position of the ridgeline on the sky, and the speed and viewing angle of the jet at A3. The large jet/counter-jet flux ratio at A3 implies that the southern jet at this location makes a smaller angle to line of sight than the equivalent segment on the counter-jet side. The position angle of the ridgeline at A3 then implies a right-handed helix (i.e., the southern jet would trace a counterclockwise spiral on the sky if it were viewed end-on). Using the same arguments, the initial phase angle is constrained to lie in the range .
In order to find the best combination of parameters that fit these constraints, we calculated the predicted ridgelines of a set of models with , pc, and , and the above range of . Within this set of models, we considered only those combinations of parameters that gave a viewing angle of for the inner jet. The combination that gave the best fit to the observed ridgeline of 4C +12.50 is given in Table 4. Although the viewing angle of the inner jet provides a powerful constraint on the uniqueness of this fit, the minimum in parameter space is somewhat shallow due to the fact that the southern jet undergoes barely a complete helical turn. Reasonably good fits to the ridgeline can be obtained with the parameter ranges given in column 4 of Table 4.
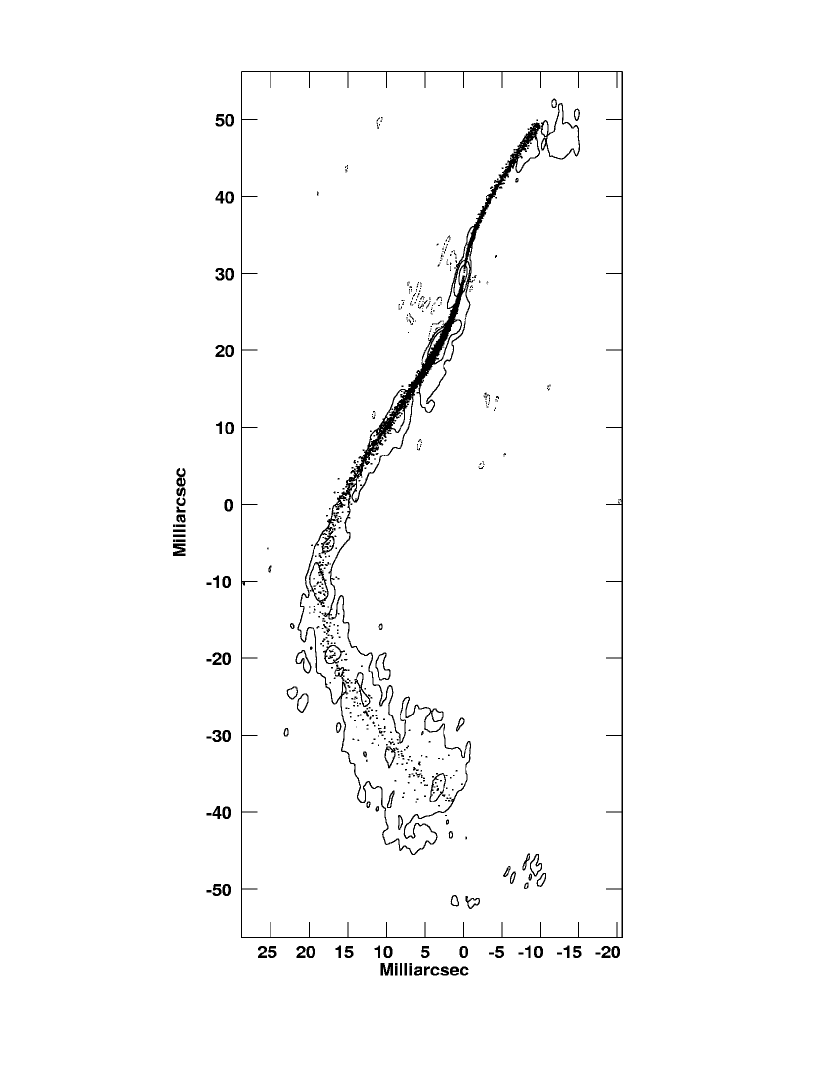
We show a dot-representation of our best fit model in Figure 6. This representation assumes a constant jet opening angle of , and a power law emissivity decay with index of along the jet. The latter value is typically observed in quasar jets (e.g., Homan et al. 2001). The density of the dots is proportional to the beamed total intensity. We have truncated the northern jet at a distance of 20 mas to match the data. Time-delays may cause a significant difference in the apparent length of the jet and counter-lobe, provided that at the end of the jet. The predicted viewing angle at D3 in our model, however, is , which suggests that time delays are unimportant, irrespective of the lobe advance speed. Although the positions of individual features in the remainder of the jets can be affected by time delays, the overall ridgeline will be unaffected due to the fact that material is continually streaming along it. For these reasons, we did not incorporate any time delay corrections into our helical streaming model.
The model does a fairly good job at reproducing the jet ridgeline, with the exception of the region south of A3, where the jet appears to curve too far to the west. There also appears to be emission to the east of the fitted ridgeline at this location. The other major discrepancy with the model occurs at the end of the northern jet, where the emission appears to extend too far in a westerly direction. The overall fit to the total intensity is somewhat poorer than that of the ridgeline, as the model predicts that the counter-jet should actually increase in flux with distance from the core as the viewing angle twists toward the line of sight. Instead, there appears to be a gap in the counter-jet in this region. The fact that the jet and counter-jet cannot be fit with a symmetric model at distances further than pc from the core suggests that the local properties of the external medium at these radii differ considerably from one side of this source to the other. Asymmetric environments have been invoked to explain Faraday asymmetries in other GPS and CSS sources such as 3C 147 (Junor et al., 1999) and 3C 216 (Taylor, Ge, & O’Dea, 1995).
6 Is 4C +12.50 a young radio source?
Although the extended emission associated with 4C 12.50 suggests that it may have been active in the past, the compactness of the parsec-scale emission suggests that the jets have only recently restarted after a long period of inactivity. All of the age determinations carried out for other CSOs have been based on the relative separation speeds of components located at the extreme end of the jet and counter-jet. These measurements were simplified somewhat by the fact that the terminal “hotspots” in these sources were quite bright and compact, which enabled their positions to be determined with high accuracy. In the case of 4C +12.50, the emission at the ends of the jet and counter-jet is too diffuse to obtain a precise lobe advance speed. Our poor positional accuracy on component D3 provides only an upper limit of 2 c on the apparent motion at the end of the jet, whereas typical measured advance speeds in CSOs are on the order of 0.3 c (Owsianik, Conway, & Polatidis, 1999). The latter speed would imply an age of only y for the parsec-scale structure in 4C +12.50. A slow lobe advance speed would also imply a significant deceleration of the jet from its initial value of in the inner jet. This deceleration could conceivably occur either at the strong bend (component D2), or at component D3. Snellen et al. (1998) have incorporated such jet deceleration in a model of GPS sources that can explain their symmetric morphologies and flux outburst behavior.
The overall host galaxy properties of IRAS 13451+1232 are generally consistent with the notion that the parsec-scale outflow is fairly recent. ULIGs are thought to represent an early stage of quasar evolution (Sanders & Mirabel, 1996), and those with relatively “warm” infrared colors such as IRAS 13451+1232 may be in a transition from a cold ULIG phase to an optical quasar phase (Sanders et al., 1988). Mirabel (1989) proposes that IRAS 13451+1232 is a young progenitor of a bright radio IR spiral such as Arp 220, and is still confined by large densities of gas and dust. It was also the most morphologically disturbed object in a sample of nearby luminous radio galaxies studied by Smith & Heckman (1989). According to Gilmore & Shaw (1986), the disturbed outer isophotes imply that the merger was both violent and recent, since phase mixing should have restored symmetry in about y.
Although the merger timescales for massive galaxies (on the order of y) are much longer than the observed ages of CSOs, the timescale for black hole mergers which could trigger the radio jets are likely much shorter (D. Meier, private communication). After such a merger, the spin axis of the black hole is predicted to align with the accretion disk in a relatively short time of about y (Natarajan & Pringle, 1998), which would dampen any precession of the radio jets. The prevalence of “S” shaped morphologies in CSOs (e.g., 0108+388, 3C 186, 3C 196, 1946+708, and 2352+495) may simply reflect the fact that their black hole spin axes are still precessing, and have not had sufficient time to stabilize. More detailed observations of the extended emission associated with GPS and CSO sources such as 4C 12.50 could prove useful for constraining the direction of the radio jet axis during periods of previous activity.
7 Summary
We summarize the main results of our multi-epoch VLBA study of the kinematics and polarization properties of the compact symmetric object 4C +12.50 as follows:
1. 4C +12.50 has a relatively low integrated linear polarization on parsec-scales () that is typical of other CSO and GPS sources, and is expected given the large amount of gas present in the host galaxy. The high-resolution polarization images, however, reveal isolated regions in the southern jet with exceedingly high fractional polarizations that range up to . These values are highly unusual for a CSO, and suggest that the depolarizing medium is somewhat clumpy. These findings illustrate the need for more high-resolution polarization-sensitive observations of other CSO and GPS sources in order to better understand their jet magnetic field properties and local environments.
2. A kinematic analysis of 4C +12.50 reveals jet component speeds of and c, which represent the first positive detections of superluminal motion in a compact symmetric object. We are able to fit both the apparent motion and the observed “” shape of the source using a conical helical jet. The helical ridgeline is likely the result of small, periodic perturbations at the jet nozzle that are amplified by Kelvin-Helmholtz instabilities in the flow. These perturbations could arise from orbital motion of the black hole and/or precession of the jet nozzle. The best-fit model suggests that the nozzle is precessing around a cone with half-angle , whose axis lies at an angle of to the line of sight. The jet has a bulk flow speed of 0.84 c, and follows a right-handed helical path with a wavelength of 280 pc.
3. The detection of relativistic speeds in the jet of 4C +12.50 implies the existence of a beamed counterpart population to the CSOs that has yet to be identified. Although the properties of these objects are not expected to be as extreme as blazars, they should have have high apparent flux densities, and are likely already present in current radio AGN catalogs.
References
- Alef, Preuss, & Kellermann (1990) Alef, W., Preuss, E., & Kellermann, K. I. 1990, in Compact Steep-Spectrum & GHz-Peaked Spectrum Radio Sources, eds. C. Fanti, R. Fanti, C. P. O’Dea, & R. Schilizzi, (Bologna: Consiglio Nazionale delle Richerche), 149
- Antonucci (1985) Antonucci, R. R. J. 1985, ApJS, 59, 499
- Augusto, Wilkinson, & Browne (1998) Augusto, P., Wilkinson, P. N., & Browne, I. W. A. 1998, MNRAS, 299, 1159
- Axon et al. (2000) Axon, D. J., Capetti, A., Fanti, R., Morganti, R., Robinson, A., & Spencer, R. 2000, AJ, 120, 2284
- Baum et al. (1990) Baum, S. A., O’Dea, C. P., de Bruyn, A. G., & Murphy, D. W. 1990, A&A, 232, 19
- Bicknell & Begelman (1996) Bicknell, G. V. & Begelman, M. C. 1996, ApJ, 467, 597
- Bicknell, Dopita, & O’Dea (1997) Bicknell, G. V., Dopita, M. A., & O’Dea, C. P. O. 1997, ApJ, 485, 112
- Broten, MacLeod, & Vallee (1988) Broten, N. W., MacLeod, J. M., & Vallee, J. P. 1988, Ap&SS, 141, 303
- Condon & Broderick (1991) Condon, J. J. & Broderick, J. J. 1991, AJ, 102, 1663
- Cotton et al. (1997) Cotton, W. D., Dallacasa, D., Fanti, C., Fanti, R., Foley, A. R., Schilizzi, R. T., & Spencer, R. E. 1997, A&A, 325, 493
- Denn, Mutel, & Marscher (2000) Denn, G. R., Mutel, R. L., & Marscher, A. P. 2000, ApJS, 129, 61
- Dickey et al. (1990) Dickey, J. M., Planesas, P., Mirabel, I. F., & Kazes, I. 1990, AJ, 100, 1457.
- Edge et al. (1996) Edge, A.C., Jones, M., Saunders, R. , Pooley, G., & Grainge, K. 1996, in The Second Workshop on Gigahertz Peaked Spectrum and Compact Steep Spectrum Radio Sources, eds. I. A. G. Snellen, R. T. Schilizzi, H. J. A. Röttgering, & M. N. Bremer, (Leiden: Leiden Observatory), 43
- Evans et al. (1999) Evans, A. S., Kim, D. C., Mazzarella, J. M., Scoville, N. Z., & Sanders, D. B. 1999, ApJ, 521, L107
- Fanti et al. (2000) Fanti, C. et al. 2000, A&A, 358, 499
- Fey, Clegg, & Fomalont (1996) Fey, A. L., Clegg, A. W., & Fomalont, E. B. 1996, ApJS, 105, 299
- Fomalont et al. (2000) Fomalont, E. B., Frey, S., Paragi, Z., Gurvits, L. I., Scott, W. K., Taylor, A. R., Edwards, P. G., & Hirabayashi, H. 2000, ApJS, 131, 95
- Fujisawa et al. (1999) Fujisawa, K., Kobayashi, H., Wajima, K., Hirabayashi, H., Kameno, S., & Inoue, M. 1999, PASJ, 51, 537
- Gilmore & Shaw (1986) Gilmore, G. & Shaw, M. A. 1986, Nature, 321, 750
- Gower et al. (1982) Gower, A. C., Gregory, P. C., Unruh, W. G., & Hutchings, J. B. 1982, ApJ, 262, 478
- Hardee (1987) Hardee, P. E. 1987, ApJ, 318, 78
- Hardee, Cooper, & Clarke (1994) Hardee, P. E., Cooper, M. A., & Clarke, D. A. 1994, ApJ, 424, 126
- Heckman et al. (1986) Heckman, T. M., Smith, E. P., Baum, S. A., van Breugel, W. J. M., Miley, G. K., Illingworth, G. D., Bothun, G. D., & Balick, B. 1986, ApJ, 311, 526
- Hjellming & Johnston (1981) Hjellming, R. M. & Johnston, K. J. 1981, ApJ, 246, L141
- Homan et al. (2001) Homan, D. C., Ojha, R., Wardle, J. F. C., Roberts, D. H., Aller, M. F., Aller, H. D., & Hughes, P. A. 2001, ApJ, 549, 840
- Hurt et al. (1999) Hurt, T., Antonucci, R., Cohen, R., Kinney, A., & Krolik, J. 1999, ApJ, 514, 579
- Imanishi & Ueno (1999) Imanishi, M. & Ueno, S. 1999, ApJ, 527, 709
- Jorstad et al. (2001) Jorstad, S. G., Marscher, A. P., Mattox, J. R., Wehrle, A. E., Bloom, S. D., & Yurchenko, A. V. 2001, ApJS, 134, 181
- Junor et al. (1999) Junor, W., Salter, C. J., Saikia, D. J., Mantovani, F., & Peck, A. B. 1999, MNRAS, 308, 955
- Kellermann et al. (1998) Kellermann, K. I., Vermeulen, R. C., Zensus, J. A., & Cohen, M. H. 1998, AJ, 115, 1295
- (31) Kellermann, K. I., Vermeulen, R. C., Zensus, J. A., & Cohen, M. H. , in prep.
- Kim (1995) Kim, D.-C. 1995, Ph. D. thesis, Univ. Hawaii at Manoa
- Laing & Bridle (2002) Laing, R. A. & Bridle, A. H. 2002, MNRAS, in press
- Lister (2001) Lister, M. L. 2001, ApJ, 562, 208
- Lister & Smith (2000) Lister, M. L. & Smith, P. S. 2000, ApJ, 541, 66
- Lobanov & Zensus (2001) Lobanov, A. P. & Zensus, J. A. 2001, Science, 294, 128
- Lovell (2000) Lovell, J. E. J. 2000, in Astrophysical Phenomena Revealed by Space VLBI, ed. H. Hirabayashi, P. G. Edwards, & D. W. Murphy (Sagamihara: Institute of Space and Astronautical Science), 301
- Mendoza & Longair (2002) Mendoza, S. & Longair, M. S. 2002, MNRAS, 331, 323
- Mirabel (1989) Mirabel, I. F. 1989, ApJ, 340, L13
- Mirabel et al. (1989) Mirabel, I. F., Sanders, D. B., & Kazes, I. 1989, ApJ, 340, L9
- Mitchell et al. (1994) Mitchell, K. J., Dennison, B., Condon, J. J., Altschuler, D. R., Payne, H. E., O’Dell, S. L., & Broderick, J. J. 1994, ApJS, 93, 441
- Natarajan & Pringle (1998) Natarajan, P. & Pringle, J. E. 1998, ApJ, 506, L97
- O’Dea & Baum (1997) O’Dea, C. P. & Baum, S. A. 1997, AJ, 113, 148
- O’Dea (1998) O’Dea, C. P. 1998, PASP, 110, 493
- O’Dea et al. (2000) O’Dea, C. P., De Vries, W. H., Worrall, D. M., Baum, S. A., & Koekemoer, A. 2000, AJ, 119, 478.
- Owsianik, Conway, & Polatidis (1998) Owsianik, I., Conway, J. E., & Polatidis, A. G. 1998, A&A, 336, L37
- Owsianik, Conway, & Polatidis (1999) Owsianik, I., Conway, J. E., & Polatidis, A. G. 1999, New Astronomy Reviews, 43, 669
- Paragi et al. (2000) Paragi, Z., Frey, S., Fejes, I., Porcas, R. W., Schilizzi, R. T., & Venturi, T. 2000, in Astrophysical Phenomena Revealed by Space VLBI, ed. H. Hirabayashi, P. G. Edwards, & D. W. Murphy (Sagamihara: Institute of Space and Astronautical Science), 59
- Perley (1982) Perley, R. A. 1982, AJ, 87, 859
- Polatidis & Wilkinson (1998) Polatidis, A. G. & Wilkinson, P. N. 1998, MNRAS, 294, 327
- Polatidis, Conway, & Owsianik (2002) Polatidis, A. G., Conway, J. E., Owsianik. I., 2002, in Proceedings of the 6th European VLBI Network Symposium, eds. E. Ros, R. W. Porcas, A. P. Lobanov, & J. A. Zensus, (Bonn: Max-Planck-Institut fuer Radioastronomie), 139
- Salgado et al. (1999) Salgado, J. F., Altschuler, D. R., Ghosh, T., Dennison, B. K., Mitchell, K. J., & Payne, H. E. 1999, ApJS, 120, 77
- Sanders et al. (1988) Sanders, D. B., Soifer, B. T., Elias, J. H., Neugebauer, G., & Matthews, K. 1988, ApJ, 328, L35
- Sanders & Mirabel (1996) Sanders, D. B. & Mirabel, I. F. 1996, ARA&A, 34, 749
- Schilizzi et al. (1981) Schilizzi, R. T., Miley, G. K., Romney, J. D., & Spencer, R. E. 1981, Nature, 290, 318
- Schoenmakers et al. (1999) Schoenmakers, A. P., de Bruyn, A. G., Röttgering, H. J. A., & van der Laan, H. 1999, A&A, 341, 44
- Scoville et al. (2000) Scoville, N. Z. et al. 2000, AJ, 119, 991
- Smith & Heckman (1989) Smith, E. P. & Heckman, T. M. 1989, ApJS, 69, 365
- Snellen et al. (1998) Snellen, I. A. G., Schilizzi, R. T., de Bruyn, A. G., & Miley, G. K. 1998, A&A, 333, 70
- Spencer et al. (1989) Spencer, R. E., McDowell, J. C., Charlesworth, M., Fanti, C., Parma, P., & Peacock, J. A. 1989, MNRAS, 240, 657
- Stanghellini et al. (1990) Stanghellini, C., Baum, S. A., O’Dea, C. P., & Morris, G. B. 1990, A&A, 233, 379
- Stanghellini et al. (1997) Stanghellini, C., O’Dea, C. P., Baum, S. A., Dallacasa, D., Fanti, R., & Fanti, C. 1997, A&A, 325, 943
- Stanghellini et al. (1998) Stanghellini, C., O’Dea, C. P., Dallacasa, D., Baum, S. A., Fanti, R., & Fanti, C. 1998, A&AS, 131, 303
- Stanghellini et al. (2001) Stanghellini, C., Dallacasa, D., O’Dea, C. P., Baum, S. A., Fanti, R., & Fanti, C. 2001, A&A, 379, 870
- Surace & Sanders (2000) Surace, J. A. & Sanders, D. B. 2000, AJ, 120, 604
- Taylor, Ge, & O’Dea (1995) Taylor, G. B., Ge, J., & O’Dea, C. P. 1995, AJ, 110, 522
- Taylor & Myers (2000) Taylor, G. B., & Myers, S. T. 2000, VLBA Scientific Memo 26 (NRAO)
- Taylor & Vermeulen (1997) Taylor, G. B. & Vermeulen, R. C. 1997, ApJ, 485, L9
- Ulvestad et al. (1981) Ulvestad, J., Johnston, K., Perley, R., & Fomalont, E. 1981, AJ, 86, 1010
- Urry & Padovani (1995) Urry, C. M. & Padovani, P. 1995, PASP, 107, 803
- van Breugel, Miley, & Heckman (1984) van Breugel, W., Miley, G., & Heckman, T. 1984, AJ, 89, 5
- Veilleux, Sanders, & Kim (1997) Veilleux, S., Sanders, D. B., & Kim, D.-C. 1997, ApJ, 484, 92
- Weiler & de Pater (1983) Weiler, K. W. & de Pater, I. 1983, ApJS, 52, 293
- Xiang et al. (2002) Xiang, L., Stanghellini, C., Dallacasa, D., & Haiyan, Z. 2002, A&A, 385, 768
- Zavala & Taylor (2002) Zavala, R. T. & Taylor, G. B. 2002, ApJ, 566, L9
- Zensus et al. (2002) Zensus, J. A., Ros, E., Kellermann, K. I., Cohen, M. H. , Vermeulen, R. C. & Kadler, M. 2002, AJ, in press
| Observing | Polarization | BandwidthaaObserving bandwidth per hand of circular polarization | Integration | ||
|---|---|---|---|---|---|
| Date | Array | Mode | [MHz] | Time [min] | Reference |
| 1996 Apr 22 | VLBA+Y1 | Dual Circular | 16 | 110 | Stanghellini et al. (2001) |
| 1997 Aug 28 | VLBA | LL only | 64 | 40 | Zensus et al. (2002) |
| 1998 Nov 1 | VLBA | LL only | 64 | 40 | Zensus et al. (2002) |
| 1999 Nov 6 | VLBA | LL only | 64 | 200 | Zensus et al. (2002) |
| 2001 Jan 4 | VLBA+Y1 | Dual Circular | 32 | 540 | This work |
| Cpt. | S | ||
|---|---|---|---|
| Name | [mas] | [deg.] | [mJy] |
| (1) | (2) | (3) | (4) |
| 1996 Apr 22 | |||
| A1 | 203 | ||
| A2 | 0.9 | 59 | |
| A3 | 1.7 | 30 | |
| B1 | 7.6 | 14 | |
| B2 | 9.7 | 224 | |
| C | 20.9 | 87 | |
| D1 | 44.5 | 161 | |
| D2 | 52.2 | 92 | |
| D3 | 65.9 | 139 | |
| 1997 Aug 28 | |||
| A1 | 170 | ||
| A2 | 0.9 | 74 | |
| A3 | 1.8 | 38 | |
| B1 | 6.7 | 6 | |
| B2 | 9.8 | 225 | |
| C | 19.1 | 91 | |
| D1 | 44.5 | 146 | |
| D2 | 52.6 | 83 | |
| D3 | 66.4 | 89 | |
| 1998 Nov 1 | |||
| A1 | 159 | ||
| A2 | 1.0 | 64 | |
| A3 | 2.0 | 24 | |
| B1 | 7.1 | 7 | |
| B2 | 9.9 | 196 | |
| C | 20.9 | 80 | |
| D1 | 44.5 | 143 | |
| D2 | 52.3 | 74 | |
| D3 | 65.9 | 85 | |
| 1999 Nov 6 | |||
| A1 | 169 | ||
| A2 | 1.2 | 61 | |
| A3 | 2.3 | 20 | |
| B1 | 6.9 | 8 | |
| B2 | 9.8 | 194 | |
| C | 20.9 | 91 | |
| D1 | 44.5 | 155 | |
| D2 | 52.4 | 85 | |
| D3 | 66.0 | 97 | |
| 2001 Jan 4 | |||
| A1 | 183 | ||
| A2 | 1.3 | 41 | |
| A3 | 2.3 | 11 | |
| B1 | 7.1 | 13 | |
| B2 | 9.9 | 155 | |
| C | 21.0 | 80 | |
| D1 | 44.5 | 151 | |
| D2 | 52.4 | 79 | |
| D3 | 66.2 | 124 | |
Note. — Columns are as follows: (1) Component name; (2) Distance from core, in milliarcseconds; (3) Position angle with respect to core; (4) Flux density in mJy.
| Cpt. | Maj. | Axial | PA | ||
|---|---|---|---|---|---|
| Name | Axis | Ratio | [deg.] | (mas/y) | |
| (1) | (2) | (3) | (4) | (5) | (6) |
| A1 | 0.47 | 0.67 | |||
| A2 | 0.52 | 0.13 | aaCalculated excluding the 1996 Apr 22 epoch | ||
| A3 | 0.79 | 0.39 | |||
| B1 | 0.00 | aaCalculated excluding the 1996 Apr 22 epoch | |||
| B2 | 2.32 | 0.34 | |||
| C | 5.86 | 0.22 | |||
| D1 | 6.42 | 0.39 | |||
| D2 | 4.73 | 0.61 | |||
| D3 | 7.41 | 0.47 |
Note. — Columns are as follows: (1) Component name; (2) Major axis of fitted component, in milliarcseconds; (3) Axial ratio of fitted component; (4) Position angle of component’s major axis; (5) Component motion in mas/yr; (6) Component speed in units of c.
| Parameter | Symbol | Best Fit Value | Range | Units |
|---|---|---|---|---|
| Half-opening angle of streaming cone | 23 | deg. | ||
| Sky position angle of cone axis | 175 | deg. | ||
| Viewing angle to cone axis | 82 | deg. | ||
| Initial phase angle | 5 | deg. | ||
| Helix wavelength | 280 | pc | ||
| Helix handedness | (right) |