XMM-Newton observations of the nearby brown dwarf LP 944-20
Abstract
The nearby ( pc) brown dwarf LP 944–20 was observed with the XMM–Newton satellite on 07 January 2001. The target was detected with the Optical Monitor (16.7360.081), but it was not detected during the ks observation with the X-ray telescopes. We determine a upper limit for the X-ray emission from this object of , equivalent to a luminosity ratio upper limit of . This measurement improves by a factor of 3 the previous Chandra limit on the quiescent X-ray flux. This is the most sensitive limit ever obtained on the quiescent X-ray emission of a brown dwarf. Combining the XMM–Newton data with previous ROSAT and Chandra data, we derive flare duty cycles as a function of their luminosities. We find that very strong flares [Log2.5] are very rare (less than 0.7% of the time). Flares like the one detected by Chandra [Log4.1] have a duty cycle of about 6%, which is lower than the radio flare duty cycle (13%). When compared with other M dwarfs, LP 944–20 appears to be rather inactive in X-rays despite of its relative youth, fast rotation and its moderately strong activity at radio wavelengths.
1 Introduction
LP 944–20 (=BRI 0337-3535) is an isolated nearby brown dwarf (Mass0.075 M⊙) first identified by Luyten & Kowal (1975). Spectroscopic observations reported by Tinney (1998) give a spectral type of dM9, an age of about 500 Myr and a mass of about 0.065 M⊙ using the lithium test proposed by Magazzù, Martín, & Rebolo (1993). Because of its substellar mass and its proximity to the Sun, this object is a benchmark in the study of very low-mass objects. LP 944–20 was observed in the X-Ray regime for the first time with the ROSAT satellite by Neuhäuser et al. (1999), but was not detected. It has been detected with the Chandra satellite (Rutledge et al., 2000) in december 1999 during an X-ray flare of duration hours. Outside the flare, LP 944–20 was not detected with a 3 upper limit on the emission at . Both quiescent and flaring radio emission have been observed with the VLA (Berger et al., 2001) .
X-ray emission is widespread among fully-convective M dwarfs (spectral type M3 and later), and it is frequently variable (Fleming et al., 1993; Marino, Micela & Peres, 2000; Feigelson et al., 2002). X-ray observations of ultracool dwarfs (spectral type M7 and later) are still very scarce. Strong variability has been observed in a few objects (Rutledge et al., 2000; Fleming et al., 2000; Schmitt & Liefke, 2002). It is thought that the X-ray photons are emitted from a hot corona. The properties of coronae (permanent or transient) in ultracool dwarfs are not well understood.
LP 944–20 was targeted for observations with XMM–Newton for two reasons mainly, first to try to catch it during a flare, which would have allowed to obtain spectroscopy if a flare had occurred, and second to search for quiescent X-ray emission. Unfortunately, we did not detect LP 944–20 at all. Nevertheless, we improve the value of the upper limit on the quiescent X-ray emission from LP 944–20, and we derive X-ray flare rates as a function of X-ray luminosity that may be useful for planning future observations of this brown dwarf.
2 Observations
XMM–Newton observed LP 944–20 on 2001 January 07-08, between 14:21:05 and 04:43:52 UTC for 51767 s. The pointing position was and Epoch 2000, according to the Simbad database.111Simbad database, operated at CDS, Strasbourg, France
2.1 Optical Data and Source Identification
Besides its three X-ray telescopes, XMM–Newton also has a 30-cm optical-UV telescope, providing the possibility to observe simultaneously in the X-ray and optical-UV regimes. The Optical Monitor (OM) was used with the filter for four exposures of 5000 s each in imaging mode. The OM detector has a format of pixels, each . The field of view is therefore .
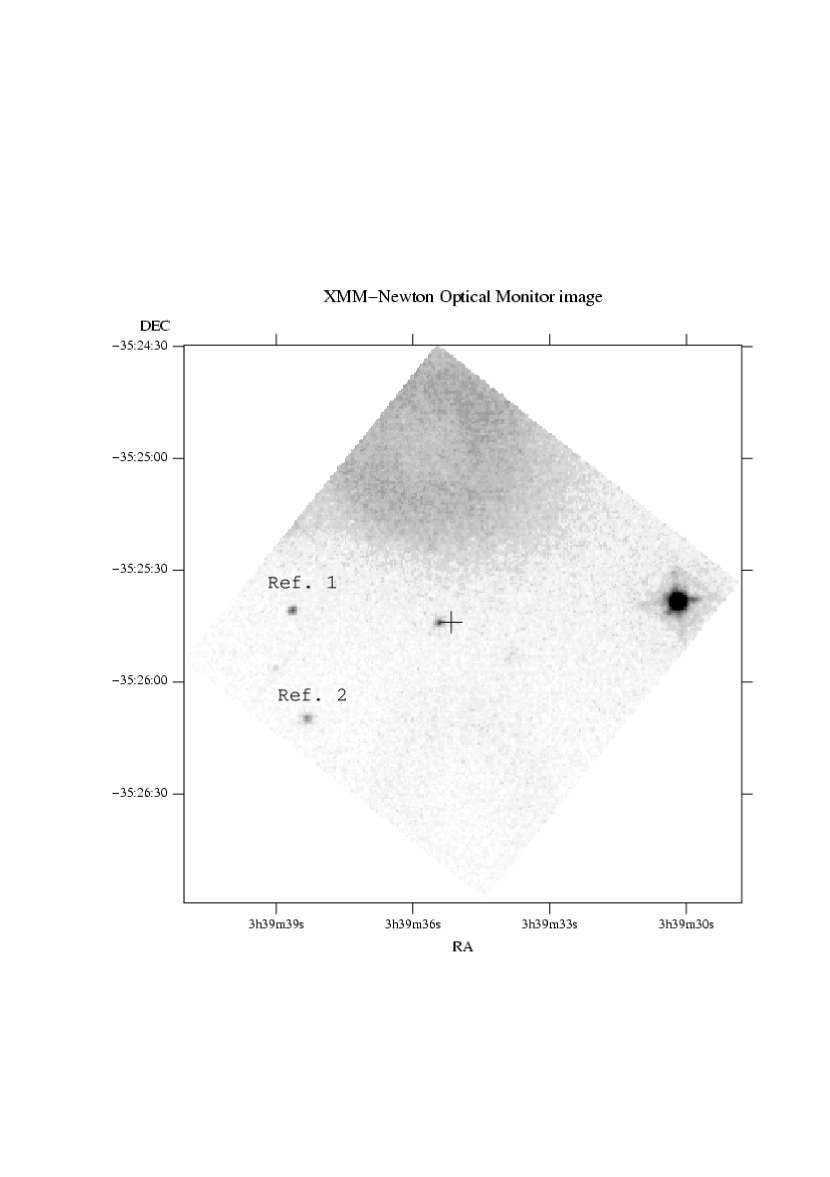
We used the data given by the OM to confirm the presence of the source in the field of view. The coordinates we used to identify LP 944–20 are different from the pointing coordinates. We used the more recent coordinates given by the astrometry of Rutledge et al. (2000) after their observation of LP 944–20 with Chandra during a X-ray flare in 1999 December. These coordinates are: and , epoch 1999.95.
We identified LP 944–20 in the field of view by plotting these coordinates on the four images given by the OM. The result is shown in Figure 1. We found a point-source at a distance of from the expected coordinates of LP 944–20. This offset is small in comparison with the known systematic uncertainties in the XMM–Newton preprocessing analysis astrometry (XMM–Newton User’s Handbook, 2000). Moreover a small offset was also expected because of the proper motion of LP 944–20 since it was observed by Rutledge et al. (2000) more than one year ago. The offset in the optical position is consistent with the known proper motion of LP 944–20. We were also able to identify the three other sources in the field of view simply by direct comparison with the image obtained by Rutledge et al. (2000). We therefore identify this optical source with the brown dwarf LP 944–20 on the basis of positional coincidence with the expected coordinates.
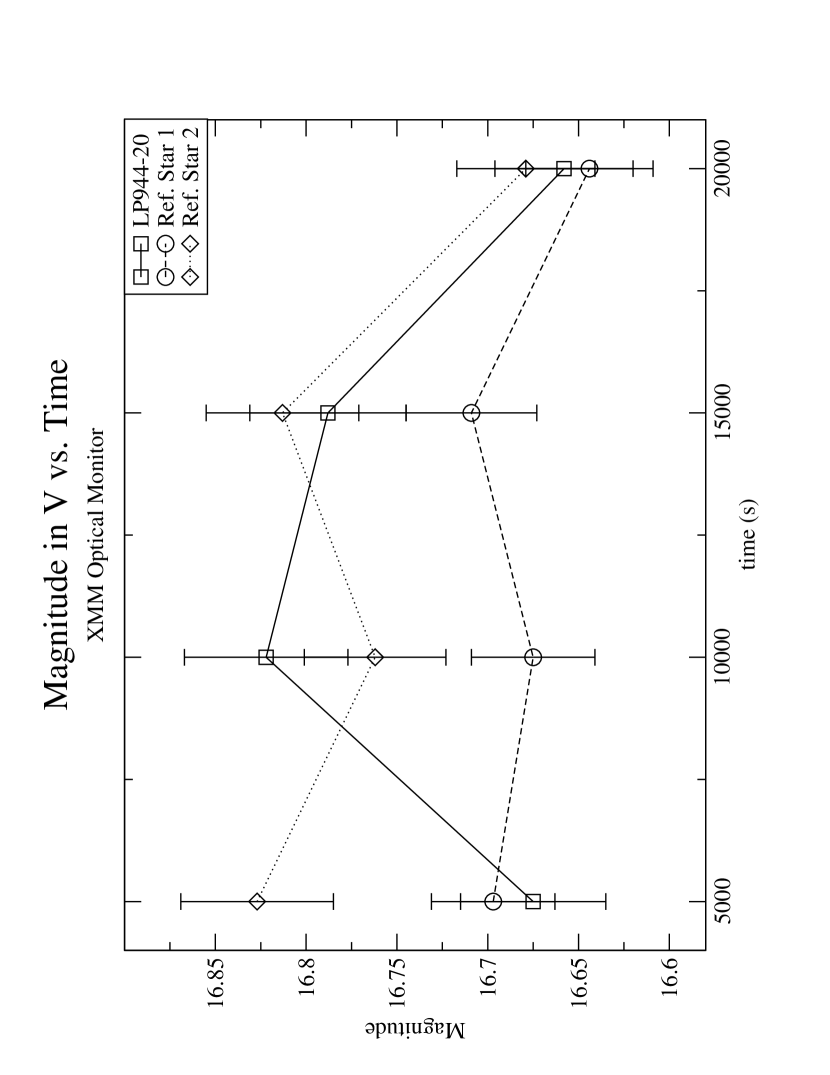
We also used the four exposures given by the OM to look for optical variability. The magnitudes of the source identified as LP 944–20 and of two other stars in the field of view were calculated using the IRAF phot task. This allowed us to plot the evolution of the magnitude during the whole observation. The result is shown in Figure 2.
The behavior of LP 944–20’s magnitude is different than that of the two other stars.
We notice that whereas the magnitudes of the two reference stars are roughly correlated, LP 944–20’s magnitudes are not.
We measure a mean magnitude of 16.736 and a standard deviation of 0.081 for LP 944–20. For reference star 1 we measure
a mean magnitude of 16.681 and a standard deviation of 0.028. For reference star 2 we measure
a mean magnitude of 16.770 and a standard deviation of 0.067. We conclude that LP 944–20 may be variable in the OM data. The variability of LP 944–20, however, is only slightly higher
than that of reference star 2. We cannot make a definitive claim that LP 944–20 is variable in our data because of the lack of enough reference stars in the field of view.
2.2 X-ray Data and Analysis
The European Photon Imaging Camera (EPIC) MOS1 & MOS2 were used. The total ontarget exposure time in each camera was 48724 s in prime full window mode with 2.5 s time resolution. The EPIC PN was used in prime full window mode with 73.4 ms time resolution and ontarget exposure 46618 s. Each EPIC instrument was used with the thin filter, which suppresses the optical contamination up to of 18 (MOS) or of 17 (PN). Both MOS & PN detectors have a circular field of view of diameter. For more details on XMM–Newton and its instruments, we refer to XMM–Newton User’s Handbook (2000).
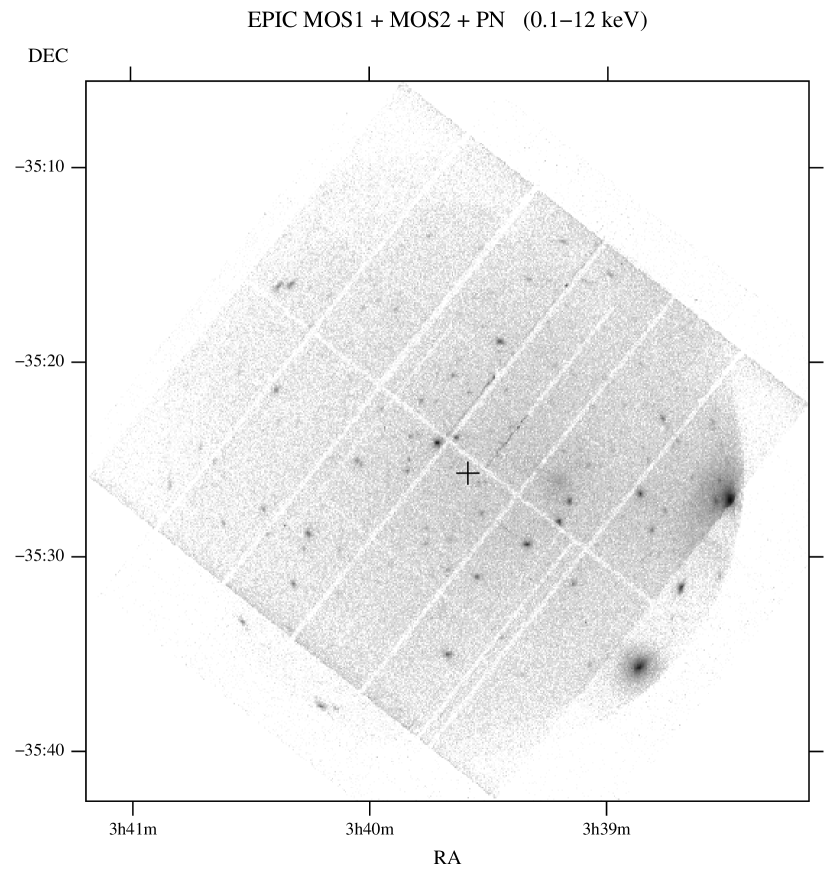
The first step was to search for LP 944–20 in the field of view of each EPIC MOS & PN detector. We plotted the coordinates of LP 944–20 on each image obtained by each detector, but we did not detect any source. To be sure that we were using the most sensitive exposure, we used the image given by the pipeline which combines data from all EPIC’s MOS & PN in the entire energy range ( ), as shown in Figure 3.
On these figures, the X-ray source closest to the expected position is offset by and . This offset is large in comparison with the offset observed with the optical data. So at this point we already knew that LP 944–20 was not detected.
We performed differential astrometry between the XMM–Newton and Chandra images. This allowed us to identify all the X-ray sources in our field of view in an area of centered on the expected coordinates of LP 944–20. We were then able to conclude that LP 944–20 was not detected during the XMM–Newton observation.
Since the target was not detected, the first conclusion is that there was no significant X-ray flare during this ks observation.
Nevertheless, it is interesting to calculate the upper limit on the time average quiescent X-ray luminosity.
We did the calculation of the upper limit of X-ray flux with each of the 3 images of the preprocessing products, corresponding to the 3 exposures obtained with the EPIC MOS1, MOS2 & PN detectors on the entire energy range ( keV).
To calculate a flux upper limit, we considered an area of twice the FWHM ( pixels) around the expected position of
LP 944–20. In this area we calculated the mean value of and the corresponding standard deviation using the IRAF222IRAF is distributed by National Optical Astronomy Observatory, which is operated by the Association of Universities for Research in Astronomy, Inc., under contract with the National Science Foundation. phot task, which gives count rates corrected for background. The results are listed in Table 1. As the EPIC PN camera is the most sensitive detector,
we therefore only consider its result to calculate the flux upper limit.
To convert this count rate to flux, we followed XMM–Newton User’s Handbook (2000) instructions, by using the PIMMS333nH and PIMMS (Portable, Interactive, Multi-Mission Simulator) are distributed by the NASA’s HEARSAC software. As LP 944–20 was not detected during the observation, we were not able to fit its spectrum in order to know its spectral type. We adopted the results of Rutledge et al. (2000) summarized in Table XMM-Newton observations of the nearby brown dwarf LP 944-20. The HI column density was calculated using the nH333nH and PIMMS (Portable, Interactive, Multi-Mission Simulator) are distributed by the NASA’s HEARSAC software: .
The results for the upper limit of flux and X-ray luminosity (3, assuming Gaussian statistics) are listed in Table XMM-Newton observations of the nearby brown dwarf LP 944-20. The uncertainties on these values are Poisson (counting statistics) plus spectral uncertainty, according to Rutledge et al. (2000). As their best fit on the spectrum was obtained with the Raymond–Smith thermal plasma model, we finally kept the corresponding 3 flux as the upper limit on the time average quiescent X-ray luminosity for LP 944–20: , equivalent to a luminosity ratio upper limit of .
3 Discussion
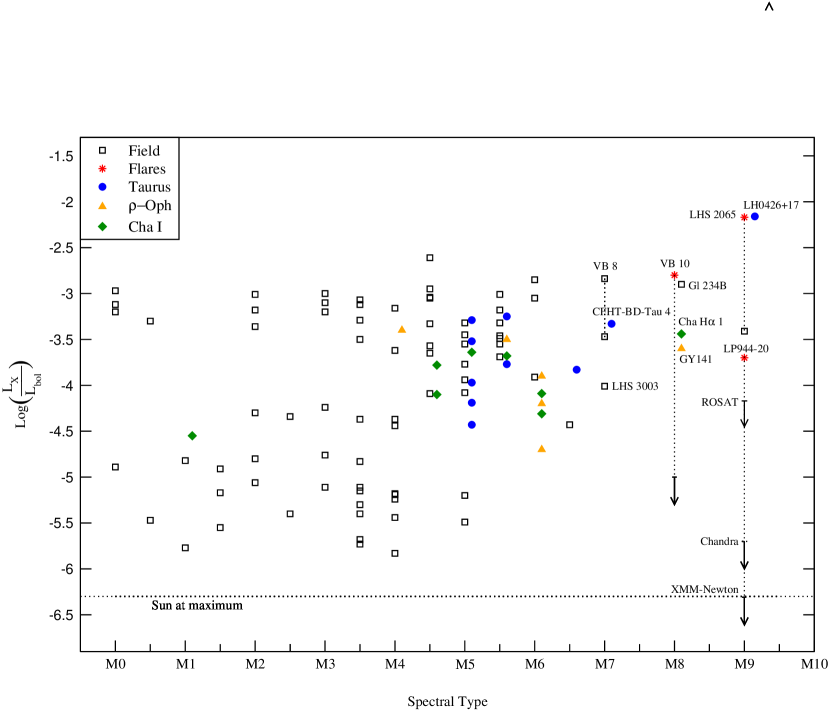
The first observation of LP 944–20 in the X-ray regime by Neuhäuser et al. (1999) with the ROSAT satellite placed an upper limit of after a 220 ks ROSAT—HRI observation. The second X-ray observation (Rutledge et al., 2000) placed a better upper limit of after the 44 ks Chandra—ACIS-S observation before the flare. Our new value improves this upper limit of quiescent X-ray emission at . The corresponding upper limit of X-ray luminosity () is thus improved by a factor 3. This value is close to the solar X-ray emission level during its maxima of activity.
In Figure 4 we display the dependence of X-ray activity versus spectral type for M dwarfs. The upper envelope of X-ray activity is remarkably independent of M subclass. There is no obvious connection between age and X-rays. The M dwarfs in the ChaI, Oph and Taurus star-forming regions show X-ray emission comparable to much older field dwarfs (Neuhäuser et al., 1999; Mokler & Stelzer, 2002). We conclude that there is no evidence for a decline in coronal emission with increasing age in fully convective M dwarfs.
We have estimated the rate of X-ray flare occurrence in LP 944–20 by adding 287.5 ks of ROSAT data analyzed by Neuhäuser et al. (1999), 43.8 ks of Chandra data analyzed by Rutledge et al. (2000) and 51.7 ks of XMM–Newton data (this paper). The duration of the only flare so far observed was 2.76 ks Rutledge et al. (2000). Thus, we get an X-ray flare frequency of 0.72% for flares with luminosity Log2.5. Weaker flares could not have been detected by ROSAT. Thus, we derive the duty cycle of flares with luminosity comparable with the flare detected by Chandra [Log4.1] to be about 6%.
The published VLA radio data have a duration of 79.9 ks (Berger et al., 2001). Three flares were detected with a total duration of 10.4 ks. Hence, we estimate a radio flare frequency of about 13%. It is not known to what X-ray luminosity the radio flares correspond, but we can set an upper limit using the XMM–Newton data. If we assume a flare duty cycle of 13%, the flare X-ray luminosity has to be Log5.39 to be consistent with our non detection.
LP 944–20 is a relatively inactive object. Tinney (1998) reported Hα weakly in emission. Berger et al. (2001) estimated a surface magnetic field strength of B5G assuming synchrotron emission during the radio flares. For comparison, active dM stars have magnetic field strengths of a few kG, solar flares have B100G, and Jupiter has an average B10G (Hide & Stannard, 1976). Our low upper limit on the quiescent X-ray emission of LP 944–20 is consistent with a weak magnetic field. The detection of low-amplitude photometric variability in LP 944–20, and the low-level of X-ray emission in this object, suggests the presence of surface thermal inhomogeneities due to nonmagnetic clouds, as discussed by Tinney & Tolley (1999) for LP 944–20 and by Martín, Zapatero Osorio, & Lehto (2001) for the M9.5 dwarf BRI0021-0214. Recent theoretical works (Gelino et al., 2002; Mohanty et al., 2002) show that in ultracool dwarfs there should not be much interaction between the gas and the magnetic field because the Reynolds number is very low throughout the photosphere.
LP 944–20 appears to be an object with substellar mass, weak magnetic field, fast rotation and cloudy atmosphere. We speculate that the radio activity may be enhanced by the presence of a close planetary-mass companion (Io-type), which provides a continuous supply of ionized particles to the ionosphere of LP 944–20. Radial velocity variability has been detected by Guenther & Wuchterl (2003) which could be due to a planetary-mass close companion, but they did not have enough data to derive an orbital period.
References
- Berger et al. (2001) Berger, E., Ball, S., Becker, K. M., Clarkes, M., et al. 2001, Nature 410, 338
- Feigelson et al. (2002) Feigelson, E. D., Broos, P., Gaffney, J. A., Garmier, G., Hillenbrand, L. A., Pravdo, S. H., Townsley, L., & Tsuboi, Y. 2002, ApJ574, 258
- Fleming et al. (1993) Fleming, T. A., Giampapa, M. S., Schmitt, J. H. M. M., & Bookbinder, J. A. 1993, ApJ410, 387
- Fleming, Schmitt, & Giampapa (1995) Fleming, T. A., Schmitt, J. H. M. M., & Giampapa, M. S. 1995, ApJ450, 401
- Fleming et al. (2000) Fleming, T. A., Giampapa, M. S., Schmitt, J. H. M. M. 2000, ApJ533, 372
- Gelino et al. (2002) Gelino, C. R., Marley, M. S., Holtzman, J. A., Ackerman, A. S., & Lodders, K. 2002, astroph-005305
- Giampapa et al. (1996) Giampapa, M. S., Rosner, R., Kashyaf, V., Fleming, T. A., Schmitt, J. H. M. M., & Bookbinder, J. A. 1996, ApJ463, 707
- Guenther & Wuchterl (2003) Guenther, E. & G. Wuchterl 2003, in IAU Symposium 211: Brown Dwarfs, E. L. Martín (ed.), in press
- Hide & Stannard (1976) Hide, R. & Stannard, D. 1976, in Jupiter, T. Gehrels (ed.), The University of Arizona Press, Tucson
- Luyten & Kowal (1975) Luyten, W. J., & Kowal, C. T. 1975, Proper Motion Survey with the 48 inch Schmidt Telescope. XLIII. One Hundred and Six Faint Stars with Large Proper Motion (University of Minnesota, Minneapolis).
- Magazzù, Martín, & Rebolo (1993) Magazzù, A., Martín, E. L., & Rebolo, R. 1993 ApJ, 404, L17
- Marino, Micela & Peres (2000) Marino, A., Micela, G., & Peres, G. 2000, A&A353, 177
- Martín, Zapatero Osorio, & Lehto (2001) Martín, E. L., Zapatero Osorio, M. R. & Lehto, H. 2001, ApJ, 557, 822
- Mohanty et al. (2002) Mohanty, S., Basri, G., Shu, F., Allard, F., & Chabrier, G. 2002, ApJ, 571, 469
- Mokler & Stelzer (2002) Mokler, F., & Stelzer, B. 2002, A&A, in press
- Neuhäuser et al. (1999) Neuhäuser, R., et al. 1999, A&A, 343, 883
- Rutledge et al. (2000) Rutledge, R. E., Basri, G., Martín, E. L, Bildsten, L., 2000, ApJ, 538L, 141
- Schmitt & Liefke (2002) Schmitt, J. H. M. M. & Liefke, C. 2002, A&A, 382, L9
- Tinney (1996) Tinney, C. G. 1996, MNRAS. 281, 644
- Tinney (1998) Tinney, C. G. 1998, MNRAS. 296, L42
- Tinney & Tolley (1999) Tinney, C. G. & Tolley 1999, MNRAS. 304, 119
- XMM–Newton User’s Handbook (2000) XMM–Newton SOC Team, XMM–Newton User’s Handbook Issue 2, 03.31.2000
| Instrument | Counts/pixel (average) | Standart deviation (counts/pixel) | (counts/pixel/s) |
|---|---|---|---|
| EPIC PN | |||
| EPIC MOS1 | |||
| EPIC MOS2 |
| Model | Associated Feature |
|---|---|
| Black Body | keV |
| Power Law | |
| Thermal Plasma |
References. — Rutledge et al. (2000)
| Model | Flux ( ) | ( ) | |
|---|---|---|---|
| Black Body | |||
| Power Law | |||
| Thermal Plasma |
References. — Tinney (1996) for