01 \Year2002 \Month10 \Pagespan223227 \lhead[0]D. M. Alexander et al.: The 2 Ms Chandra Deep Field-North Survey \rhead[Astron. Nachr./AN XXX (200X) X]0 \headnoteAstron. Nachr./AN 32X (200X) X, XXX–XXX
Resolving the Source Populations that Contribute to the X-ray Background: The 2 Ms Chandra Deep Field-North Survey
Abstract
With 2 Ms of exposure, the Chandra Deep Field-North (CDF-N) survey provides the deepest view of the Universe in the 0.5–8.0 keV band. Five hundred and three (503) X-ray sources are detected down to on-axis 0.5–2.0 keV and 2–8 keV flux limits of erg cm-2 s-1 and erg cm-2 s-1, respectively. These flux limits correspond to erg s-1 at 1 and erg s-1 at 6; thus this survey is sensitive enough to detect starburst galaxies out to moderate redshift and Seyfert galaxies out to high redshift. We present the X-ray observations, describe the broad diversity of X-ray selected sources, and review the prospects for deeper exposures.
keywords:
surveys — cosmology — X-rays: active galaxies — X-rays: galaxiesdavo@astro.psu.edu
1 Introduction
One of the driving goals behind the construction of the Chandra X-ray Observatory (hereafter Chandra; Weisskopf et al. 2000) was to perform the deepest possible X-ray studies of the Universe. Great advances in this direction have been made with the completion of two 1 Ms surveys [the Chandra Deep Field-North (CDF-N); Brandt et al. 2001a, and the Chandra Deep Field-South (CDF-S); Giacconi et al. 2002]. These ultra-deep Chandra surveys resolve the bulk of the 0.5–8.0 keV background, providing the deepest views of the Universe in this band (e.g., Campana et al. 2001; Cowie et al. 2002) and uncovering a broad variety of source populations (see Brandt et al. 2002 for a review).
The CDF-N was awarded a second 1 Ms of Chandra exposure in Cycle 3. Here we provide a brief overview of the 2 Ms CDF-N survey and review the prospects for deeper Chandra exposures. km s-1 Mpc-1, , and are adopted throughout.
2 Observations and Basic Source Properties
The CDF-N observations were obtained with ACIS-I (the imaging array of the Advanced CCD Imaging Spectrometer; Garmire et al. 2002). The 20 observations that comprise the full dataset were taken over a 27 month period; the total exposure time is 1.945 Ms. Each observation was centred close to the Hubble Deep Field-North (HDF-N; Williams et al. 1996); the total area of the combined observations is arcmin2. The X-ray data processing was similar to that described in Brandt et al. (2001a) for the 1 Ms Chandra exposure.
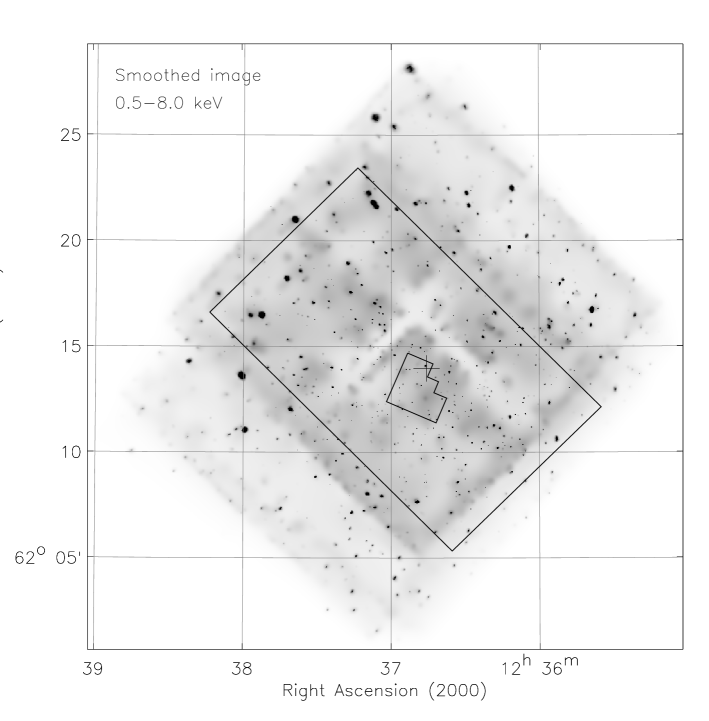
Five hundred and three (503) X-ray sources are detected with a wavdetect false-positive probability threshold of 10-7 down to on-axis 0.5–2.0 keV (soft-band) and 2–8 keV (hard-band) flux limits of erg cm-2 s-1 and erg cm-2 s-1, respectively.111We searched for X-ray sources in the full, soft, and hard X-ray bands in addition to four sub bands (0.5–1, 1–2, 2–4, and 4–8 keV). The adaptively smoothed 0.5–8.0 keV (full-band) 2 Ms Chandra image is shown in Figure 1. The 1′′ positional uncertainty for the majority of the X-ray sources allows for accurate cross-correlation to multi-wavelength counterparts.
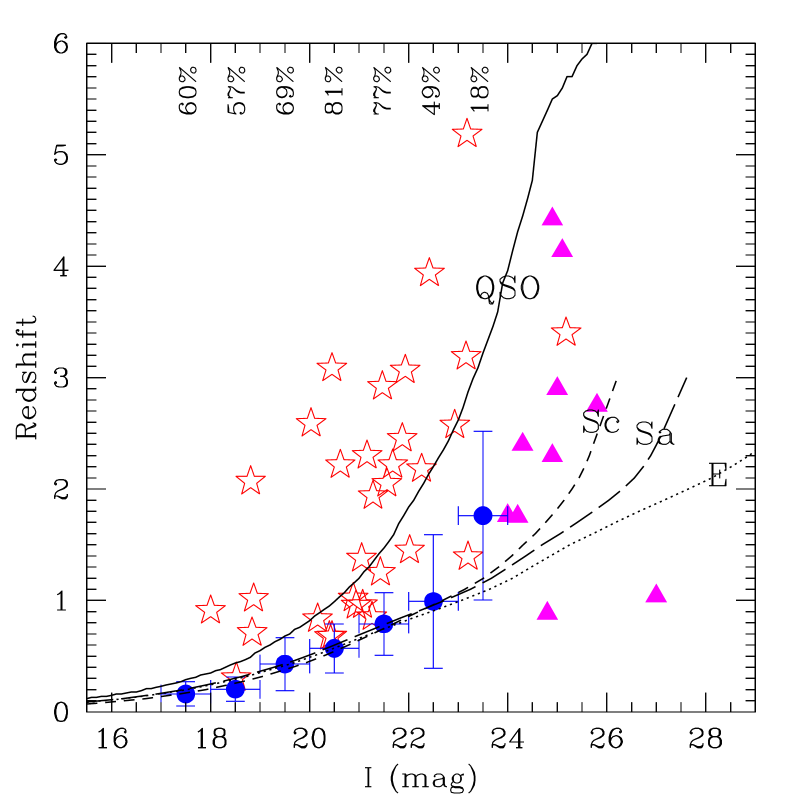
The range of optical magnitudes for the 503 X-ray detected sources is huge, spanning 13–26 (note that 10% of the sources are optically blank). Two hundred and twenty-four (224) of the sources have redshifts in the literature (e.g., Cohen et al. 2000; Barger et al. 2002), corresponding to 45% of the entire sample (see Figure 2). Broad-line AGNs (BLAGNs) are detected out to high redshift (the 5.186 AGN is the highest-redshift X-ray selected source known; Barger et al. 2002). Higher redshift AGNs may be detected; however, since Lyman- leaves the -band at , many will be optically blank (see Alexander et al. 2001 for basic constraints). On average, the non-BLAGN sources follow the redshift track expected for an galaxy (presumably the host galaxy dominates the optical emission); the statistics are poor for the 23–24 sources.
Very few X-ray sources have redshift constraints. However, assuming that they follow the same trend as found for the sources, they are likely to lie at 1–3 on average (see Alexander et al. 2001 for further discussion). Since these optically faint X-ray sources could account for 50% of the AGNs detected in deep Chandra surveys (e.g., Alexander et al. 2002c), determining their redshifts will be crucial for AGN studies. Until the advent of 30 metre-class telescopes and NGST, photometric redshifts will probably be the most practical method of redshift determination for the majority of these sources. The deep HST and ground-based observations obtained as part of the Great Observatories Origins Survey (GOODS) should make this possible for many of the X-ray sources in the CDF-N and CDF-S surveys.222See http://www.stsci.edu/science/goods/ for details on GOODS.
3 The Diversity of X-ray Selected Sources
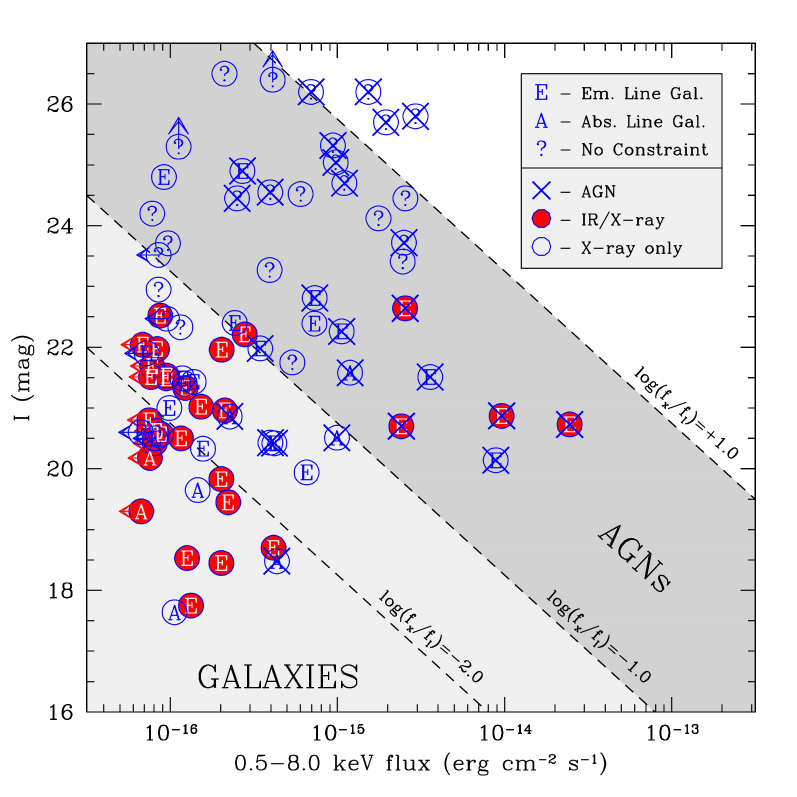
A broad variety of source populations is detected in deep Chandra surveys. Here we investigate the diversity of the X-ray selected sources by focusing on the 21.5 arcmin2 region covered by the deep 15 m ISOCAM observations of Aussel et al. (1999). In addition to the ISOCAM observations, this region contains the most sensitive X-ray and optical observations (i.e., the HDF-N; Williams et al. 1996). The -band magnitude versus full-band flux of the 72 X-ray sources detected in this region is shown in Figure 3.
3.1 AGNs
Following Alexander et al. (2002a) we identify AGNs as those sources with a “Q” (i.e., BLAGN) optical spectral classification from Cohen et al. (2000), erg s-1, or a flat effective X-ray spectral slope (i.e., , an indicator of obscured AGN activity).333All X-ray luminosities are calculated in the rest frame conservatively assuming and no intrinsic or Galactic absorption. Clearly there can be AGN-dominated sources not selected by these conserative criteria; however, the sources classified here as AGNs should be secure. The AGNs generally fall along the AGN locus defined by Maccacaro et al. (1988) from Einstein observations, even though they are 4 orders of magnitude fainter.
A broad variety of AGNs is found. Very luminous AGNs (i.e., erg s-1) such as QSOs and obscured QSOs are detected: the former are quite numerous (many of the BLAGNs in Figure 2 are QSOs), while many of the latter may be optically faint and difficult to identify (e.g., the 25.8 obscured QSO in the HDF-N; Brandt et al. 2001b). Moderately luminous AGNs such as Seyfert galaxies are detected out to high redshift. The highest redshift Seyfert galaxy identified to date is a 4.424 AGN located close to the HDF-N (Waddington et al. 1999; Brandt et al. 2001b). This source has erg s-1; see Vignali et al. (2002 and this volume) for X-ray spectral analysis of the three AGNs in the CDF-N. However, the most commonly detected AGNs are moderate-to-low luminosity sources at . These AGNs show a variety of characteristics, including sources with emission-line dominated spectra and sources with absorption-line dominated spectra (e.g., Hornschemeier et al. 2001; Brandt et al. 2001b).
X-ray spectral analysis of the X-ray brightest AGNs are presented in Bauer et al. (this volume). Amongst other things they report a diversity in the X-ray spectral properties of the AGNs and show that the classical view of BLAGNs having unobscured X-ray continua may not hold at the X-ray fluxes of this survey.
3.2 Starbursts and normal galaxies
A large number of apparently normal galaxies are detected at faint X-ray fluxes (i.e., full-band fluxes erg cm-2 s-1; Hornschemeier et al. 2001). A good indication of the nature of these sources is found by cross-correlating them with 15 m ISOCAM sources. In the 2 Ms dataset we find that 29 of the 40 ( 73%) ISOCAM galaxies in the complete ( 100 Jy) sample of Aussel et al. (in preparation) have X-ray counterparts.444The matching was performed to sources detected in any of the seven X-ray bands; 26 sources are detected in at least one of the three main bands. The majority ( 80%) of the X-ray detected 15 m sources appear to be emission-line galaxies (ELGs) without apparent AGNs; by comparison, AGNs and absorption-line galaxies comprise 15% and 5%, respectively. Of course it is possible that some of the X-ray detected ELGs contain an AGN not identified by our conservative criteria; however, their stacked-average X-ray spectral slope ( 2.0) suggests that few obscured AGNs are likely to be present. The most likely scenario is that these sources are predominantly luminous infrared starburst galaxies (e.g., Alexander et al. 2002a), a conclusion entirely consistent with analyses of the faint 15 m ISOCAM source population (e.g., Chary & Elbaz 2001).
The range of redshifts and X-ray luminosities for these sources is broad ( 0.078–1.275 and – erg s-1). While the X-ray emission from the low-redshift, low-luminosity sources could be produced by a single ultra-luminous X-ray source (e.g., Hornschemeier et al. 2002b), the majority of these sources have X-ray luminosities between those of M 82 and NGC 3256, implying moderate-to-luminous star-formation activity (i.e., 10–100 ). The two most luminous sources have X-ray luminosities 3 times greater than that of NGC 3256, the most X-ray luminous starburst galaxy known. The steep X-ray spectral slopes of these two sources ( and ) suggests that neither are obscured AGNs.
Most of the X-ray detected ELGs are also detected at radio wavelengths (Bauer et al. 2002), providing additional support for the starburst galaxy hypothesis. Indeed, the X-ray and radio luminosities of these sources are correlated and agree with those found for local starburst galaxies, suggesting that the X-ray emission can be used directly as a star-formation indicator (see also Ranalli, this volume).
4 Prospects for Deeper Chandra Exposures
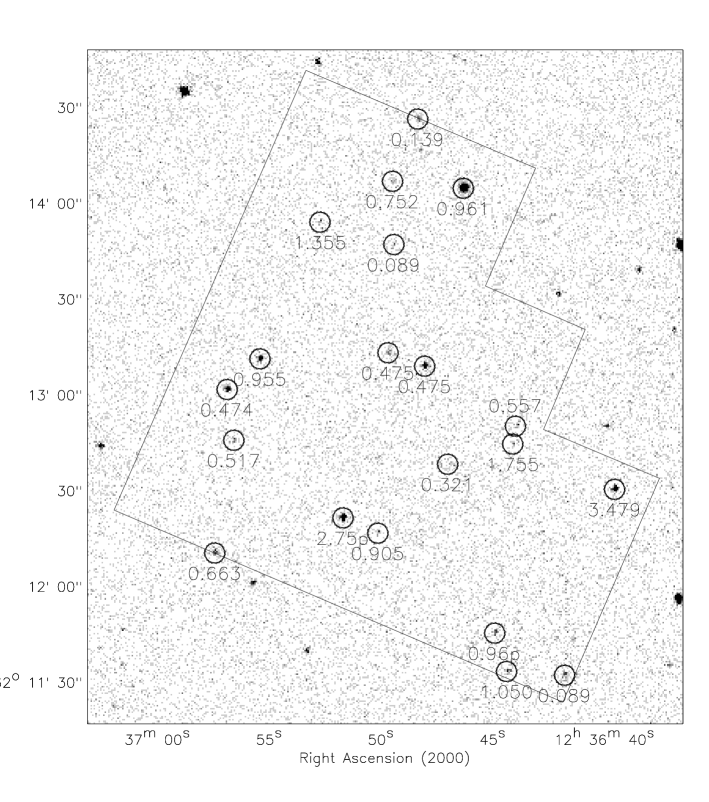
In examining the prospects for deeper Chandra exposures we first review the observations within the extremely sensitive 5.3 arcmin2 HDF-N region (e.g., Williams et al. 1996). All of the 20 X-ray sources in the HDF-N have optical counterparts down to 28 and all have spectroscopic or photometric redshifts (see Figure 4); further sources can be found by matching lower-significance Chandra sources to optically bright galaxies (e.g., Figure 5 of Brandt et al. 2002).
The density of X-ray sources in the HDF-N is 12,000 deg-2 and 6,000 deg-2 for the soft and hard bands, respectively. These are the highest source densities reported for a blank-field X-ray survey, although they are low when compared to the optical source density of the HDF-N ( 2 deg-2; e.g., Williams et al. 1996). Since the (conservative) source confusion limit for on-axis Chandra observations is 80,000 deg-2, source confusion is unlikely to start becoming a problem until significantly fainter X-ray flux limits are reached (the source confusion limit is calculated assuming 20 beams per source and a 1.5 arcsec 95% encircled energy radius). The average 2 Ms Chandra background is 0.4 counts pixel-1 in the 0.5–8.0 keV band, suggesting that Chandra should remain close to photon limited for exposures up to 5 Ms, on axis; the situation is even more favourable in the X-ray bands with lower background rates (e.g., the 0.5–2.0 keV band). Clearly deeper Chandra exposures can reach significantly deeper flux limits efficiently and be free of source confusion.
Several analyses have provided direct evidence that deeper Chandra exposures will detect a significantly larger number of sources. For instance, X-ray stacking analyses of normal galaxies have suggested that galaxies at should be detected in significant numbers with 0.5–2.0 keV fluxes of (3–6) erg cm-2 s-1 (e.g., Hornschemeier et al. 2002a).555Stacking analyses of Lyman-break galaxies and VROs/EROs have also suggested that the average source should be detectable at these fluxes (e.g., Brandt et al. 2001c; Alexander et al. 2002b). These results are bolstered by X-ray fluctuation analyses and model simulations which have implied a rise in the number counts around 0.5–2.0 keV fluxes of 7 erg cm-2 s-1 (Miyaji & Griffiths 2002; Ptak et al. 2001). A 5 Ms Chandra survey can achieve on axis 0.5–2.0 keV fluxes of 6 erg cm-2 s-1.
A 5–10 Ms Chandra exposure can reach the flux limits being discussed for the next generation of X-ray observatories such as XEUS (not to be launched for 10–15 years). Although the prime scientific focus of XEUS is X-ray spectral analysis, an ultra-deep Chandra survey can explore the likely source populations to be detected in deep XEUS surveys, and provide firm constraints on the X-ray source density.
Acknowledgements.
This work has been largely possible due to the financial support of NASA grants NAS 8-38252 and NAS 8-01128, the NSF CAREER award AST-9983783, and CXC grant G02-3187A.References
- [1] Alexander, D. M., Brandt, W.N., Hornschemeier, A.E., Garmire, G.P., Schneider, D.P., Bauer, F.E., & Griffiths, R.E.: 2001, AJ, 122, 2156
- [2] Alexander, D. M., Aussel, H., Bauer, F. E., Brandt, W. N., Hornschemeier, A. E., Vignali, C., Garmire, G. P., & Schneider, D. P.: 2002a, ApJ, 568, L85
- [3] Alexander, D. M., Vignali, C., Bauer, F.E., Brandt, W.N., Hornschemeier, A.E., Garmire, G.P., & Schneider, D.P.: 2002b, AJ, 123, 1149
- [4] Alexander, D. M., Bauer, F.E., Brandt, W.N., Hornschemeier, A.E., Vignali, C., Garmire, G.P., & Schneider, D.P.: 2002c, in New Visions of the X-ray Universe, in press (astro-ph/0202044)
- [5] Aussel, H., Cesarsky, C. J., Elbaz, D., & Starck, J. L.:1999, A&A, 342, 313
- [6] Barger, A. J., et al.: 2002, AJ, 124, 1839
- [7] Bauer, F. E., Alexander, D. M., Brandt, W. N., Hornschemeier, A. E., Vignali, C., Garmire, G. P., & Schneider, D. P.: 2002, AJ, 124, 2351
- [8] Brandt, W. N., et al.: 2001a, AJ, 122, 2810
- [9] Brandt, W. N., et al.: 2001b, AJ, 122, 1
- [10] Brandt, W. N., Hornschemeier, A.E., Schneider, D.P., Alexander, D.M., Bauer, F.E., Garmire, G.P., & Vignali, C.: 2001c, ApJ, 558, L5
- [11] Brandt, W. N., Alexander, D. M., Bauer, F. E., Hornschemeier, A. E.: 2002, Philos. Trans. R. Soc. London, A, 360, 2057
- [12] Campana, S., Moretti, A., Lazzati, D., & Tagliaferri, G.: 2001, ApJ, 560, L19
- [13] Chary, R. & Elbaz, D.: 2001, ApJ, 556, 562
- [14] Cohen, J. G., Hogg, D.W., Blandford, R., Cowie, L.L., Hu, E., Songaila, A., Shopbell, P., & Richberg, K.: 2000, ApJ, 538, 29
- [15] Cowie, L. L., Garmire, G. P., Bautz, M. W., Barger, A. J., Brandt, W. N., & Hornschemeier, A. E.: 2002, ApJ, 566, L5
- [16] Garmire, G. P., Bautz, M. W., Ford, P. G., Nousek, J. A., & Ricker, G. R.: 2002, Proc. SPIE, 4851, in press
- [17] Giacconi, R. et al.: 2002, ApJS, 139, 369
- [18] Hornschemeier, A. E., et al.: 2001, ApJ, 554, 742
- [19] Hornschemeier, A. E., Brandt, W. N., Alexander, D. M., Bauer, F. E., Garmire, G. P., Schneider, D. P., Bautz, M. W., & Chartas, G.: 2002a, ApJ, 568, 82
- [20] Hornschemeier, A. E., et al.: 2002b, AJ, submitted
- [21] Maccacaro, T., Gioia, I. M., Wolter, A., Zamorani, G., & Stocke, J. T.: 1988, ApJ, 326, 680
- [22] Miyaji, T. & Griffiths, R. E.: 2002, ApJ, 564, L5
- [23] Ptak, A. Griffiths, R., White, N., & Ghosh, P.: 2001, ApJ, 559, L91
- [24] Vignali, C., Bauer, F. E., Alexander, D. M., Brandt, W. N., Hornschemeier, A. E., Schneider, D.P., & Garmire, G.P.: 2002, ApJ, 580, L105
- [25] Waddington, I., Windhorst, R.A., Cohen, S.H., Partridge, R.B., Spinrad, H., & Stern, D.: 1999, ApJ, 526, L77
- [26] Weisskopf, M. C., Tananbaum, H.D., Van Speybroeck, L.P. & O’Dell, S.L.: 2000, Proc. SPIE, 4012, 2
- [27] Williams, R.E., et al.: 1996, AJ, 112, 1335