A simultaneous XMM-Newton and BeppoSAX observation of the archetypal Broad Line Seyfert 1 galaxy NGC 5548
Abstract
We report the spectral analysis of a long XMM-Newton observation of the well-studied, moderate luminosity Broad Line Seyfert 1 galaxy NGC 5548. The source was at an historically average brightness and we find the hard (3-10 keV) spectrum can be well fitted by a power law of photon index 1.75, together with reflection. The only feature in the hard X-ray spectrum is a narrow emission line near 6.4 keV, with an equivalent width of 60 eV. The energy and strength of this line is consistent with fluorescence from ‘neutral’ iron distant from the central continuum source. We find no evidence for a broad Fe K line, with an upper limit well below previous reports, suggesting the inner accretion disc is now absent or highly ionised. The addition of simultaneous BeppoSAX data allows the analysis to be extended to 200 keV, yielding important constraints on the total reflection. Extrapolation of the hard X-ray power law down to 0.3 keV shows a clear ‘soft excess’ below 0.7 keV. After due allowance for the effects of a complex warm absorber, measured with the XMM-Newton RGS, we find the soft excess is better described as a smooth upward curvature in the continuum flux below 2 keV. The soft excess can be modelled either by Comptonised thermal emission or by enhanced reflection from the surface of a highly ionised disc.
keywords:
galaxies: active – galaxies: Seyfert: general – galaxies: individual: NGC5548 – X-ray: galaxies1 Introduction
It is widely believed that the primary luminosity of an AGN originates in an accretion disc around a super-massive black hole. However, in the X-ray band, a hard power-law component generally dominates above 2 keV in the well studied Broad Line Seyfert 1 galaxies and is considered to arise in a hot corona above the surface of the accretion disc, where optical/UV photons from the disc are Comptonised to X-ray energies. These X-rays in turn illuminate the disc, being either ‘reflected’ towards the observer or thermalised back into optical/UV emission (Mushotzky et al. 1993). In the X-ray spectral band, evidence for this disc reflection component, in the form of a fluorescent Fe K line near 6.4 keV, an Fe K edge at keV and a Compton ‘hump’ at keV, is found in many bright Seyfert 1 galaxies (e.g. Pounds et al. 1990, Nandra & Pounds 1994). The improved resolution of ASCA has more recently been used to show that the Fe K line is often broad, with excess flux, particularly in a ‘red’ wing to the line (Tanaka et al. 1995, Nandra et al. 1997), believed due to emission from the inner disc in a region of both high velocities and high gravity (Fabian et al. 2000).
The substantial gains in sensitivity, bandwidth and spectral resolution of XMM-Newton and Chandra are now further qualifying this standard picture, with indications that the energy, breadth and strength of the broad Fe K line (the inner disc component) is critically dependent on how the underlying X-ray continuum is modelled. Also, the frequent detection of a narrow emission line at 6.4 keV, probably having a distinct origin, away from the inner disc (Reeves et al. 2001, Yaqoob et al. 2001, Kaspi et al. 2001, Matt et al. 2001, Gondoin et al. 2001, Pounds et al. 2001), now has to be accounted for in determining the profile of any broad emission line component (Pounds and Reeves 2002, Weaver and Reynolds 1998).
In this paper we report on a simultaneous XMM-Newton and BeppoSAX observation of NGC 5548, one of the brightest and best-studied, medium luminosity Broad Line Seyfert 1 galaxies. At (with km s-1 Mpc NGC 5548 has an X-ray luminosity (2–10 keV) which historically lies in the range erg s-1. The Galactic absorption column towards NGC 5548 is cm-2 (Murphy et al. 1996), rendering it easily visible over the whole (0.2–12 keV) spectral band of the EPIC and RGS detectors on XMM-Newton.
The hard X-ray spectrum of NGC 5548 obtained with the GINGA satellite (Nandra and Pounds 1994) showed the 2–18 keV spectrum to be well described by a power law of index 1.65-1.85, including a reflection factor R = /2, where is the solid angle subtended by the reflecting matter, in the range 0.5–1, with an Fe K emission line (equivalent width 110 eV at 6.4 keV) and the imprint of low energy absorption by ionised gas of equivalent hydrogen column density . Fitting a narrow line to an early ASCA observation refined the line energy to keV, with an EW of 90 eV, increasing to 170 eV for a broad line fit (Nandra et al. 1997a).
Evidence for a ‘soft excess’, whereby the X-ray spectrum below 1 keV lies above an extrapolation of the hard X-ray power law, was first implied in spectra of several AGN obtained by HEAO-1 A2 (Pravdo et al. 1981), EXOSAT (Arnaud et al. 1985; Turner & Pounds 1989) and Einstein (Bechtold et al. 1987). However, quantifying the soft excess has remained uncertain, since its determination depends on knowledge of both the power law component and the effects of overlying absorption. The physical origin of any soft excess is also generally unclear, since thermal emission from the accretion disc around a - black hole (e.g. Arnaud et al. 1985; Czerny & Elvis 1987), should be much cooler than the 100 eV soft X-ray temperatures typically inferred, without secondary heating or reprocessing of the disc photons. Understanding the origin of the disc emission, and its interaction with the ‘corona’ nevertheless remains a key to understanding the whole X-ray emission mechanism in Seyfert galaxies.
In the case of NGC 5548 an early EXOSAT observation (Branduardi-Raymont 1986) found evidence for a soft excess emerging when the 2-6 keV flux was above some average level. This conclusion gained support from an extended ROSAT observation (Done et al.1995) where the 0.2-0.7 keV flux from NGC 5548 was found to vary more strongly than that at 1-2 keV. However, in a long BeppoSAX observation in 1997, Nicastro et al. (2000) found the spectral variability in NGC 5548 was primarily due to a change in the power law slope, with no requirement for a soft excess. Other results of this BeppoSAX study were: a high energy cut-off in the range 90–165 keV; low energy absorption well-modelled by OVII and OVIII edges; an unresolved Fe K emission line and a continuum ‘hump’ around 20–30 keV consistent with reflection R 0.5 from ‘cold’ matter.
2 Observation and data reduction
NGC 5548 was observed on 2001 July 9/10 and 12 during orbits 290 and 291 in the XMM-Newton Guest Observer programme. The observations with the EPIC MOS2 (Turner et al.2001) and PN (Strüder et al.2001) detectors were of order 90 ksec in orbit 290 and 35 ksec in orbit 291, with medium and thin filters, respectively. MOS1 data were in timing mode and therefore not useful in the present analysis. The simultaneous RGS observations were of 90 ksec and 40 ksec, during orbits 290 and 291, while the BeppoSAX observation covered the period 8–10 July, overlapping the XMM-Newton longer (orbit 290) exposure.
BeppoSAX data were reduced in the standard way (Guainazzi et al.1999). MECS counts were extracted from a region of 4 arc min. radius, and the PDS spectrum was extracted using the fixed pulse rise-time threshold.
The EPIC data were first screened with the XMM SAS v5.3 software. X-ray events corresponding to patterns 0-12 for the MOS2 camera (similar to grades 0-6 in ASCA) were used; for the PN patterns 0-4 (single and double pixel events) were selected. A low energy cut of 200 eV was applied to all data and known hot or bad pixels were removed. The non X-ray background remained low until the last 5 ksec of the orbit 290 observation, which were excluded from the subsequent spectral analysis.
We extracted source and background spectra for the PN and MOS2 detectors with a circular source region of 45′′ radius defined around the centroid position of NGC 5548, with the background being taken from an offset position close to the source. The 2-10 keV X-ray flux from NGC 5548 varied between ergs cm-2 s-1 during the XMM-Newton observations, lying at the upper end (though near the mean) of the historical range; however, photon pile-up was negligible in the Small Window mode chosen for all EPIC observations. The individual spectra were binned to a minimum of 20 counts per bin, to facilitate use of the minimalisation technique in spectral fitting.
The primary analysis in this paper is based on observations from the first XMM-Newton orbit, which has the longest exposure and also benefits from simultaneous BeppoSAX data. In the present analysis we use both MOS2 and PN data to evaluate the hard X-ray spectrum, but only the MOS2 data to study the ‘soft excess’, since the MOS2 broad band calibration is considered to be more certain than that of the PN at present. Response functions for spectral fitting to the XMM-Newton data were generated from the SAS v5.3. We use the MECS and PDS data from BeppoSAX to constrain the continuum reflection and high energy cut-off.
All spectral fits include absorption due to the line-of-sight Galactic column of . All fit parameters are given in the AGN rest-frame. Errors are quoted at the 90% confidence level (e.g. for one interesting parameter).
3 The hard power law spectrum
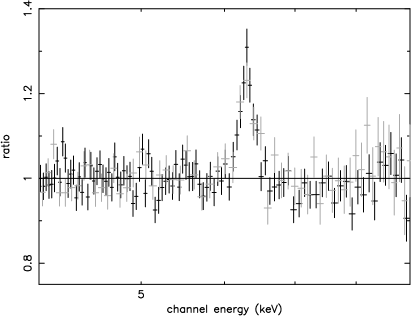
It has long been clear that the key to modelling the X-ray spectra of AGN is to first identify, if possible, the ‘underlying continuum’ on which additional emission and absorption features are superimposed. We therefore began our analysis of NGC 5548 by fitting the XMM-Newton data above 3 keV, where any effects of intervening absorption should be negligible, a view supported by the RGS analysis of the warm absorber (Steenbrugge et al. 2003). A power law gave a good fit to both MOS2 and PN data over the 3-10 keV band apart from a clear excess flux near 6.4 keV. The respective parameters are listed in fit 1 of Tables 1 and 2. The power law index was flatter by 0.02 in the PN fit, a difference that is now only marginally significant and suggests an encouraging convergence in the latest calibrations of the EPIC cameras. Figure 1 reproduces the data:model ratio of the MOS2 and PN power law fits. No other features are seen in addition to the narrow emission line at 6.4 keV.
3.1 The Fe K band
The addition of a narrow Gaussian emission line to the simple power law fits, with energy, width and flux free, produced a very significant improvement to both MOS2 and PN spectral fits. These improved fits are detailed in fit 2 of Tables 1 and 2, respectively. Inclusion of the emission line in the 3–10 keV fits increased the power law index by 0.03 for each data set. The line is narrow and lies at a rest energy consistent with fluorescence from neutral iron. More specifically, the upper limit of 6.41 keV in both MOS2 and PN fits, corresponds to ion stages between FeI and FeX, while it is interesting to note that the high statistical significance of the EPIC data gives a line width with similar formal precision to that reported from an earlier observation with the Chandra HETG (Yaqoob et al. 2001). We return to this point in the Discussion (section 5).
The formal 3 upper limit for an additional broad line, modelled as a ‘diskline’ (Fabian et al. 1989) with energy and profile as reported from an ASCA observation (Nandra et al. 1997) is 43 eV. In contrast, the ASCA analysis, which recorded a power law index and flux almost identical to the present observation, found a broad line equivalent width of 20090 eV.
3.2 Cold reflection
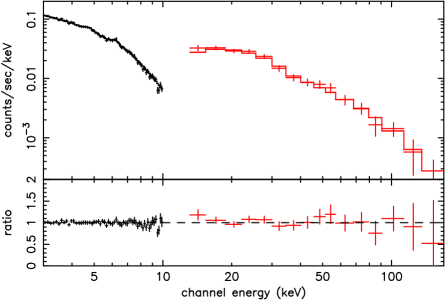
An important limitation in XMM-Newton data is a rapid loss of sensitivity above 10 keV, preventing the unambiguous determination of continuum reflection, which is in general required to determine the true slope of the primary (power law) continuum. Fortunately we have simultaneous BeppoSAX data on NGC 5548 for the longer, orbit 290 observation, which extends the spectral coverage to 200 keV and constrains the continuum ‘hump’ caused by down-scattering of high energy photons and is a key measure of reflection. We first compared the MOS2, PN and MECS data, finding good agreement in describing the NGC 5548 spectrum over the band 3–10 keV. The PDS and MECS data were then combined, and tested against a model with components of a cut-off power law, a narrow Fe K line and cold reflection modelled by PEXRAV. All fit parameters were tied for the 2 detectors, with an additional normalisation constant of 0.86 for the PDS (Fiore et al.1999). An excellent fit (figure 2) yielded a cold reflection factor R 0.7 which, in turn, led to a steepening of the powerlaw index by 0.05. Addition of the MOS2 data, with again only the normalisation untied, confirmed the excellence of this fit, details of which are listed in Table 1, fit 3. The parameters of the reflection fit were found to be only a weak function of the assumed iron abundance. In the best fit, quoted, the abundance was left free and determined to be solar. The cosine of the disc inclination was fixed at 0.9. The PN, MECS and PDS data were next fitted with the above model, yielding the parameters detailed in Table 2, fit 3.
In summary, an overall and self-consistent description of the 3–200 keV spectrum consists of a cut-off power law and cold reflection at a level that could also explain the narrow Fe K emission line (not included in PEXRAV). The observed 3–100 keV flux was ergs cm -2 s-1.
| Fit | Fe K line | Reflection component | /dof | ||||
|---|---|---|---|---|---|---|---|
| Ea | EWc | E | Re | ||||
| 1. P-L only | 1.670.02 | 426/399 | |||||
| 2. P-L + Gauss | 1.700.02 | 6.390.02 | 4040 | 6318 | 354/396 | ||
| 3. P-L + Gauss + Pexrav | 1.750.02 | 6.390.02 | 4545 | 6318 | 24090 | 0.750.19 | 408/467 |
| Fit | Fe K line | Reflection component | /dof | ||||
|---|---|---|---|---|---|---|---|
| Ea | EWc | E | Re | ||||
| 1. P-L only | 1.650.01 | 1511/1353 | |||||
| 2. P-L + Gauss | 1.680.01 | 6.400.01 | 6424 | 6714 | 1347/1350 | ||
| 3. P-L + Gauss + Pexrav | 1.730.02 | 6.390.02 | 6024 | 6018 | 275100 | 0.580.15 | 1440/1465 |
| Fit | xid | /dof | ||||
|---|---|---|---|---|---|---|
| 1. PL+2bbody | 1.760.03 | 1308 | 36519 | 551/566 | ||
| 2. PL+compTT | 1.750.03 | 40060 | 164 | 581/569 | ||
| 3. PL+DBf | 1.750.02 | 4.10.2 | 586/569 |
4 The Soft Excess
Extrapolating the best-fit description of the hard X-ray spectrum (fit 3 in Table 1) to the lower well-calibrated limit of the EPIC MOS camera ( 0.3 keV) shows an apparently unambiguous excess of soft X-ray flux below keV (figure 3). There is also clear evidence for absorption which ‘cuts’ a significant fraction from any smooth profile continuum between 0.7-2 keV, a factor that appears to be common in the EPIC spectra of low and medium luminosity AGN and must be accounted for before attempting to model any soft excess emission (Pounds and Reeves 2002). In the present case the simultaneous XMM-Newton RGS data (Steenbrugge et al. 2003), confirm the presence of complex absorption and associate it with an ionised outflow. We have worked with colleagues at SRON to assess joint fits to the EPIC and RGS data for NGC 5548 (see Figure 4). Our conclusions, are that the data are in good overall agreement, though the RGS data are relatively insensitive to the precise continuum shape, which in the joint fit is effectively determined by the EPIC data. For the present EPIC analysis a simpler description of the warm absorber was used, with advantages in terms of modelling speed and in being a better match to the resolution of the EPIC detectors. This working description of the warm absorber is in terms of a series of absorption edges at (rest frame) 0.725 keV ( 0.29) , 0.87 keV (0.28), 1.23 keV (0.08), and 1.78 keV (0.06). The energy and optical depth of these edges were left free in fitting to the EPIC data, and correspond approximately to the absorption edges of O VII, O VIII, Ne IX/X and Mg XI/XII. Visual comparison of figures 4 and 5 indicates why the absorption edge set is a reasonable substitute for the complex RGS absorption spectrum at the resolution level of the EPIC detectors. We note the two deepest edges, are consistent with the main features found in ROSAT and ASCA modelling, and account for the strongest absorption, from O VII, O VIII and iron M- and L-shell ions, while Ne K-shell absorption is also clearly seen.
Fixing the cold reflection factor and Fe K line parameters as determined from the 3-200 keV fit, we then proceeded to model the ‘soft excess’. A second power law, or a single blackbody, gave a very poor fit, the breadth of the soft excess requiring 2 blackbody components to obtain an acceptable value of chi-squared. Table 3 (fit 1) details this best-fit to the overall (0.3-10 keV) spectrum, which is reproduced in Figure 5. Parameterised in this way, the soft excess is found to be energetically a minor part of the X-ray flux from NGC 5548, the multiple blackbody component accounting for only 20% of the observed 0.3–1 keV flux of erg cm-2 s-1, 12% of the 1–2 keV flux of erg cm-2 s-1, and a negligible fraction of the harder (2–10keV) flux of erg cm-2 s-1.


4.1 Comptonised disc emission
While the addition of multiple blackbody components is a useful way to parameterise the soft excess it reveals little about the physical origin of this emission component, since - as noted earlier - the intrinsic thermal radiation of an accretion disc around a supermassive black hole is expected to be much cooler than implied by the observed soft X-ray spectrum.
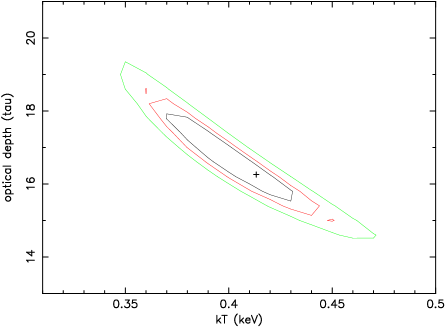
To attempt a more physical description of the spectral curvature underlying the complex absorption, we therefore replaced the blackbody components with Comptonised thermal disc emission, a model successfully used to describe XMM-Newton detections of strong soft excesses in PKS 0558-504 (O’Brien et al. 2001) and 1H 0419-577 (Page et al. 2002), and applied to BeppoSAX data on NGC 5548 (Petrucci et al. 2000). Specifically, we used the compTT model in xspec which gave a good fit to the 0.3–10 keV MOS spectrum of NGC 5548, with parameters as detailed in Table 3, fit 2 and illustrated in Figure 6. We assumed an input photon temperature of 25 eV, and found an optically thick scattering region (16) of kT 0.4 keV. These parameters were found to be relatively insensitive to the input photon temperature over a factor of 2-3. Since they are also known to be strongly covariant we show in Figure 7 the range of acceptable values for the temperature and optical depth. We interpret the relatively low temperature of the scattering medium (compared with previous fits to the soft excess of PKS 0558-504 and 1H 0419-577) in terms of matching the less broad (less hot) soft is excess in NGC 5548. An important prediction of this fit is that soft X-ray variability would be reduced by the large optical depth (in contrast to the conclusions of Done et al.1995).
4.2 Ionised reflection
We next attempted a fit with an ionised reflector model (eg Ballantyne et al. 2001). In this model when the disc surface is highly ionised it produces a smooth excess of emission in the soft band, with relatively weak spectral features. The result was again a good fit to the soft X-ray excess, with a ionised reflection factor of R 0.6. Other details of this fit are given in Table 3, fit 3, and the model is reproduced in figure 8.
At the high ionisation parameter implied by this fit, individual spectral features are smeared out, due to the occurrence of multiple ion stages and to the effects of electron scattering in the upper layers of the reflector. This smearing is critical in fitting to our NGC 5548 observation over the 7–9 keV band where deep absorption edges of ionised Fe would otherwise be in conflict with the data.


5 Discussion
Our analysis emphasises the importance of simultaneous broad-band data to de-convolve the several inter-related components in the observed X-ray spectrum of AGN. Without such data, progress in understanding the primary emission and re-processing mechanisms will remain elusive. The key importance of measuring continuum reflection is underlined in our study of NGC 5548 where it has a significant effect on the deduced hard X-ray power law slope, which in turn is critical in quantifying any soft excess component. The impact of over-lying absorption on the emerging emission in the soft X-ray band must also be properly accounted for to determine the true soft emission spectrum.
With the above constraints in mind our analysis of the long observation of NGC 5548 on 9-10 July 2001 proceeded by first determining the amount of cold reflection using the simultaneous BeppoSAX data. The value obtained, R 0.58-0.75 for the BeppoSAX plus PN and BeppoSAX plus MOS2 fits, is compatible with the strength of the narrow Fe K line, from which one conclusion could be that the only significant reflection is from cold matter some distance from the central continuum source. That would imply that the inner accretion disc is either absent or highly ionised, a conclusion consistent with the absence of a broad Fe K line.
In the latter respect it is interesting that one description of the (relatively weak) soft excess is by enhanced reflection from highly ionised matter, presumably the inner accretion disc. However this interpretation of the soft excess is not unique, and we have no useful constraints in terms of either ionised absorption edges in the 8-9 keV region (where the XMM-Newton sensitivity is rather low) or a definite contribution to the continuum ‘hump’ at higher energies. The latter point is considered further in section 5.3.
5.1 Narrow Fe K line
The best prospect for clarifying the origin of the narrow Fe K line, with current observational facilities, appears to be via a careful search for variability with the statistical precision of XMM-Newton EPIC data, or by constraining the line width with the HETG on Chandra. A comparison of our present data with the Chandra observation of Yaqoob et al. (2001) provides a basis for such a future study in the case of NGC 5548.
Taking our PN data, which has the best statistics on the iron line, we find a line energy of keV, consistent with the Chandra line energy of keV. The line fluxes are also consistent, albeit not well constrained. Given current uncertainties in cross-calibration between the two observations, we note instead that the continuum flux was a factor of 2 lower during the Chandra observation, while the equivalent width was double the XMM-Newton value ( Yaqoob et al. 2000 find eV, compared with our XMM-Newton figure of eV), suggesting that the bulk of the narrow line may have remained constant over the 17-month interval between the Chandra and XMM-Newton observations.
However, we also note that the PN data marginally resolve the ‘narrow’ line, with = eV ( km s-1 FWHM). The comparable Chandra HETG parameters were 4500 km s-1 FWHM. Effectively the much better statistics of the XMM-Newton detection are compensating for the fourfold worse energy resolution, lending some support to the conclusion that the ‘narrow’ Fe K line in NGC 5548 is marginally resolved. If confirmed, the implication of this result is that a significant component of the ‘narrow’ Fe K line arises at distances from the hard X-ray source comparable to the Broad Line clouds.
5.2 Soft Excess
Having obtained a reliable measure of the dominant power law component, extrapolation to the lower useful energy limit of EPIC confirms the presence of a ‘soft excess’. Given the simultaneous measure of the ‘warm absorber’ by the XMM-Newton RGS we feel confident that - in this case - the soft excess is reliably determined. We find it to be characterised by a smooth upward curvature, probably typical of unobscured, radio-quiet AGN (Pounds and Reeves 2002), which can be parameterised by blackbody emitters of and keV.
An explanation of the soft excess remains unclear, however. Two physical models, which we find to be equally good fits to the EPIC data, have different inferences for the X-ray emission process. Ionised reflection is an attractive explanation, given the energetically dominant and relatively hard power law spectral component in NGC 5548. This implies that in NGC 5548 - which we point out may be an archetypal Broad Line Seyfert 1 galaxy - the X-ray emission is primarily due to accretion energy being deposited in a low density, high temperature medium (eg a ‘corona’), and there is little or no intrinsic X-ray emission from the accretion disc.
On the other hand, if the soft excess arises by thermal disc emission, upscattered into the soft X-ray band by passage through an optically thick, hot ‘skin’ (eg Hubeny et al. 2001), it offers the important possibility of studying the thermal structure and internal heating of the inner disc. Some support is provided for the Comptonisation model by the finding of a time lag between EUV and X-ray flux variations from NGC 5548 in simultaneous observations with ASCA, RXTE and EUVE (Chiang et al. 2000).
In principle it should be possible to distinguish between the above two models in the higher energy spectral band where the ionised reflector will continue to make a contribution. We have attempted this comparison by extending the Comptonised thermal and ionised reflector fits to 100 keV by inclusion of the PDS data. The power law index was fixed in each case at the MOS2 fit value of =1.75, and the warm absorber and Fe K emission line parameters were also retained from the 0.3-10 keV fits. Good fits were obtained with both models, which yielded interesting (but not decisive) differences in 10-100 keV band. The Comptonised thermal description of the soft excess (/dof = 576/590) has essentially no effect in the higher energy band (Figure 9), with all the continuum ’hump’ being due to the cold reflector. In the case of the ionised reflector fit (only marginally worse with /dof = 593/590), there is a contribution across the whole observed band (Figure 10). In consequence, the Fe abundance in PEXRAV drops from 1.3 to 0.3 to compensate for the ’filling in’ of the observed flux at 7-15 keV. In addition the high energy cut-off energy of 150 keV in the Comptonisation fit extends beyond 300 keV in the ionised disc fit. We conclude that, in the present case, our high energy data are unable to distinguish between the two models for the (relatively weak) soft excess.


5.3 The X-ray signature of NGC 5548, a low accretion rate AGN
The average observed flux in the 2–10 keV band during orbit 290 was erg s-1 cm-2, corresponding to a luminosity of erg s-1. The bolometric luminosity is then likely to be of order erg s-1. Assuming a black hole mass for NGC 5548 of (Ferrarese et al. 2001) this luminosity requires an accretion rate of 4 percent of the Eddington rate. We suggest this may be a typical value for many Broad Line Seyfert 1 galaxies.
The corresponding X-ray signature of Broad Line Seyfert 1s might then be much as we find for NGC 5548, namely a dominant power law component with (hard) photon index 1.75, a weak but relatively ‘hot’ soft excess, and a narrow, ‘cold’ Fe K emission line. The most clear cut reflection component, dominating the 10-100 keV spectrum of NGC 5548, appears also to be from cold (perhaps the same) matter subtending 1-1.5 steradian. The emergence of a similar value in Compton-thick Seyfert 2 galaxies (Matt 2002, Schurch 2002) suggests that substantial reflection from cold matter, distant from the hard X-ray source, is a common property of all Seyfert galaxies. If so, this underlines the importance of taking due account of such reflection in any analysis or modelling of AGN spectra.
The absence of a broad iron K line is consistent with the inner accretion disc being highly ionised by the relatively hard incident spectrum, or simply absent at the low implied accretion rate. We note that the former explanation would be qualitatively consistent with one of the two physical models fitted to the soft excess, with magnetic flares providing the localised source(s) of hard X-ray flux.
In the context of the alternative, thermal Comptonisation description of the soft excess, it is interesting to recall that EXOSAT data showed that the ‘soft excess’ in NGC 5548 was only apparent when the source flux exceeded erg s-1 cm-2 (Branduardi-Raymont et al. 1986), as it is here. We note that a flux-related ‘switching on’ of the disc X-ray emission in AGN could be a further analogy with the X-ray properties of Galactic black hole candidate sources, which are found to change from a faint/hard state when the accretion rate rises above a few percent of the Eddington rate (eg Chen et al. 1995). A common physical explanation might then be sought in terms of the well known radiation pressure instability (Shapiro et al. 1976), with re-structuring the inner disc leading to Comptonisation of the thermal disc photons at a relative accretion rate of a few percent (Kubota et al. 2001, Done 2002).
A truncated disc provides the most obvious alternative (to the highly ionised inner disc), consistent with the X-ray signature of NGC 5548, namely hard power law spectrum, moderate luminosity, weak soft excess, and absence of a broad iron K line. In this scenario the inner radius of the dense matter should penetrate further into a hot inner flow as the accretion rate increased, perhaps giving a more gradual spectral change.
Future studies of the broad band spectral variability of sources such as NGC 5548 will be important to search for such effects, as will the testing of models over a wider sample of AGN, with a larger range of spectral properties.
6 Conclusions
(1) A long XMM-Newton and BeppoSAX observation of the bright broad line Seyfert 1 galaxy finds a broad-band X-ray spectrum dominated by a hard power law of index 1.75, a value derived after due allowance for a continuum reflection component peaking at 30-40keV.
(2) The continuum reflection corresponds to cold (neutral) matter subtending a solid angle of 1-1.5 steradian at the hard X-ray source. We suggest this may be a very common component in the nuclei of Seyfert galaxies.
(3) The only spectral feature seen in the 3-10 keV spectrum is a narrow emission line at 6.4 keV with an equivalent width of 60 eV, consistent with iron fluorescence from the same cold matter. The lack of variability over a 17 month interval between Chandra and XMM-Newton observations is consistent with this matter being in the putative torus; however, the marginally resolved line width suggests a significant component lies at a smaller radius.
(4) A weak soft excess is seen, after allowing for over-lying absorption, as a smooth upward curvature in the X-ray continuum below 2 keV, and can be modelled by 2 blackbodies, Comptonised thermal emission from the accretion disc, or ionised disc reflection.
(5) The overall X-ray emission spectrum is consistent with a model in which accretion at a relatively low rate (a few percent of the Eddington rate) is depositing most of the corresponding accretion energy in a hot, low density medium (or corona), with the dense inner disc being absent (a truncated disc) or highly ionised.
(6) The 3 upper limit of 43 eV on a broad iron K line confirms the inner disc to be in a very different state from that indicated by the earlier ASCA observation, although the hard X-ray power law emission was essentially the same.
Acknowledgements
The results reported here are based primarily on observations obtained with XMM-Newton, an ESA science mission with instruments and contributions directly funded by ESA Member States and the USA (NASA). The authors wish to thank the SOC and SSC teams for organising the XMM-Newton observations and initial data reduction. RE acknowledges support from the NASA XMM-Newton grant NAG 5-10032. JNR and KLP are supported by a Leverhulme Fellowship and PPARC studentship, respectively. GM and GCP acknowledge support from ASI and MIUR under the grant cofin-00-02-36.
References
- [1] Arnaud K. et al. 1985, MNRAS, 217, 105
- [2] Ballantyne D., Ross R.R., Fabian A.C. 2001, MNRAS, 327, 10
- [3] Bechtold J., Czerny B., Elvis M., Fabianno G., Green R.F. 1987, ApJ, 314, 699
- [4] Branduardi-Raymont G. 1986, in: Physics of Accretion onto Compact Objects eds Mason K.O., Watson M.G., White N.E., Springer-Verlag
- [5] Chen X., Abramowicz M. A., Lasota J.-P., Naranan R., Yi, I. 1995, ApJL, 443, L61
- [6] Chiang J, Reynolds C.S., Blaes O.M., Nowak M.A., Murray N., Madejski G., Marshall H., Magdziarz P. 2000, ApJ, 528, 292
- [7] Czerny B., Elvis M. 1987, ApJ, 321, 305
- [8] Done C., Pounds K.A., Nandra K., Fabian A.C. 1995, MNRAS, 275, 417
- [9] Done C. 2002, Phil. Trans. R. Soc., 360, 1967
- [10] Fabian A.C., Rees M.J., Stella L., White N.E. 1989, MNRAS, 238, 729
- [11] Ferrarese L., Pogge R.W., Peterson B.M., Merritt D., Wandel A., Joseph C.L. 2001, ApJ, 555, L79
- [12] Fabian A.C., Iwasawa K., Reynolds C.S., Young A.J. 2000, PASP, 112, 1145
- [13] Fiore F., Guainazzi M., Grandi P. 1999, Cookbook for BeppoSAX spectral analysis
- [14] Gondoin P., Lumb D., Oosterbroek T., Orr A., Parmar A.N. 2001, A&A, 378, 806
- [15] Guainazzi M. et al. 1999, A&A, 346, 407
- [16] Hubeny I., Blaes O., Krolik J.H., Agol E. 2001, ApJ, 559, 680
- [17] Kaspi S. et al.. 2001, ApJ, 554, 216
- [18] Kubota A., Makashima K., Ebisawa K. 2001, ApJL, 560, L147
- [19] Matt G., Guainazzi M., Perola G.C., Fiore F., Nicastro F., Cappi M., Piro L. 2001, A&A, 377, L31
- [20] Matt G. 2002, Phil. Trans. R. Soc., 360, 2045
- [21] Murphy E.M, Lockman F.J., Laor A., Elvis M. 1996, ApJS, 105, 369
- [22] Mushotzky R.F., Done C., Pounds K.A. 1993, ARA&A, 31, 717
- [23] Nandra K., Pounds K.A. 1994, MNRAS, 268, 405
- [24] Nandra K., George I.M., Mushotzky R.F., Turner T.J., Yaqoob T. 1997, ApJ, 477, 602
- [25] Nicastro F. et al. 2000, ApJ, 536, 718
- [26] O’Brien P.T. et al. 2001, A&A, 365, L122
- [27] Page K.L., Pounds K.A., Reeves J.N., O’Brien P.T. 2002, MNRAS, 330, L1
- [28] Petrucci P.O. et al. 2000, Ap J, 540, 131
- [29] Pounds K.A., Nandra K., Stewart G.C., George I.M., Fabian A.C. 1990, Nature, 344, 132
- [30] Pounds K.A, Reeves J.N., O’Brien P.T., Page K.A., Turner M.J.L., Nayakshin S. 2001, ApJ, 559, 181
- [31] Pounds K.A, Reeves J.N. 2002, in: New Visions of the X-ray Universe in the XMM-Newton and Chandra era ed. F. Jansen, (astro-ph/0201436)
- [32] Pravdo S.H., Nugent J.J., Nousek J.A., Jensen K., Wilson A.S., Becker R.H. 1981, ApJ, 251, 501
- [33] Reeves J.N. et al. 2001, A&A, 365, L134
- [34] Shapiro S.L., Lightman A.P., Eardley D.M. 1976, ApJ, 204, 187
- [35] Steenbrugge K.C, Kaastra J.S., de Vries C.P., Edelson R.A. 2003, to be published in A&A
- [36] Struder L. et al. 2001, A&A, 365, L18
- [37] Tanaka Y. et al. 1995, Nature, 375, 659
- [38] Turner T.J., Pounds K.A. 1989, MNRAS, 240, 833
- [39] Turner M.J.L. et al. 2001, A&A, 365, L27
- [40] Weaver K., Reynolds C. 1998, ApJ, 503, L39
- [41] Yaqoob T., George I.M., Nandra K., Turner T.J., Serlemitsos P.J., Mushotzky R.F. 2001, ApJ, 546, 759