Can radiative cooling and nongravitational heating explain simultaneously the global X-ray properties of clusters and the unresolved cosmic X-ray background ?
Abstract
Using a simple analytic approach we address the question of whether radiative cooling, nongravitational heating and cooling plus heating models can simultaneously explain the observed global X-ray properties (entropy and X-ray luminosity distributions) of groups and clusters and the residual soft X-ray background (XRB) after discrete sources are removed. Within the framework of typical cold dark matter structure formation characterized by an amplitude of matter power spectrum , it is argued that while radiative cooling alone is able to marginally reproduce the entropy floor detected in the central regions of groups and clusters, it is insufficient to account for the steepening of the X-ray luminosity - temperature relation for groups and the unresolved soft XRB. A phenomenological preheating model, in which either an extra specific energy budget or an entropy floor is added to the hot gas in groups and clusters, fails in the recovery of at least one of the X-ray observed features. Finally, the soft XRB predicted by our combined model of cooling plus heating exceeds the observational upper limits by a factor of , if the model is required to reproduce the observed entropy and X-ray luminosity - temperature relationships of groups and clusters. Inclusion of the cosmic variation of metallicity and the self-absorption of the cooled gas as a result of radiative cooling in groups and clusters, or exclusion of the contribution of nearby, massive clusters to the XRB does not significantly alter the situation. If the discrepancy is not a result of the oversimplification of our analytic models, this implies that either our current understanding of the physical processes of the hot gas is still incomplete, or the normalization of the present power spectrum has been systematically overestimated. For the latter, both the X-ray properties of groups and clusters and the XRB predicted by preheating model and cooling plus heating model can be reconciled with the X-ray observations if a lower value of the normalization parameter is assumed.
1 Introduction
A substantial fraction of the baryons in the local universe exists in the form of diffuse warm-hot intergalactic medium (IGM) with temperatures of – K as a result of gravitationally driven shocks and adiabatic compression as they fall onto large-scale structures and collapsed dark halos (Cen & Ostriker 1999). In the former case, the warm IGM may escape direct detection, but measurements of the strength and power spectra of the cosmic soft X-ray background (XRB) (e.g. Soltan, Freyberg & Trümper 2001) and the Sunyaev-Zel’dovich effect (e.g. Bond et al. 2002) can set stringent constraints on its amount and distribution. For the latter, the hot IGM in virialized dark halos such as groups and clusters manifests itself as strong X-ray emission sources through thermal bremsstrahlung, which provides a powerful tool for studying not only the physical processes of the hot IGM but also the formation and evolution of groups and clusters.
While gravity and thermal pressure play potentially important roles in the overall distribution and evolution of the hot IGM in groups and clusters, the IGM also suffers from the influence of nongravitational effects such as radiative cooling, heating by supernovae and/or AGNs, nonthermal pressure, etc. In low-mass groups and the central regions of clusters, nongravitational effect may even become dominant for the evolution of IGM. Indeed, there is growing observational evidence for the presence of nongravitational effects in groups and clusters. Among many arguments, the most convincing observational facts are the significant departure of the observed X-ray luminosity () - temperature () relation of groups and clusters () from the prediction () of self-similar model (e.g. Edge & Stewart 1991; David et al. 1993; Wu, Xue & Fang 1999; Helsdon & Ponman 2000; Xue & Wu 2000 and references therein) and the entropy () excess in the central cores of groups and clusters (Ponman, Cannon & Navarro 1999; Lloyd-Davies, Ponman & Cannon 2000). Two prevailing scenarios suggested thus far, preheating and radiative cooling of the hot IGM, both of which tend to suppress the X-ray emission of the hot IGM heated by purely gravitational shocks and compression, have been shown to be indistinguishable in the explanation of the observed X-ray properties of groups and clusters (Voit & Bryan 2001b; Voit et al. 2002; Borgani et al. 2002 and references therein), although each model still has its own problem. For instance, preheating model suffers from the so-called energy crisis that an unreasonably high efficiency of energy injection into the IGM from supernovae must be required in order to bring the IGM to the energy level seen in the - and - relations of groups and clusters (Wu, Fabian & Nulsen 1998, 2000; Tozzi 2001; etc.), although energy supply by AGNs may help to reduce the discrepancy (Valageas & Silk 1999). Radiative cooling model suffers from the overcooling problem, i.e., the material that has cooled out of the hot IGM greatly exceeds the observational limits (Balogh et al. 2001). Moreover, cooling efficiency is also a major concern in the explanation of the X-ray observed properties of groups and clusters (Bower et al. 2001). Nonetheless, both (pre)heating and cooling are two natural processes during the formation of galaxies, which is justified by the measurements of the IGM enrichment at high redshifts and the stellar mass fraction () in the local universe. Indeed, it has been realized recently that only can a combination of preheating by supernovae and radiative cooling of the IGM reproduce the observed X-ray properties of groups and clusters (Voit et al. 2002; Borgani et al. 2002).
An independent and sensitive probe of the physical properties of the IGM is through study of the soft XRB. It has been shown that the XRB produced by the gravitationally heated and bound IGM in groups and clusters within the standard framework of hierarchical formation of structures vastly exceeds the upper limits set by current X-ray observations, lending further support to nongravitational heating scenario (Pen 1999; Wu, Fabian & Nulsen 2001; Bryan & Voit 2001). Yet, it is also noted that some hydrodynamical simulations have yielded a soft XRB compatible with current limits without inclusion of nongravitational heating (Croft et al. 2001; Davé et al. 2001; Phillips, Ostriker & Cen 2001). This partially reflects the difficulty in handling the complex processes of IGM evolution in groups and clusters. Essentially, an excess energy of about 1 keV/particle should be injected into the IGM in order to reduce the predicted soft XRB to a reasonable level. On the other hand, it is unlikely that radiative cooling alone is sufficient to eliminate the discrepancy (Wu et al. 2001).
The question we would like to address in this paper is: Can radiative cooling and nongravitational heating explain simultaneously the observed global X-ray properties of groups and clusters and the unresolved cosmic XRB ? Previous studies have reached the following conclusions: If one leaves the energy source problem aside, preheating model is in principle able to reproduce the observed - relation and excess entropy in the central regions of groups and clusters (e.g. Cavaliere, Menci & Tozzi 1997, 1998; Balogh et al. 1999; Tozzi & Norman 2001; Babul et al. 2002; etc.) and predict a consistent XRB with that observed (Pen 1999; Wu et al. 2001; Bryan & Voit 2001). As for radiative cooling, it has successfully accounted for the entropy floor seen in the central cores of groups and clusters (Voit & Bryan 2001b). By properly truncating the outer radii of X-ray surface brightness for groups and clusters in terms of current X-ray flux limits, one is also able to reproduce the observed steepening of the - relation of groups and clusters (Wu & Xue 2002a; Voit et al. 2002). In particular, the - relation found by hydrodynamical simulations in terms of cooling shows a good agreement with observations (e.g. Muanwong et al. 2001, 2002; Borgani et al. 2002). Consequently, it is crucial to reexamine whether or not cooling model is also sufficient enough to suppress the contribution of the IGM to the soft XRB. If the negative result of Wu et al. (2001) is confirmed, it deserves to explore the combined effect of radiative cooling plus heating by supernovae on the X-ray properties of groups and clusters and the soft XRB. Failure of all these efforts may indicate that our current picture of the physical processes of the hot IGM in groups and clusters is incomplete at some level. Throughout this paper we assume a flat cosmological model (CDM) of , and .
2 Dark halos
Dark matter distribution in a virialized halo is assumed to follow the universal density profile suggested by numerical simulations (Navarro, Frenk & White 1997; NFW)
| (1) |
where and are the characteristic density and length of the halo, respectively, and is the critical density of the universe. In order to fix the two free parameters, and , we first specify the concentration parameter for a given halo of mass through the empirical fitting formula found by numerical simulations (Bullock et al. 2001)
| (2) |
Next, we define the virial mass such that within the virial radius the mean mass density of the dark halo is times the critical density of the universe:
| (3) |
where for a flat, CDM cosmological model, , and . Finally, we determine the virial temperature using cosmic virial theorem (Bryan and Norman 1998):
| (4) |
In which we have taken the normalization factor to be . We have also tested a lower value of , and found that our results remain almost unchanged.
We use the modified PS mass function by Sheth & Tormen (1999) to describe the abundance and evolution of virialized dark halos that grow from random-phase Gaussian initial fluctuations:
| (5) |
where , , , is the mean cosmic density, is the linear over-density of perturbations that collapsed and virialized at redshift , is the linear theory variance of the mass density fluctuation in sphere of mass . We parameterize the power spectrum of fluctuation and take the fit given by Bardeen et al. (1986) for the transfer function of adiabatic CDM model . The primordial power spectrum is assumed to be the Harrison-Zel’dovich case . The mass variance for a given is simply
| (6) |
where is the Fourier representation of the window function. The amplitude in the power spectrum is determined using the rms fluctuation on an Mpc scale, . We adopt a normalization parameter of suggested by weak gravitational lensing measurements (see Refregier, Rhodes & Grith 2002 for a recent summary), and then demonstrate the influence of on the evaluation of XRB using a lower value of .
3 IGM
3.1 Global quantities
Following conventional definition, we use
| (7) |
to measure the entropy of IGM, in which and are the electron temperature and number density, respectively. The total X-ray luminosity in terms of thermal bremsstrahlung is
| (8) |
where is the number density of hydrogen, and is the cooling function which is calculated from the Raymond-Smith (1977) code. Whenever theoretical predictions are compared with observations, we work with the emission-weighted temperature
| (9) |
Furthermore, we assume that the IGM with and without cooling/preheating is always in hydrostatic equilibrium with the underlying gravitational potential of groups/clusters dominated by dark matter:
| (10) |
where is the mean molecular weight. Finally, we evaluate the total XRB intensity at frequency by integrating the X-ray emission of all halos over mass range and redshift space
| (11) |
where is the Planck constant, is the luminosity distance, and is the mass function given by equation (5).
3.2 No cooling and no heating
In the absence of radiative cooling and nongravitational heating, we assume that IGM traces dark matter
| (12) |
We solve the equation of hydrostatic equilibrium under the boundary restriction , which yields
| (13) |
where . This allows us to calculate straightforwardly the X-ray luminosity, entropy and total XRB. Our numerical computations show that these quantities are rather insensitive to the radial variation of temperature described by equation (13). Consequently, we may adopt a constant temperature instead of equation (13) in the evaluation of the global X-ray properties of groups and clusters and the XRB. It is well known that the results predicted by this so-called ‘self-similar’ model (hereafter Model I) depart remarkably from X-ray observations. Here we use this model as a reference point only.
3.3 Radiative cooling
Conservation of energy ensures that the energy loss due to bremsstrahlung emission is balanced by the decrease in the specific energy of IGM in groups/clusters:
| (14) |
where is the total number density of the IGM. Setting the cooling time to equal the age of groups/clusters, or simply the age of the universe at the redshift of the groups/clusters determines the cooling radius and the total mass of the cooled material if the IGM is assumed to follow the dark matter distribution before cooling. Following Voit & Bryan (2001b) and Wu & Xue (2002a), we can find the distribution of the remaining IGM after cooling by solving the equation of hydrostatic equilibrium under the conservation of total baryonic mass
| (15) |
and the conservation of entropy
| (16) |
where is related to through
| (17) |
Here we use superscript 0 to denote the quantities before cooling. The above two equations demonstrate that the IGM originally distributed between and before cooling is transported to a smaller region of radius after cooling. We consider an evolving metallicity model of (Model II) and a constant metallicity model of (Model III), where is the present age of the universe.
3.4 Preheating
A phenomenological treatment of (pre)heating is to raise the specific energy or entropy of the IGM in groups and clusters to a certain level regardless of whatever the energy sources would be. Usually, an energy budget of 0.1 – 3 keV/particle or an entropy of 50 – 400 keV cm2, depending on the epoch and environment of (pre)heating, is needed in order to reproduce the observed X-ray properties of groups and clusters. Here we consider two simple approaches to demonstrating the effect of (pre)heating on the X-ray properties of groups and clusters.
Model IV: We begin with the IGM distribution predicted by self-similar model (Model I), and then simply raise the specific energy of each particle in groups and clusters by a constant amount of :
| (18) |
The corresponding distribution of electron number density can be obtained by solving the equation of hydrostatic equilibrium. A critical point in such an exercise is the boundary condition. To a first approximation we may assume that the gas density at virial radius is universal, . Nevertheless, one should keep in mind that this restriction may fail for low-mass systems. Another commonly adopted, inaccurate method is to take the total gas mass fraction within to be universal . Actually, one still has no better choice of boundary condition in the determination of the gas distribution from the equation of hydrostatic equilibrium.
Model V: Instead of raising the specific energy of the IGM particles, we add a constant entropy floor to the entropy profile given by self-similar model
| (19) |
We then solve the equation of hydrostatic equilibrium to get the electron pressure distribution
| (20) |
where we have adopted the boundary condition . Note that this restriction should not be taken too literally because the equation of hydrostatic equilibrium may break down beyond .
3.5 Radiative cooling plus heating
We first work with the IGM temperature and entropy distributions, and , predicted by cooling (Model II), and then raise either the specific energy of each particle by a constant amount of (Model IV) or the entropy by a constant floor of (Model V) so that the new temperature (Model VI) and entropy profiles (Model VII) become
| (21) |
and
| (22) |
respectively. In a way similar to Models IV and V, we can find the new density profile of the IGM for our combined model of radiative cooling plus heating. Note that our heating model differs from the conventional preheating model. For the latter, the IGM is heated before cooling, while in our model we address the issue of how large an extra energy budget should still be added to the IGM after the cooled gas is removed from groups and clusters.
The parameters of the seven IGM models are summarized in Table 1.
| Model | cooling | heating | metallicity () | - | - | XRB () | XRB () |
|---|---|---|---|---|---|---|---|
| I | no | no | fail | fail | fail | fail | |
| II | yes | no | ok | fail/ok∗ | fail | fail | |
| III | yes | no | ok | fail/ok∗ | fail | fail | |
| IV | no | yes() | ok | ok | fail | ok | |
| V | no | yes() | ok | ok | fail | ok | |
| VI | yes | yes() | ok | ok | fail | ok | |
| VII | yes | yes() | ok | ok | fail | ok |
∗Acceptable if a truncated radius is properly introduced in terms of X-ray surface brightness limit.
4 Results
Our strategy is as follows: For each model listed in Table 1, we first compute the expected entropy and X-ray luminosity distributions of groups and clusters, and then compare with X-ray measurements, which constitutes a fundamental test for each of the proposed models. For the heating models (Model IV and Model V) and cooling plus heating models (Model VI and Model VII), this allows us to work out the most probable energy budget or with which the observed entropy and X-ray luminosity distributions of groups and clusters can be simultaneously accounted for. We then compute the XRB predicted by these models, and examine whether their predictions are compatible with current observational limits.
4.1 Entropy distribution
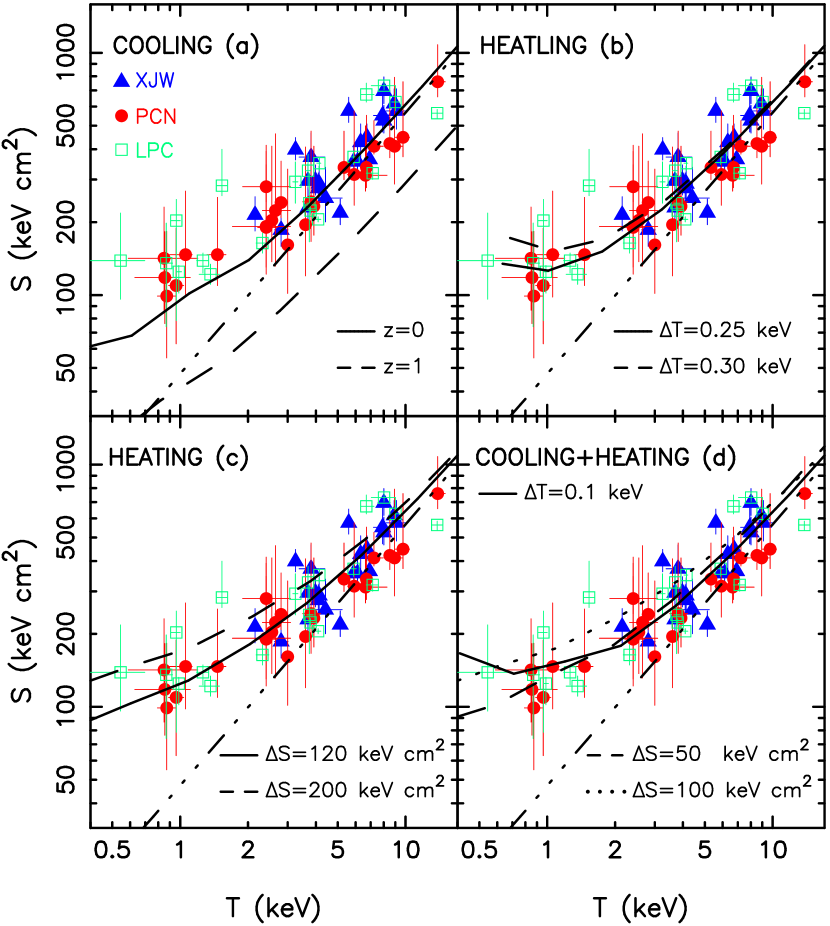
The entropy at against the emission weighted temperature predicted by all the models is shown in Figure 1, together with the updated measurements of by Ponman et al. (1999), Lloyd-Davies et al. (2000) and Xu, Jin & Wu (2001). Essentially, all models except self-similar model can roughly reproduce the overall - distributions. In the preheating model (Fig.1b and Fig.1c) and the combined model (Fig.1d) we have tested a set of energy input values and , in attempt to estimate the most probable parameters which give the closest fits of both the - distribution and the - relation (see below). In several cases we have also shown the curves for two sets of and around the best-fit values in order to demonstrate how sensitively the results depend on the input energy/entropy. While there are some differences in the predicted - relation among various IGM models and for different input or values especially below temperature keV, a decisive conclusion regarding which model provides the most satisfactory explanation of the entropy data cannot be drawn, because of sparse data points and associated large uncertainties. It is emphasized that the entropy profile expected from radiative cooling alone (Fig.1a) is consistent with observed data (Voit & Bryan 2001b), although with an additional energy supply by preheating model the predicted entropy distribution seems to yield a better fit to the data points for low-temperature systems of keV (Fig.1d).
4.2 - relation
We now compare the bolometric X-ray luminosity - temperature relations of groups and clusters predicted by different IGM models with X-ray observations. For the latter we use the catalog of X-ray groups and clusters compiled by Wu et al. (1999) and Xue & Wu (2000). The updated sample contains 57 groups and 192 clusters whose X-ray temperature and luminosity are both available. We have converted the X-ray luminosity in the Einstein-de Sitter universe into the one in the CDM cosmological model.
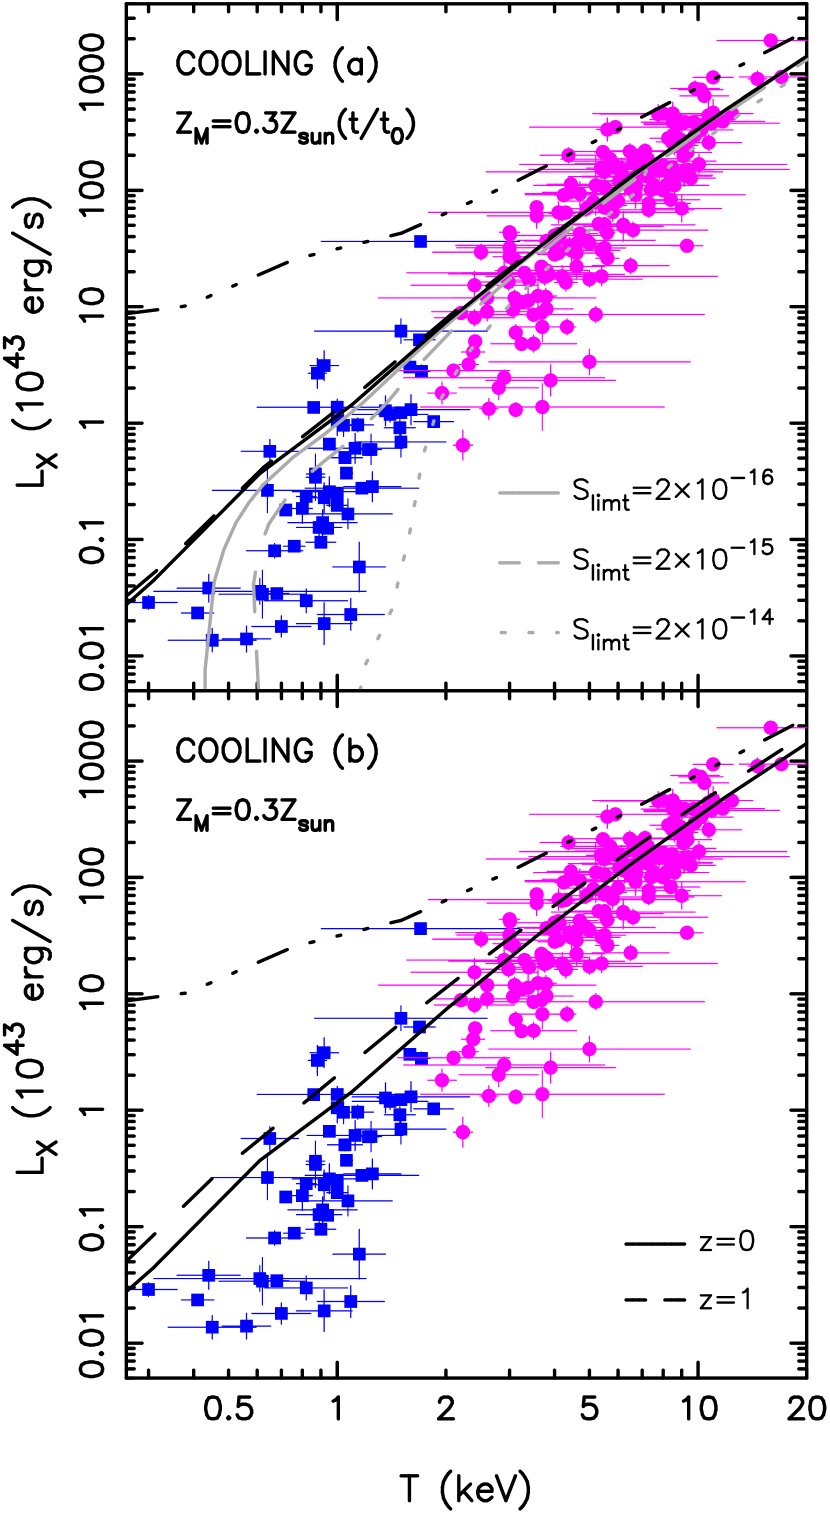
The - relations predicted by cooling models II and III are shown in Figure 2. While there is a good agreement between the predicted and observed - relations on cluster scale keV, cooling models become to be insufficient to recover the observed data at temperature below keV. One possible reason for this discrepancy may arise purely from selection effect: The theoretically predicted X-ray luminosity accounts for all emission inside virial radii of groups, while current X-ray observations have not corrected for lost flux falling out the detection aperture for majority of groups with parameters less than (e.g. Ponman et al. 1996; Helsdon & Ponman 2000). For this reason, following Wu & Xue (2002a) and Voit et al. (2002) we re-calculate the X-ray luminosity for Model II by excluding the contributions of the IGM in the outer regions of groups and clusters set by a given X-ray surface brightness limit . The expected X-ray luminosity of clusters is almost unaffected by this truncation. However, the X-ray luminosity of groups suffers seriously from this selection effect, and the resulting drops remarkably at low-temperature end. This may partially eliminate our concern about the efficiency of cooling in the explanation of - relation. Moreover, the - relations of groups and clusters with and without the inclusion of the cosmic variation of metallicity (II and III) show little evolution at least out to .
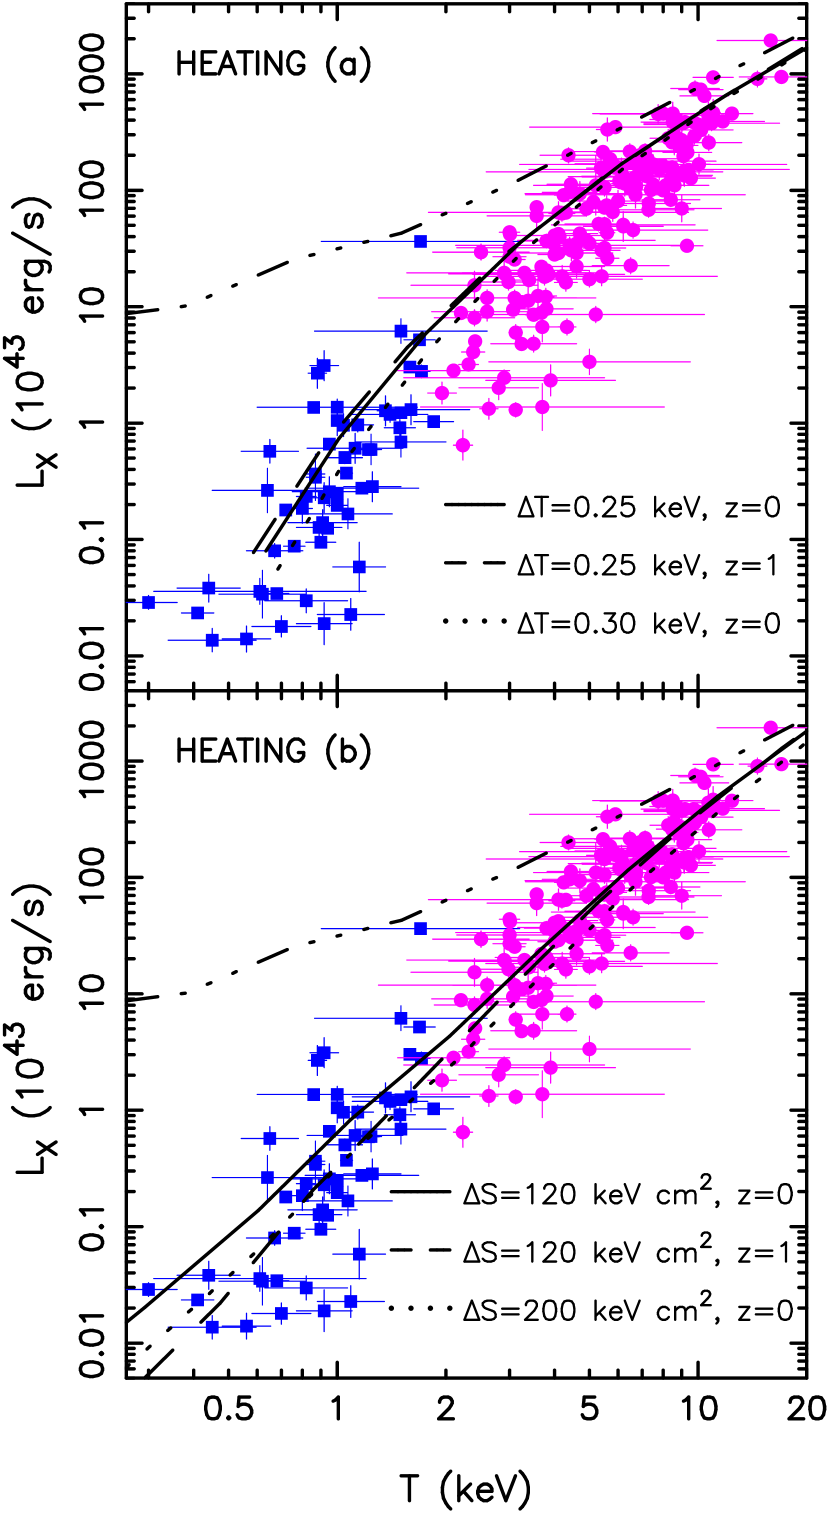
Figure 3 illustrates the - relations predicted by preheating model (IV and V). Adding an extra energy of keV to each particle in groups and clusters roughly reproduces the observed - relation. Note, however, that there is a small but significant vertical shift between our predicted and observed data in the temperature range keV (Fig.3a). We have then tried a larger value of keV, which indeed reduces somewhat the difference. A further increase of leads the entropy curve in Fig.1b to rise too high to be consistent with observations. When exceeds the virial temperature of a given group, we assume that the IGM cannot be trapped in the system. This is responsible for the cutoff of our - relation at low temperature end. For Model V, in which we have raised the entropy by a constant floor of keV cm2, the predicted - relation of clusters matches perfectly the observed one. For low-temperature groups, the agreement becomes only marginal. Increasing slightly the value of improves the match. But, it meanwhile raises the entropy distribution (Fig.1c). We have tried a value of keV cm2, and found that the entropy at low-temperature becomes too large to be reconciled with the observed data. In a word, it turns out that Model V is marginally acceptable. Alternatively, our numerical computations show that there is no apparent cosmic evolution of the predicted - relations for both Model IV and Model V, regardless of whether or not the metallicity varies with cosmic time in terms of .
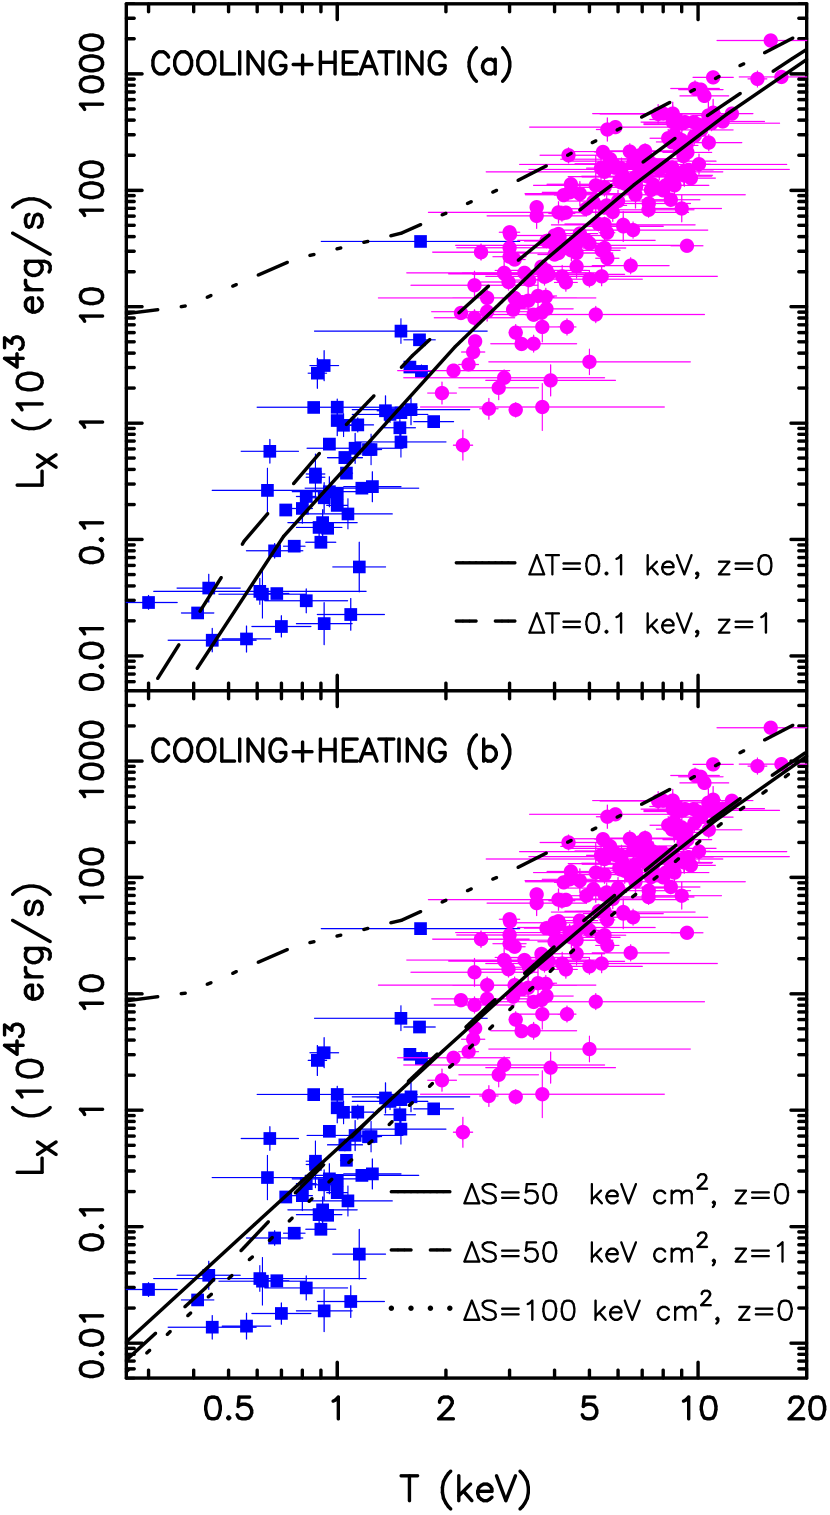
Because either cooling or preheating alone can reproduce or marginally reproduce the observed - and - relations, it is naturally expected that a combination of the two mechanisms should be successful in the explanation of the two relationships. Indeed, within the framework of radiative cooling, an additional energy input of keV in Model IV and an entropy input of keV cm2 in Model IIV both result in the X-ray luminosity and entropy distributions which agree nicely with X-ray observations (see Figure 4). We have also considered the situation of a constant metallicity of and at high redshifts out to , and found that the corresponding modifications are only minor.
4.3 XRB
A considerably large fraction of soft and hard XRB has been resolved into discrete sources (e.g. McHardy et al. 1998; Hasinger et al. 1998, 2001; Mushotzky et al. 2000; Giacconi et al. 2001, 2002; Tozzi et al. 2001; Hornschemeier et al. 2001; Rosati et al. 2002; Bauer et al. 2002; etc.). The maximum admitted ranges of the unresolved flux at different energy bands have been summarized in Wu & Xue (2001). Here we only add a new upper limit in the 2-8 keV band from the 1 Ms Chandra observation of the Chandra Deep Field North (Cowie et al. 2002): ergs s-1 cm-2 deg-2. It should be kept in mind that the diffuse X-ray emission from some of the nearby, bright galaxies, groups and clusters has also been included in the current resolved soft XRB, although the fractions of these diffuse X-ray sources in the resolved and unresolved XRB are still uncertain. In this regard, the residual soft XRB after the removal of the discrete sources may not be taken to be a very stringent upper limit on the contributions of groups and clusters.
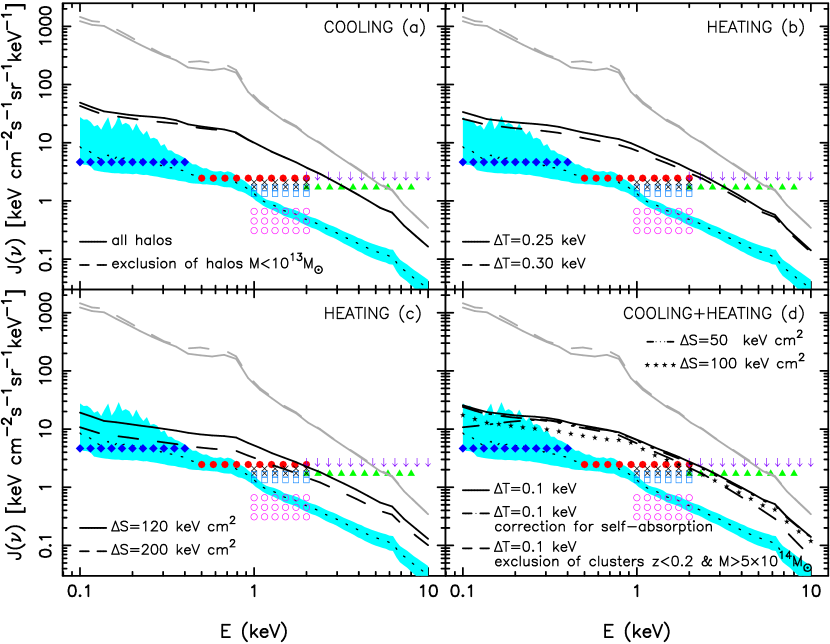
The expected XRB spectra from different IGM models in terms of Equation (11) are shown and compared with the observational upper limits in Figure 5. Meanwhile, we also demonstrate the XRB by summing up the contributions of groups and clusters described by their X-ray luminosity functions (Wu & Xue 2001). The good agreement between the XRB produced by the ‘known’ population of groups and clusters and the current limits indicates that the diffuse IGM confined in groups and clusters is probably the major source of the unresolved soft XRB. This may help to eliminate the above concern that some of the bright groups and clusters have been resolved and thus removed from the residual XRB, and the unresolved XRB may not constitute a robust constraint on the diffuse IGM of groups and clusters. Actually, nearby bright and massive clusters (e.g. and ) only make a minor contribution to the total soft XRB (Wu & Xue 2001; see also Figure 5).
It turns out from Figure 5 that the soft XRB predicted by the self-similar model (Model I) vastly exceeds the observational limits (Pen 1999; Wu et al. 2001). The huge difference of up to two orders of magnitude at keV implies that the IGM should have a much shallower distribution than dark matter especially in low-mass systems. Preheating was thus advocated as a potentially important mechanism to break the similarity between dark matter and IGM.
We first begin with the radiative cooling scenario. The predicted XRB remains almost unchanged if a constant metallicity of (Model III) is replaced by a time-varying quantity of (Model II). Actually, our numerical computations show that this conclusion applies to all the models in Table 1. In the hard energy band keV, the XRB produced by groups and clusters within the framework of cooling is well below the observational limits. By contrast, in the soft energy band - keV the cooling results are about 2–4 times larger than the current upper limits placed on contribution from diffuse IGM to the XRB. This is consistent with previous findings by Wu et al. (2001) based on N-body simulations of halo merger trees coupled with semi-analytic models. We have also studied the contributions of different halos to the total XRB, and found that most of the soft XRB is produced by groups of mass . Note that very low-mass halos make almost no contribution to the XRB because they contain very little hot IGM due to their too short cooling time (see Fig.5a). It appears that although cooling provides a more or less reasonable explanation of the X-ray luminosity and entropy distributions, it is insufficient (by a factor of 2–4) to account for the unresolved soft XRB.
We now turn to preheating model. For Model IV, in which the specific energy of each particle in groups and clusters is raised by a constant amount of keV, we have successfully recovered the observed - relation (see Fig.1b) and roughly reproduced the - relation (see Fig.3). Our expected XRB from this model is shown in Fig.5b. Unfortunately, we reach a result very similar to the cooling prediction discussed above: Model IV fails to efficiently suppress the X-ray emission of groups and clusters to a level below the unresolved XRB, and the difference in the soft energy band - keV is approximately by a factor of 2–4.
For another preheating model V, in which we have raised the entropy of IGM by a constant floor instead of for Model IV, we present the XRB in Figure 5c for two choices of , 120 and 200 keV cm2, respectively. The former nicely reproduces the entropy distribution but only marginally explains the - relation, while the latter turns to be successful in the recovery of the - relation but results in an overestimate of the entropy distribution. Now, in terms of their predicted XRB spectra alone, the model with keV cm2 becomes acceptable, while the entropy level of keV cm2 is not sufficiently large to reduce the XRB to the observational limits. This is roughly consistent with simulation results that an entropy floor of keV cm2 is needed to suppress the expected unresolved X-ray background below the observational limits (Voit & Bryan 2001a).
Finally, we come to the cooling plus heating model. Adding an energy budget of keV to each particle in addition to radiative cooling (Model VI) has allowed us to reproduce remarkably well the entropy and X-ray luminosity distributions of groups and clusters, as are shown in Fig.1d and Fig.4. The XRB predicted from this model is consistent with the observational constraints above keV (see Fig.5d). Nonetheless, the theoretical prediction becomes to be larger than the observational limits by a factor of 2–3 in the energy range from 0.1 to 1 keV. Because of the apparent success of Model VI in the explanation of the X-ray properties of groups and clusters, it deserves further investigation of whether this disagreement arises from other effects. First, we exclude the contribution of nearby () and massive () clusters to the XRB, in the sense that these bright, diffuse X-ray sources may have been resolved by current deep X-ray observations. This leads to a moderate decrease of the expected XRB in high energy band but has only a minor effect on the soft XRB. Second, we attempt to include the absorption of X-ray emission by the neutral hydrogen in groups and clusters as a consequence of radiative cooling. To this end, we assume a simple King model for the density distribution of the cooled material, in which we take the core size to be . Moreover, we normalize this density profile using the total mass of the cooled IGM given by cooling scenario, Equation (14). The total X-ray luminosity at frequency with self-absorption for a given halo reads
| (23) | |||||
where is the effective absorption cross-section, is the hydrogen column density, and
| (24) | |||||
in which is the central number density of neutral hydrogen, and are in units of Mpc. We adopt the fitting formula of Morrison & McCammon (1983) to calculate . The XRB with the correction for hydrogen absorption is shown in Figure 5d. It appears that the inclusion of self-absorption results in a significant decrease of the XRB below keV, while the rest XRB at keV remains almost unchanged.
As for Model VII, the fact that the - relation at the low temperature slightly exceeds the observed data (see Fig.3), despite the excellent agreement between the model-predicted entropy distribution for – keV cm2 and the observations, indicates that the expected XRB at soft energy band will exhibit an excess relative to the observational limits. Indeed, although raising the extra entropy floor to keV cm2 leads to a decrease of the expected XRB relative to the cooling model prediction, in the low energy range keV the prediction by model VII and observation limits still differ by a factor of .
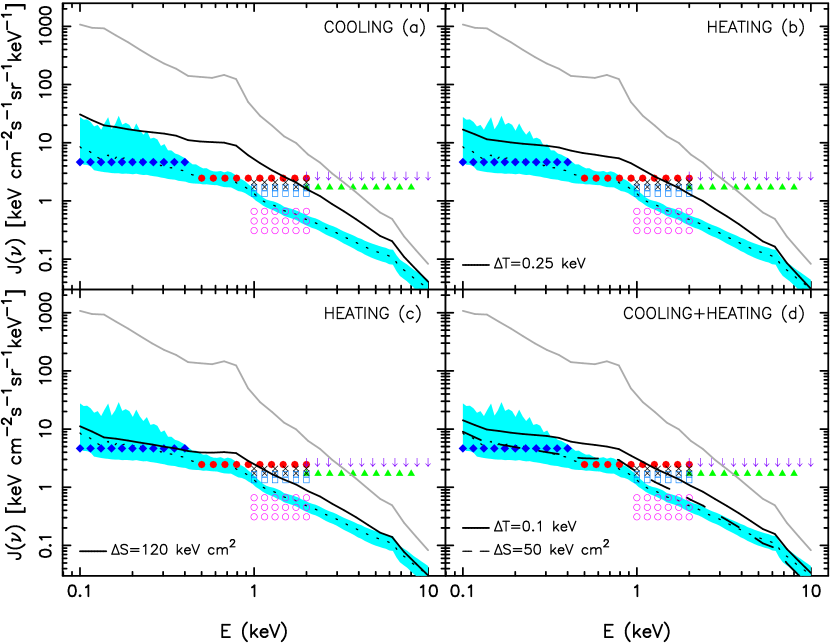
We notice, however, that the XRB spectra predicted by cooling, preheating and cooling plus heating models actually have similar shape except that they are displaced upward in amplitude by a factor of 2–5 as compared with the unresolved soft XRB. This may suggest a common origin of the discrepancies if they are not due to our incomplete knowledge of gas physics in groups and clusters. We thus recalculate the XRB for all the models adopting a lower value of the normalization of the mass function of clusters and groups , instead of , (e.g. Seljak 2001; Schuecker et al. 2002; etc.). The corresponding XRB spectra are illustrated in Figure 6. It appears that cooling model is still insufficient to bring the expected XRB to the observational limits in the soft energy band below keV. However, both preheating (especially Model V) and cooling plus heating models now yield the XRB spectra which agree nicely with the unresolved XRB. Perhaps, this indicates that the diffuse XRB could also be used as an independent constraint on the normalization of group and cluster abundance.
5 Conclusions
We have explored a set of simple analytic models for the distribution and evolution of the IGM in groups and clusters, aiming at highlighting the dominant physical process for the hot IGM, which may complement our understanding of the essential physics in addition to employment of hydrodynamical simulations. In particular, we have addressed the question of whether the prevailing scenarios, namely, radiative cooling, preheating and a combination of cooling and heating, can explain both the global observed X-ray properties (entropy distribution and - relation) of groups and clusters and the observational limits on the contribution of the diffuse IGM in virialized halos to the XRB within the framework of standard CDM structure formation with an amplitude of matter power spectrum . Our main conclusions are summarized as follows:
Without radiative cooling and extra heating in addition to gravitational shocks and adiabatic compression, the IGM appears to be too concentrated in halos to explain all the X-ray observations, especially in low-mass systems.
Inclusion of radiative cooling may allow one to marginally reproduce the entropy floor seen in the central regions of groups and clusters (Voit & Bryan 2001b). However, it is still insufficient to account for the steepening of the - relation on group scale, if X-ray surface-brightness bias is not included, and the observational upper limits on the diffuse XRB. For the latter, the difference is by a factor of –, consistent with the previous findings of Wu et al. (2001). Although cooling is certainly an important process in the formation and evolution of galaxies, groups and clusters, and also for the explanation of the entropy floors shown in Fig.1, and even responsible for the scale-dependence of the IGM mass fraction (Wu & Xue 2002b), energy feedback from galaxy formation should be included in order to resolve the inefficiency problem and the cooling crisis (Balogh et al. 2001).
A phenomenological treatment of preheating, regardless of whatever the heating sources and mechanisms would be, may allow us to both reproduce the X-ray luminosity distribution of groups and clusters and explain the observational limits on the XRB from IGM, provided that the level of entropy floor can be raised to as large as 200 keV cm2 at present epoch. Apparently, the entropy profile in this case exceeds the measurements (Fig.1c). When we fix the value of input entropy floor to keV cm2, which gives a nice fit to the observed central entropy distribution of groups and clusters, our predicted - relation and XRB both show an excess at low-temperature/energy range. In a word, a naive preheating model may meet difficulty in the recovery of all the observational phenomena.
Our cooling model with extra heating also fails when the predicted soft XRB is compared with the observational limits. It has been shown that the inclusion of self-absorption by the cold gas in groups and clusters and the exclusion of the contribution of nearby, massive clusters to the XRB do not alter the conclusion significantly. Of course, our cooling plus heating scenario differs from the commonly used preheating plus cooling model in which the IGM was preheated before radiative cooling comes into effect.
Despite of their oversimplification, our analyses as a whole suggest that none of the present models can simultaneously account for the observed X-ray properties of groups and clusters and the residual soft XRB. Actually, the latter constitutes a very stringent constraint on the content and physical processes of the IGM in groups and clusters. Recall that the current observational limits even do not account for the fact that a large fraction of the unresolved soft XRB ( of the total XRB) which we have adopted in this paper may still arise from the X-ray emission of discrete sources (e.g. faint galaxies). More sophisticated models in combination with hydrodynamical simulations will thus be needed to further address the issue.
Finally, the theoretically predicted XRB depends sensitively on the normalization of group and cluster abundance. If a lower value of is adopted instead of , it has been shown that the expected XRB spectra from preheating model and cooling plus heating model agree nicely with current observational limits. In other words, the observational constraints on the unresolved diffuse XRB lends support to a lower amplitude of matter power spectrum (e.g. Seljak 2001; Schuecker et al. 2002). Indeed, the discrepancy between theoretical predictions (at least for preheating model and cooling plus heating model) and X-ray observations, if it is not a result of the oversimplification of our analytic models, may have simply arisen from the too high normalization of the present matter power spectrum.
References
- (1) Babul, A., Balogh, M. L., Lewis, G. F., & Poole, G. B. 2002, MNRAS, 330, 329
- (2) Balogh, M. L., Babul, A., & Patton, D. R. 1999, MNRAS, 307, 463
- (3) Balogh, M. L., Pearce, F. R., Bower, R. G., & Kay, S. T. 2001, MNRAS, 326, 1228
- (4) Bardeen, J. M., Bond, J. R., Kaiser, N., & Szalay, A. S. 1986, ApJ, 304, 15
- (5) Bauer, F. E., et al., 2002, AJ, 123, 1163
- (6) Bond, J. R., et al. 2002, ApJ, in press (astro-ph/0205386)
- (7) Borgani, S., et al. 2002, MNRAS, in press (astro-ph/0205471)
- (8) Bower, R. G., Benson, A. J., Lacey, C. G., Baugh, C. M., Cole, S., & Frenk, C. S. 2001, MNRAS, 325, 497
- (9) Bryan, G. L., & Norman, M. L. 1998, ApJ, 495, 80
- (10) Bryan, G. L., & Voit, C. M. 2001, ApJ, 556, 590
- (11) Bullock, J. S., et al. 2001, MNRAS, 321, 559
- (12) Cavaliere, A., Menci, N., & Tozzi, P. 1997, ApJ, 484, L21
- (13) Cavaliere, A., Menci, N., & Tozzi, P. 1998, ApJ, 501, 493
- (14) Cen, R., & Ostriker, J. P. 1999, ApJ, 514, 1
- (15) Chen, L.-W., Fabian, A. C., & Gendreau, K. C. 1997, MNRAS, 285, 449
- (16) Cowie, L. L., et al. 2002, ApJ, 566, L5
- (17) Croft, R. A. C., et al. 2001, ApJ, 557, 67
- (18) David, L. P., Slyz, A., Jones, C., Forman, W., & Vrtilek, S. D. 1993, ApJ, 412, 479
- (19) Davé, R., et al. 2001, ApJ, 552, 473
- (20) Edge, A. C., & Stewart, G. C. 1991, MNRAS, 252, 414
- (21) Gendreau, K. C., et al. 1995, PASJ, 47, L5
- (22) Giacconi, R., et al. 2001, ApJ, 551, 624
- (23) Giacconi, R., et al. 2002, ApJS, 139, 369
- (24) Hasinger, G., et al. 1998, A&A, 329, 482
- (25) Hasinger, G., et al. 2001, A&A, 365, L45
- (26) Helsdon, S., & Ponman, T. J. 2000, MNRAS, 315, 356
- (27) Hornschemeier, A. E., et al. 2001, ApJ, 554, 741
- (28) Lloyd-Davies, E. J., Ponman, T. J., & Cannon, D. B. 2000, MNRAS, 315, 689
- (29) McHardy, I. M., et al. 1998, MNRAS, 295, 641
- (30) Miyaji, T., et al. 1998, A&A, 334, L13
- (31) Morrison, R., & McCammon, D. 1983, ApJ, 270, 119
- (32) Muanwong, O., Thomas, P. A., Kay, S. T., & Pearce, F. R. 2002, MNRAS, in press (astro-ph/0205137)
- (33) Muanwong, O., Thomas, P. A., Kay, S. T., Pearce, F. R., & Couchman, H. M. P. 2001, MNRAS, 552, L27
- (34) Mushotzky, R., Cowie, L. L., Barger, A. J., & Arnaud, K. A. 2000, Nature, 404, 459
- (35) Navarro, J. F., Frenk, C. S., & White, S. D. M. 1997, ApJ, 490, 493
- (36) Pen, U.-L. 1999, ApJ, 510, L1
- (37) Phillips, L. A., Ostriker, J., P., & Cen, R. 2001, ApJ, 554, L9
- (38) Ponman, T. J., Bourner, P. D. J., Ebeling, H., & Bohringer, H. 1996, 283, 690
- (39) Ponman, T. J., Cannon, D. B., & Navarro, J. F. 1999, Nature, 397, 135
- (40) Raymond, J. C., & Smith, B. W. 1977, ApJS, 35, 419
- (41) Refregier, A., Rhodes, J., & Groth, E. J. 2002, ApJ, 572, L131
- (42) Rosati, P., et al. 2002, 566, 667
- (43) Schuecker, P., Böhringer, H., Collins, C. A., & Guzzo, L. 2002, A&A, submitted (astro-ph/0208251)
- (44) Seljak, U. 2001, MNRAS, submitted (astro-ph/0111362)
- (45) Sheth, R., K., & Tormen, G. 1999, MNRAS, 308, 119
- (46) Soltan, A., Freyberg, M. J., & Trümper, J. 2001, A&A, 378, 735
- (47) Tozzi, P. 2001, in Tracing Cosmic Evolution with Galaxy Clusters, APS Conf. Ser., in press (astro-ph/0109072)
- (48) Tozzi, P., et al. 2001, ApJ, 562, 42
- (49) Tozzi, P., & Norman, C. 2001, ApJ, 546, 63
- (50) Valageas, P., & Silk, J. 1999, A&A, 350, 725
- (51) Voit, G. M., & Bryan, G. L. 2001a, ApJ, 551, L139
- (52) Voit, G. M., & Bryan, G. L. 2001b, Nature, 414, 425
- (53) Voit, G. M., Bryan, G. L., Balogh, M. L., & Bower, R. G. 2002, ApJ, 576, 601
- (54) Wu, K. K. S., Fabian, A. C., & Nulsen, P. E. J. 1998, MNRAS, 301, L20
- (55) Wu, K. K. S., Fabian, A. C., & Nulsen, P. E. J. 2000, MNRAS, 318, 889
- (56) Wu, K. K. S., Fabian, A. C., & Nulsen, P. E. J. 2001, MNRAS, 324, 95
- (57) Wu, X.-P., & Xue, Y.-J. 2001, ApJ, 560, 544
- (58) Wu, X.-P., & Xue, Y.-J. 2002a, ApJ, 569, 112
- (59) Wu, X.-P., & Xue, Y.-J. 2002b, ApJ, 572, L19
- (60) Wu, X.-P., Xue, Y.-J., & Fang, L.-Z. 1999, ApJ, 524, 22
- (61) Xu, H, Jin, G., & Wu, X.-P. 2001, ApJ, 553, 78
- (62) Xue, Y.-J., & Wu, X.-P. 2000, ApJ, 538, 65