CG J1720-67.8: a detailed analysis of optical and infrared properties of a new ultracompact group of galaxies111Partly based on data collected at the European Southern Observatory, La Silla, Chile, Proposal 63.N-0737.
Abstract
We present here optical spectroscopy and BVRJHKs photometry of the recently discovered ultra-compact group of galaxies CG J1720-67.8.
This work represents a considerable extension of the preliminary results we presented in a previous paper. Despite the complicated morphology of the group, a quantitative morphological classification of the three brightest members of the group is attempted based on photometric analysis. We find that one galaxy is consistent with a morphological type S0, while the other two are most probably late-type spirals that are already losing their identity due to the interaction process. Information on the star formation activity and dust content derived from both spectroscopic data and optical and near-infrared colors are complemented with a reconstruction of far-infrared (FIR) maps from IRAS raw data. Enhanced star formation activity is revealed in all the group’s members, including the early-type galaxy and the extended tidal tail, along which several tidal dwarf galaxy candidates are identified. The metallicity of the gaseous component is investigated and photoionization models are applied to the three main galaxies of the group, while a detailed study of the tidal dwarf candidates will appear in a companion paper. Subsolar metal abundances are found for all the three galaxies, the highest values being shown by the early-type galaxy (Z 0.5 Z☉).
1 INTRODUCTION
The fate of compact groups of galaxies (CGs) seems to be established: their small galaxy-galaxy separation and low velocity dispersion facilitate the merging of their member galaxies leading to the final collapse into a bright field elliptical. This picture, in agreement with the hierarchical galaxy formation theory (Larson, 1990; Rauch, Haehnelt, & Steinmetz, 1997; Kauffmann et al., 1999) is supported by N-body simulations (e.g. Barnes 1990) and by recent observations both in the optical and in the X-ray domain. Several isolated elliptical galaxies surrounded by an X-ray halo and by a population of dwarf galaxies have been suggested as relics of CGs (Ponman et al., 1994; Mulchaey & Zabludoff, 1999; Vikhlinin et al., 1999; Jones, Ponman, & Forbes, 2000). HST observations of ultraluminous IR galaxies revealed that some of them are the product of CGs merging (Borne et al., 2000).
Nevertheless, in spite of the numerous studies of CGs and the ongoing surveys aiming at the identification of CGs’ relics, the transition phase from a CG to an elliptical has not yet been fully analyzed and understood, due to the difficulty of finding such evolved systems. This sparse coverage of transitional objects is why we think it worthwhile to concentrate our attention on a recently discovered, very compact galaxy group, whose properties, as described in Weinberger, Temporin, & Kerber (1999, hereafter Paper I), are indicative of a very advanced evolutionary phase. We briefly summarize in the following the main results achieved in Paper I:
CG J1720-67.8 (z=0.045) is an isolated group of three galaxies with an associated arc-shaped luminous tidal feature at whose ends two brightness enhancements are present. These are likely forming (or already formed?) tidal dwarf galaxies (TDGs). Several other knots are detected along the tidal “arc” and at the tip of a small tidal tail departing from the second brightest galaxy. The group is one of the most compact known so far. The median projected separation of the four brightest objects, 6.9 kpc222Throughout this paper we assume H0 = 75 km s-1 Mpc-1, and the low velocity dispersion, = 67 km s-1, facilitate the interaction processes inside the group as evidenced by its peculiar morphology. Optical emission lines were detected in the four brightest objects, in a portion of the arc-like tidal feature, and in a small knot located at the end of a faint tail. They showed emission line ratios typical of H II or starburst-nucleus-galaxies (SBNG). The H luminosity, after correction for the high internal extinction derived from the Balmer decrement, actually revealed a particularly enhanced star formation activity possibly triggered by galaxy interactions.
In this work we make use of new photometric and spectroscopic data to perform a more detailed study of the three brightest galaxies of CG J1720-67.8 and we extend our analysis to the southern part of the group; details about the remaining group’s members are given in a companion paper (Temporin et al. 2002). Our new data show that the star formation activity is present all over the group and display the presence of diffuse light around the CG, as well as a number of candidate dwarf galaxies in its surroundings. A quantitative morphological classification and a broad-band color inspection indicate that one of the two brightest galaxies (no. 2, see Fig. 1), despite its moderate star formation rate ( 0.7 M⊙ yr-1, Paper I), is an early-type galaxy (most probably an S0), reddened by a considerable amount of dust.
The analysis of raw IRAS data by means of high resolution IRAS maps obtained with the Maximum Entropy Method appears to offer an answer to the puzzling question posed in Paper I regarding the lack of IRAS cataloged sources despite beeing in such a dusty star-forming object. Finally, thanks to the full coverage of the group members with radial velocity measurements, we can now estimate the mass of the group, under the assumption that it is a virialized system.
The present paper is organized as follows: observations and data processing are described in Section 2; color indices and absolute photometry as well as a description of the adopted galaxy fitting techniques and a discussion of the photometric results are presented in Section 3. The spectral analysis of the group, together with photoionization models for the three brightest galaxies, is presented in Section 4, where considerations on the dust content of the group based on IRAS data are expressed as well, and an estimate of the group’s virial mass is provided. Finally the results are summarized and discussed in Section 5.
2 THE DATA
The present work is based on new optical and near infrared (NIR) data and on the data already presented in Paper I, as well. A summary of all the observations is given in Table 1. In the following we describe separately the data acquisition and reduction of optical and NIR data.
2.1 Optical Data
New BVR imaging and Multi Object Spectroscopy (MOS) frames were acquired in June 1999 at the ESO 3.6 m telescope in La Silla equipped with EFOSC2 and the Loral Lesser CCD#40, whose 15 -sized pixels gave a spatial scale of 0′′.157 pixel-1 on a 5′.4 5′.4 field of view. The seeing varied between 1′′.3 and 1′′.8 during the observations. The optical images suffered from unfavorable and unstable weather conditions and a Landolt (1992) standard field could be observed only once in the three photometric bands, which was not sufficient for determining the calibration coefficients. Therefore the photometric calibration had to rely on mean calibration coefficients available at the La Silla Observatory web-site333http://www.ls.eso.org/. In particular we used zero points and color terms given for the two photometric nights preceding and following our observations. Mean extinction coefficients were obtained from the measurements performed at the La Silla site by the Geneva Observatory Photometric Group until 1997444http://obswww.unige.ch/photom/extsil/. Therefore the photometric calibration must be taken with caution: although we performed some tests on its reliability (see Appendix A), we warn about possible systematic errors which could have been introduced. Additionally the B-band images turned out to be heavily affected by intervening clouds during the exposures, so for magnitude estimate purposes we preferred to use an acquisition image obtained by the ESO staff a few days before our observing run, under better (but still not ideal) weather conditions.
The use of the MOS technique allowed simultaneous acquisition of spectra at several positions on CG J1720-67.8 using short slitlets 1′′.5-wide, punched on 5 different masks. Typical exposures were 1800 s with every mask. The actual wavelength interval varied depending on the position of the slitlets on the frame, in the range 3350 – 7560 Å given by grism #11. The spectral resolution was 19 Å.
The usual reduction steps (bias subtraction, flat-fielding, cosmic-rays removal, and for spectra, additional wavelength calibration) were performed by means of standard IRAF555IRAF is distributed by the National Optical Astronomy Observatories, which are operated by the Association of Universities for Research in Astronomy, Inc., under cooperative agreement with the National Science Foundation packages. An additional defringing procedure was applied to R-band images due to the presence of a fringe-pattern produced by night-sky emission lines. For this purpose, after verification of the constancy of the fringe pattern across the two nights of observation, the median of all the R-band, background subtracted images, was used as a fringe-frame to be conveniently scaled and subtracted from the R images of the galaxy group. After alignment, the three R-band images were averaged in order to improve the signal-to-noise ratio. In order to appreciate color gradients across the galaxy group, BV, VR and BR color maps were obtained after having matched the point-spread-functions (PSFs) of the BVR images through convolution with appropriate Gaussian functions. The result will be analyzed in Section 3, where the photometric analysis, carried out by use of the package GIM2D (Simard, 1998; Simard et al., 2001) is discussed as well.
The positions in the galaxy group, where spectra were obtained either in June 1999 or during previous observing runs, are labeled onto the deep R image in Fig. 1. MOS spectra were flux calibrated using a 300 s exposure of the standard star G-138-31 obtained during the same night through a 1′′.5-wide long-slit. One-dimensional spectra of the individual objects were extracted and corrected for foreground galactic extinction. This correction was applied by assuming AV = 0.290, a value given in NED666NASA/IPAC Extragalactic Database, operated by the Jet Propulsion Laboratory, California Institute of Technology, under contract with the National Aeronautics and Space Administration as deduced from Schlegel, Finkbeiner, & Davis (1998) and in agreement with our Galactic extinction estimate given in Paper I. Spectral emission features were measured by Gaussian fitting with the IRAF task SPLOT. Deblending of H + [N II] triplets was achieved by using the MIDAS777The ESO-MIDAS system is developed and maintained by the European Southern Observatory task ALICE. Where absorption lines could be identified, a template of the underlying stellar component was appropriately diluted to match the absorption features and subtracted from the original spectrum, following the prescriptions by Ho, Filippenko, & Sargent (1993), in order to minimize the contamination by absorption lines on the emission-line measurements. Emission line fluxes and radial velocities given in Tables 2 and 3 are both from the present work and from Paper I888The measurements of the spectrum of galaxy 2 and object no. 3 given here slightly differ from the ones given in Paper I, because of a redefinition of the section of the bidimensional spectrum occupied by the objects..
2.2 NIR Data
NIR images in the photometric bands J, H, and K-short (Ks) were acquired in June 1999 under photometric conditions at the 1m Swope telescope in Las Campanas, using a 256 256 pixel NICMOS3 HgCdTe array having a pixel size of 40 m and giving a spatial scale of 0′′.599 pixel-1 on a 2′.5 2′.5 field of view. The H, J, and Ks filters are centered at 1.24, 1.65, and 2.16 m respectively, and have bandwidths of 0.22, 0.30, and 0.33 m. The properties of this photometric system are described in detail in Persson et al. (1998). For the determination of the photometric calibration coefficients, six standard stars from the catalog of Persson et al. (1998) were observed (identification numbers: 9119, 9136, 9144, 9146, 9170, 9178).
The observational procedure as well as the reduction steps were analogous to the ones described in Galaz (2000). Every exposure of both the target and the standard stars was split into a number of dithered images (see Table 1) depending on the magnitude of the objects, the sky brightness and the linearity regime of the detector. Total exposure times of 1800 s in J, 2000 s in H, and 2500 s in Ks were achieved for CG J1720-67.8, while the final integration time for the standard stars was 50 s in each filter. The processing of the raw images with a reduction pipeline based on the DIMSUM999Deep Infrared Mosaicing Software package, developed by P. Eisenhardt, M. Dickinson, A. Stanford, & J. Ward, and available from ftp://iraf.noao.edu/iraf/contrib/dimsumV2/dimsum.tar.Z. package included dark correction, flat-fielding, coaddition, alignment, cosmic rays rejection, registration, and sky subtraction. The PSFs of the images were matched through convolution with a circular Gaussian function and finally the infrared color maps JH, HKs, and JKs were made.
3 PHOTOMETRIC MEASUREMENTS
3.1 Color Indices
The extreme compactness of the group suggests that it is in an advanced stage of evolution and we might expect to infer some insight into its evolutionary stage and into interaction-induced events, like enhancement of star formation and subsequent presence of young stellar populations, from a qualitative comparison of its appearance in different wavelength bands and from optical and NIR color maps. In Fig. 2 the sequence of BVRIHJKs images is shown for comparison purposes, while in Fig. 3 the optical and NIR color maps BV, VR, BR, JH, HKs and JKs show the relative colors of the different parts of the group, giving evidence of color gradients across it. A diffuse envelope, a kind of halo, is present in all the optical images and in the I band, but it seems to be more prominent in V and R. This halo is possibly a mixture of stars, dust and excited gas stripped away from the parent galaxies and now trapped into the group’s potential well: the presence of a common halo of optical light is one of the evidences of the physical binding among the members of a group.
In the BV and BR color maps a color gradient is visible across galaxy 2, whose nucleus is also significantly redder than all the other objects of the group. A less marked color gradient can be observed in galaxy 4. The color difference between the central parts of the two galaxies is much less evident in VR. The bluest regions in the maps are occupied by galaxy 1, and objects 3, 9, 7, and 8. The whole tidal arc exhibits rather blue colors, too, and the emission knots along it are visible as even bluer regions. Finally, the ring-like structure to which object 11 belongs also shows blue colors, although there the signal-to-noise ratio (SNR) is very low. In the VR color the diffuse halo appears to be reddish, with some bluer condensations, but again the SNR is too low to allow us to draw significant conclusions. The red blob besides the nucleus of galaxy 1, well visible in all the color maps, is a foreground star projected onto the galaxy, as shown by its spectrum (see Section 4).
We interpret the characteristics described above as an indication of recent and/or ongoing star formation spread over most of the group’s extent. Young stellar populations must be present in the bluest parts of the group, while a mixture of old and young populations might be present in galaxy 2, though metallicity effects and dust extinction might play a role in the observed color gradients (age-metallicity-dust degeneracy; see e.g. Worthey (1994)).
In the NIR images the tidal arc appears to gradually fade with increasing wavelengths, supporting the hypothesis that old stars stemming from the parent galaxies are present in it –along with a young population responsible for its blue color– and contribute to the NIR light. The common halo becomes extremely faint in these passbands and is barely visible. Objects 3, 7, and 8 almost disappear in the Ks frame.
Since NIR bands are considerably less affected by reddening, a comparison between the optical color maps and the NIR ones (Fig. 3) is already helpful for disentangling dust extinction effects and to understand where the dust is located in the group. In JH and JKs maps, the central part of galaxy 2 appears bluer than its surroundings, which is the opposite of what is observed in optical colors. The same holds for galaxy 4, although to a smaller degree. These color gradients suggest that star formation is more concentrated in the nuclear regions of the two galaxies and their redder optical colors are due (at least partly) to extinction effects. Specifically, a considerable amount of dust seems to be present in (or along our line of sight to) galaxy 2, while the dust distribution in galaxy 4 seems to be less extended and more patchy. Note that all the regions appearing bluer in the JH and JKs maps are redder in HKs. This trend is not surprising, because this color has an opposite behavior with respect to the others and becomes redder during starburst phases (see Temporin & Fritze-von Alvensleben 2002). Such observations are in agreement with the spectroscopic results: the high values of the Balmer decrement (Tables 2 and 3) are consistent with a large amount of internal extinction, although these values are necessarily referred only to the portions of galaxies entering the slit.
3.2 Optical and NIR Photometry
Optical instrumental magnitudes were calibrated in the La Silla photometric system by the following equations:
| (1) |
| (2) |
| (3) |
where , , are calibrated magnitudes, , , are sky-subtracted instrumental magnitudes normalized to 1 s exposure and , , are the airmasses at the time of the observations. The surface brightness was found to be sky-background limited at the values 25.64 mag arcsec-2 in B, 25.28 mag arcsec-2 in V, and 24.89 mag arcsec-2 in R by computing the surface brightness of a pixel having a 3 detection. The limiting magnitudes in the three bands were found to be Blim = 25.05 mag, Vlim = 24.32 mag, and Rlim = 24.23 mag by referring to a 3 detection and taking into account the area of the seeing disk.
The photometric calibration in NIR bands was performed using the standard stars, which were observed during the same night of the target at air masses ranging from 1.32 to 1.07. The calibration coefficients were determined through a uniformly weighted fit of the following transformation equations:
| (4) |
| (5) |
| (6) |
where , , are the zero points of the photometric system, , , are the air masses, and , , are the instrumental magnitudes of the standard stars. The extinction coefficients are the ones given in Persson et al. (1998). Color terms were not included because they were smaller than the magnitude errors. The from the fits to the transformation equations was 0.02 – 0.03, which gives an estimate of the internal error of the photometric calibration. The obtained zero points are: = 19.79 0.01, = 19.34 0.01, and = 18.86 0.01. The limiting surface brightnesses and magnitudes are: = 22.21 mag arcsec-2, = 20.92 mag arcsec-2, = 20.18 mag arcsec-2, Jlim = 21.71 mag, Hlim = 20.24 mag, and Klim = 19.65 mag.
3.3 Galaxy Fitting Procedure
Photometry of the three galaxies was achieved through a bi-dimensional fitting of the galaxy images. For this purpose we used GIM2D (Simard, 1998; Simard et al., 2001), an IRAF package written to perform an automated bulge-disk surface brightness profile decomposition of low signal-to-noise images of distant galaxies. The program gives as output, besides the value of the best-fit parameters and asymmetry indices, an image of the galaxy model and a residual image obtained by subtracting the model from the original image. Although GIM2D does not allow to follow changes in ellipticity, center position, and position angle of the isophotes across a galaxy, it has the considerable advantage of including a PSF deconvolution in the bi-dimensional fit of the galaxy image. The small-sized galaxies of CG J1720-67.8 –having semi-major axis of the outermost visible isophotes in our images ranging from 4 to 8 arcsec– could have their profiles significantly affected by the PSF. Therefore a bulge-disk decomposition that takes into account this effect is the most suitable to a quantitative morphological classification.
This image fitting method has already been successfully applied by Tran et al. (2001) to a sample of galaxies belonging to poor galaxy groups and spanning a wide range in morphological type. They found that the ratio between the bulge and the total luminosity (B/T) can be used on average as a robust morphology indicator to discriminate between early-type bulge-dominated (B/T 0.4) and late-type disk-dominated (B/T 0.4) galaxies, although for individual galaxies B/T can change in either direction by as much as 59%.
For the application of GIM2D to CG J1720-67.8 we followed the prescriptions given in Simard et al. (2001), as well as in the related web site101010http://nenuphar.as.arizona.edu/simard/gim2d/gim2d.html. PSF images in the six photometric bands to be used during the galaxy fitting procedure were obtained with the DAOPHOT (Stetson & Harris, 1988) package inside IRAF. The isophotal area of the galaxies was defined by means of the galaxy photometry package SExtractor V2.2.2 (Bertin & Arnouts, 1996) with a minimum deblending contrast parameter of 0.0001 in order to separate the three galaxies from one each other and from the tidal arc. The fit uses an exponential law for the disk, while a classical de Vaucouleurs -law (de Vaucouleurs, 1948) or a Sérsic profile (Sérsic, 1968) can be chosen for the bulge. In the last case, the index of the Sérsic law is one of the fitting parameters. We attempted fits of the three galaxies both with a de Vaucouleurs bulge plus exponential disk, and with a Sérsic law plus exponential disk. Comparably good fits –as it was judged from the reduced of the fits and the total residual light RT– were obtained for all the three galaxies with both kinds of law for the bulge with no appreciable change in the total integrated luminosity of the galaxies.
Nevertheless, the de Vaucouleurs profile causes an oversubtraction of the region around the center of galaxy 1 in the residual image and a failure in the detection of the disk of this galaxy in the B band (B/T = 1), while a better residual image and a B/T = 0.4 are obtained with the Sérsic profile. The best fit with the latter gives a Sérsic index = 1.3, thus approaching an exponential law also for the bulge. Similarly the best fit of galaxy 4 with a Sérsic bulge plus exponential disk led to a Sérsic index = 0.8. Actually in recent years both observational studies and numerical simulations have provided growing indications that bulges of (especially late-type) spiral galaxies follow an exponential law rather than the classical de Vaucouleurs one (Andredakis & Sanders, 1994; Andredakis, 1998; Carollo et al., 2001). The Sérsic index for galaxy 2, = 4.0, indicates that the de Vaucouleurs law is a good representation of its bulge profile.
The complex morphology of CG J1720-67.8 requires particular attention in disentangling the light coming from different objects when measuring their magnitudes. Owing to the compactness of the group, the three brightest galaxies are partly overlapping (at least in projection on the plane of the sky). In order to deal with this problem, we have adopted the iterative fitting procedure described below.
In every image we started by fitting galaxies 1 and 4 and subtracting their models from the original frame. Galaxy 2 was fitted on the residual image and its model was subtracted from the original one. A new fit of galaxies 1 and 4 was performed on the new residual frame. After the subtraction of their models, a second fit of galaxy 2 was obtained. Further iterations of this fitting/subtraction procedure did not show significant changes in the result. Fig. 4 makes clear the importance of the above explained procedure: in the left panel (original frame galaxy 2) the outskirts of galaxy 4 appear to overlap galaxy 2 up to its center; similarly in the right panel (original frame galaxies 1 and 4) galaxy 2 extends to the center of galaxy 4 and significantly overlaps with galaxy 1.
We show in Fig. 5 the residual image of the group after subtraction of the best fit models of all the three galaxies. A knot of residual light remained just below the center of galaxy 2, as well as the bridge connecting galaxy 1 to galaxy 2, already evident in the original image, and another knot near the center of galaxy 1. Galaxy 4 shows internal features and blobs reminiscent of a knotty spiral structure and going from the upper part of the tidal arc through the galaxy center to object no. 5. Supported also by the enhanced star formation activity of the galaxies (see Section 4), we interpret these residual structures as H II regions. Thus galaxies 2 and 4 appear to have H II regions located next to the nucleus, in agreement with the spectral classification in Section 4.3.
3.4 Total Magnitudes and Structural Parameters
With the fit of the surface brightness distribution of the galaxies we obtained a measure of the total integrated galaxy light, the B/T ratio and other structural parameters, namely the effective radius (i.e. the half-light radius of the bulge component) , the disk scale-length , the bulge ellipticity , the position angles of bulge and disk components and , the disk inclination and the half-light radius (i.e. the radius inside which half of the light of the whole galaxy is contained). Additionally the RT parameter giving the total residual light after the galaxy model subtraction allows an estimate of the goodness of the fit, while the asymmetry index RA, measured at 2, gives an indication of the presence of asymmetric structures in the galaxies (Tran et al., 2001).
The total magnitudes and colors obtained from the total integrated galaxy light given by GIM2D, after calibration according to equations 1 to 6, are listed in Table 4. The structural parameters of the galaxies –given by the best-fit with a de Vaucouleurs bulge plus an exponential disk– are listed in Table 5 along with the reduced- of the fits.
Column (1) of Table 4 lists the observed magnitudes corrected for Galactic extinction by means of the extinction values given in NED, based on Schlegel et al. (1998). An inclination correction taking into account the internal extinction has been calculated as a function of the morphological type T and of the B-band disk inclination 111111The B-band disk inclination was used instead of the ratio R25 between the major and minor diameters at the = 25 mag arcsec-2 isophote, which could not be measured. (Table 5) following the instructions given in the introduction to the Third Reference Catalogue of Bright Galaxies (de Vaucouleurs et al., 1991, RC3). Based on our quantitative morphological analysis (previous section) and on a comparison of the galaxy colors with the optical colors as a function of the morphological type T given by Buta & Williams (1995), we used T = 6 (i.e. Scd) for galaxy 1, T = 0 (i.e. S0) for galaxy 2, and T = 5 (i.e. Sc) for galaxy 4. The internal extinction in the other bands was calculated from the B-band one, AB, and the color excess E(BV) by applying the Cardelli, Clayton, & Mathis (1989) extinction law and calculating the selective extinction RV according to equation (56) of the RC3. These extinction values and color excesses are listed in column (2) of Table 4 for each galaxy, while face-on magnitudes and colors are given in column (3). However the inclination correction is based on the assumption that the galaxies contain the standard amount of dust typical of galaxies of similar morphological type. Since there are indications of the presence of a considerable amount of extinction in CG J1720-67.8, in some cases the correction calculated above might be a lower limit.
The results on the bulge-disk decomposition (see previous subsection and Table 5) could support the hypothesis that galaxy 1 is a late-type spiral, which has lost its outer layers during the interaction with its companions and has remained with an exponential bulge that dominates its light. Nonetheless, as noticed by Tran et al. (2001), a B/T 0.4 for galaxies with strong [O II] emission – and therefore with enhanced star formation, as is the case for galaxy 1 (see Section 4)– could indicate the presence of central star forming regions rather than a true bulge. Galaxy 4 can be classified as a late-type spiral (Sc), as well. We note that, except for the internal structures revealed in the residual images, no traces of spiral arms remain visible in this galaxy. We argue that its spiral structure might have been destroyed by the interaction and could have been strewn into the adjacent arc-like tidal feature.
The bulge of galaxy 2 dominates its light, as already expected from a visual inspection of the images, and has a de Vaucouleurs profile. However a disk component is present as well. We finally classify galaxy 2 as an S0.
The sources of error in the total magnitudes are multiple and difficult to evaluate, in particular due to the iterative procedure applied to disentangle the fluxes from partially overlapping galaxies. Since GIM2D calculates a lower and an upper limit of the total galaxy flux, together with its best-fit value, we used the semi-difference of these limits to have an indication of the magnitude error related to the fitting procedure. We found that this error is ranging from 0.02 to 0.1 mag in the NIR, while it is 0.01 mag or lower in the optical bands. Therefore in the case of optical magnitudes we consider the calibration error ( 0.05 mag, see Appendix) as the dominating one.
The asymmetry index RA (Table 5) are considerably high for all the three galaxies, except in the H and Ks bands. Tran et al. (2001) adopt RA 0.05 as the lower limit for classifying a galaxy as having high asymmetry. A high value of RA can result from asymmetrically distributed H II regions and/or interaction-induced features (e.g. tidal distortions). After an inspection of the residual images, we interpret the RA values of the galaxies of CG J1720-67.8 as an effect of tidal interactions, which are probably responsible for both morphological distortions and the presence of asymmetrically distributed regions of star formation.
4 RESULTS AND DISCUSSION
4.1 Widespread Emission Line Activity
CG J1720-67.8 is characterized, as already mentioned, by line emission over its spatial extent. Several parts of the group were spectroscopically sampled, as shown from the labeling in Fig. 1. Besides the spectra analyzed in Paper I, new spectra of galaxies 1 and 4 were acquired at a different position angle (P.A. = 90°). The wider wavelength range of the new spectrum allowed the detection of the [O II] 3727 line in galaxy 4, whose general spectral properties are in good agreement with those found in Paper I. For galaxy 1 a new spectrum across the nucleus (1a) and one across the knot 1b were obtained. While the latter was found to be a late-type foreground star projected onto the galaxy, weak emission lines from the underlying galaxy were detected and allowed a measure of the radial velocity. Therefore three values of radial velocity, related to three different portions of the galaxy were available and we adopted the weighted mean as the radial velocity of galaxy 1. The long-slit spectrum of galaxy 1 exhibits a secondary peak, as it is visible from the H profile along the slit (Fig. 6), which was used to identify and extract the individual objects. Therefore we extracted two spectra of galaxy 1 at P.A. = 130°, namely one including both the peaks, labeled 1, and one including only the main peak, labeled 1, and corresponding to the north-western side of the galaxy. The one-dimensional spectra of the three galaxies, both from Paper I and from the present work, are shown in Figs. 7 and 8.
The additional objects for which spectra were obtained have redshifts in agreement with the previously studied group’s members. They are mainly located along the tidal arc (see Fig. 1) and are possible tidal dwarf candidates (for further details see Temporin et al. 2002). The heliocentric radial velocities of the group’s members listed in Table 6 have been obtained from position measurements of their emission lines. The value given for object no. 11 rests on the only detected emission line, whose wavelength corresponds to the redshifted line [O II] 3727, at a redshift in agreement with that of the galaxy group. Radial velocities of objects 2, 3, 4, 5, and 6 are from Paper I and their internal errors were derived following the method described by Corsini et al. (1999), which takes into account the signal-to-noise ratio (SNR) of the emission lines. This method could not be applied to the short-slit MOS spectra. As an alternative the velocity error associated with the individual lines was expressed as a function of the calibration error by propagating the equation
| (7) |
and was used as weight. The calibration error was evaluated as mean shift between the measured position of the night-sky emission-lines and their tabulated values and it ranges from 0.38 Å to 0.98 Å for MOS spectra. These errors, calculated at the H wavelength, are listed in Table 6.
With the new systemic velocity of galaxy 1, the line-of-sight velocity dispersion based on the four brightest group’s members (no. 1, 2, 3, and 4) is 65.3 km s-1, while the 3D velocity dispersion (Hickson et al., 1992) is = 95 km s-1. When the tidal dwarf candidate no. 7 is included these values rise to = 149.3 km s-1 and = 133 km s-1, however there are no sufficient information to establish whether no. 7 is a self-gravitating object or not. The dimensionless crossing time, defined by Hickson et al. (1992) as an indicator of the dynamical state of a group, is very low: H = 0.0067, and this should indicate an advanced stage of dynamical evolution, although the group does not stringently satisfy the correlation between the fraction of late-type galaxies and the crossing time found by Hickson et al. (1992). Actually if we consider the three main galaxies 1, 2, and 4 (i.e. we exclude the candidate tidal dwarf no. 3), according to the results of the photometry (previous Section), the fraction of late-type galaxies is 0.67, so the group cannot be considered spiral-poor. However, even if we consider galaxies 1 and 4 as spirals, no traces of spiral arms are evident from our images, which means that if they had spiral arms in the past, they must have lost them as an effect of the interaction. This makes it difficult to give an unambiguous estimate of the spiral fraction in CG J1720-67.8.
4.2 Considerations about the Group’s Kinematics
Kinematics can give important insights on relatively recent interactions and/or merger events galaxies went through: such phenomena cause kinematic disturbances which are expected to fade within 1 Gyr (Rubin, Waterman, & Kenney, 1999). Furthermore spiral galaxies’ rotation curves can give indications about the presence of dark matter halos associated with the galaxies. Therefore the study of the kinematics of galaxies in a dense environment such as the one of CG J1720-67.8, where strong interactions are currently taking place and could have taken place also in the past, would be of fundamental importance.
Unfortunately, considerations about the kinematics of the members of CG J1720-67.8 are strongly limited by the spatial resolution of the spectra and the small apparent dimensions of the group itself. Specifically, velocity curves for the member galaxies could not be obtained. Only a few independent velocity points per galaxy along the slit direction could be measured by binning the spectrum in the spatial direction according to the seeing ( 1′′). A higher number of points could be obtained only for galaxy 4 along P.A. = 130∘, which do not coincide with either of the galaxy axes. Therefore a kinematic study of the individual galaxies and a search for anomalies due to gravitational interactions turned out to be impossible, although it is interesting to note how the radial velocity exhibits a sort of regular trend between adjacent objects (Fig. 9).
Some observations about the kinematics of the tidal arc can be done by considering the radial velocities of the knots belonging to it, nos. 3, 6, 9, 10, 7, 8, assuming that they are actually embedded into the arc and not simply projected onto it. As it can be seen from Table 6, radial velocities in the southern part of the arc are lower than the ones in its northern part indicating that the southern part is approaching us while the northern part is receding. The difference in radial velocity between the southern and the northern tip of the arc is approximately 300 km s-1. The minimum value of radial velocity along the arc is found at the position of object no. 10.
4.3 Spectral Classification
As visible in Figs 7 and 8, galaxies 1 and 4 have a blue continuum and strong emission lines, the latter with some weak absorption features, as well. The extinction measured from the Balmer decrement in spectrum no. 1 is lower than in spectra 1 and 1a (see Table 2). These measurements suggest a non-homogeneous distribution of dust across galaxy 1, with an apparent concentration in the south-eastern part of it. The continuum of galaxy 2 is red and there are relatively strong Balmer and metal absorption lines. The relative intensity of the blend CaH + H with respect to CaK, defined by Rose (1984) as an age indicator, indicates that galaxies 2 and 4 have spectra dominated by A-type and B-type stellar population, respectively.
For all the objects where H was detectable along with the other emission lines, we measured the diagnostic ratios (Veilleux & Osterbrock, 1987, VO) [O III] 5007/H vs [O I] 6300/H, [N II] 6583/H, and [S II] 6716+6731/H for classification purposes. The VO diagnostic diagrams shown in Fig. 3 of Paper I were complemented with the additional objects nos. 7, 8, 9, and 10 (Fig. 10), thus revealing that all the objects belonging to CG J1720-67.8 have typical emission-line ratios of H II regions or SBNGs (Coziol et al., 1998). In the [S II] diagnostic diagram, the emission knots, TDG candidates and also galaxy 2 are shifted towards the LINER region. This could indicate the presence of shocks: such low-ionization lines are strongly enhanced e.g. by shocks produced by outflows of gas, as occurring in case of stellar winds or supernova remnants (Dopita & Sutherland, 1995). From these diagrams the ionization sources in CG J1720-67.8 appear to be of thermal nature, although in the case of galaxy 2 we cannot completely exclude the presence of a low-luminosity (obscured) active nucleus, due to the somewhat ambiguous values of its emission-line ratios.
In particular the presence of H emission indicates present-day star formation in the galaxies and tidal-dwarf candidates, as well as along the tidal arc. The only object where H was not detected is no. 11. In its spectrum only a bona fide [O II] 3727 emission line was detected. Since [O II] emission can be triggered not only by star formation but also by diffuse ionization of the gas, we cannot derive any conclusion about the nature of object no. 11 without obtaining a deeper exposure of the object. The star formation rates of the three galaxies were estimated from their H intensities (after correction for internal extinction) adopting the calibration obtained by Hunter & Gallagher (1986) in the range of mass 0.1 - 100 M☉:
| (8) |
By considering the area covered by the slit, we deduced the star formation rate densities (SFRD) per squared parsec. Their values –obtained also from the new spectra– are given in Table 7. The strongest starbursts are observed in galaxies 1 and 4 with SFRD reaching 2010-8 M☉ yr-1 pc-2, but also the early-type galaxy of the group, no. 2, shows enhanced star formation.
4.4 Metal Abundances and Photoionization Models
Metal abundances of the gaseous component could be estimated from emission-line intensity ratios. Due to the intrinsic weakness of the [O III] 4363 line, this was not observable in our spectra. Such a line is usually visible in the case of particularly low abundances or high temperature; however its detection requires a particularly good signal-to-noise ratio in the spectra. As a consequence, a direct estimate of the electronic temperature, necessary for direct calculations of metal abundances, was not possible. Therefore we derived a first estimate of the abundances and physical parameters of the ionized gas by comparison with empirical diagrams (McGaugh, 1991; Denicoló et al., 2001). Specifically we compared the R23 ratio, defined as [O II] 3727 [O III] 4959,5007/H, with the model grid in the plane [O III]/[O II] R23 in Fig. 10 of McGaugh (1991). From this comparison, we derived an ionization parameter 3.5 U 3 for all the three galaxies. From this single plot it was not possible to discriminate between the lower and the upper branch of the R23 - relation. Therefore two possible abundance values were derived for each galaxy. Namely 3.5 or 3.8 for galaxy 1, 3.4 or 4.2 for galaxy 2, and 2.9 or 4.4 for galaxy 4.
However, if we compare our values of the parameter N2 = [N II] 6583/H with the monotonic relation N2 - 12 found by Denicoló et al. (2001, their Fig. 1) and we refer to the model track with U = 3.0, which is the one better approaching our case, we find that subsolar abundances (Z 0.3 Z☉) are the best suited to our data for galaxies 1 and 4, while galaxy 2 shows somewhat higher metallicity (Z 0.5 Z☉). Therefore the low metallicity branch of the R23 - relation seems to be the most reasonable choice for galaxies 1 and 4, while the high metallicity branch is appropriate to galaxy 2. Thus this first estimate gives the following abundances for the gaseous component of the galaxies in CG J1720-67.8: 12 8.2, 8.6, and 7.6 for galaxies 1, 2, and 4 respectively. We used the above values as initial guesses in the calculation of photoionization models of the three galaxies with the code Cloudy 90.04 (Ferland, 1996). In accordance with the H II nature of the galaxies established above (Fig. 10), we assumed as ionizing source a thermal continuum. Specifically we adopted a Mihalas continuum with T = 40000 K. The ionization parameter estimated from the diagram of McGaugh (1991) and the electronic density estimated from the [S II] 6716/[S II] 6731 ratio assuming an electronic temperature Te 104 K were used as initial parameters. The hydrogen density and the ionization parameter were allowed to vary to reach the best-fit to the emission line intensities relative to H. Several models were calculated with slightly modified metal abundances until a reasonable fit to the line ratios was obtained. The parameters and metal abundances of the best-fit models are given in Table 8, and the observed and modeled line ratios are listed in Table 9. The galaxy with lowest metal abundances is no. 4, having Z 0.1 Z☉, while the highest abundances, Z 0.5 Z☉, are found for galaxy 2. The values of the ionization parameter are in agreement with the above first estimates: U 3.2 for galaxy 1 and U 3.6 for galaxies 2 and 4.
4.5 FIR Emission and Dust Content: Not a Puzzle Anymore?
The amount of internal extinction determined from the Balmer decrement in the galaxies and in the northern part of the tidal arc of CG J1720-67.8 is considerable (Tables 2 and 3). This is actually not a surprise, given the starburst nature of these objects and the high concentration of dust which is usually accompanying episodes of intense star formation. The dust seems to be concentrated mainly in the northern part of the group.
As a consequence of the enhanced star formation in the group’s objects and of the noticeable amount of interstellar dust, a high FIR luminosity is expected due to re-radiation by the dust of the UV light emitted by young hot stars. Nevertheless CG J1720-67.8 has not been cataloged as IRAS source. This could be due to the fact that the group – having Galactic coordinates 324°, -16°– is located in a region of the sky dominated at 100 m by “infrared cirrus”, whose presence makes it difficult to identify real point sources and might corrupt the measurement of their fluxes.
However an inspection of IRAS raw data at the position of the group revealed the presence of emission apparently peaked at 60 m and a hint of emission at 100 m, although difficult to disentangle from the extended structures visible in this band. Low resolution co-added maps in these two bands, centered on the position of CG J1720-67.8 with a field size of 3232′ were extracted from position- and flux-calibrated raw IRAS data – obtained from the IRAS server at the Space Research Organization Netherlands SRON – by use of the program GIPSY121212Groningen Image Processing SYstem, available at: http://www.astro.rug.nl/gipsy/. In order to obtain a higher (by a factor of 5) spatial resolution, approaching the diffraction limit of the satellite ( 1′ at 60 m and 1′.7 at 100 m), the HIRAS program, which drives the MEMSYS5 maximum entropy imaging algorithm (Bontekoe et al., 1994) was applied to the data. The resulting FIR “images” and the corresponding contour maps overlapped to the Digitized Sky Survey (DSS) image of the galaxy group are shown in Fig. 11. Even with such a resolution – assuming that the observed emission is really associated with the galaxy group – it is not possible to distinguish FIR emission stemming from individual group’s members, due to the small size of the galaxy group itself ( 30′′ in diameter), which is well below the diffraction limit of IRAS. Therefore it is not clear whether the detected FIR emission is associated with the whole group or only with one or more of its components.
The flux density of the source in the two FIR bands was estimated with the GIPSY task FLUX inside three different polygonal apertures defined “by hand” around the source just outside the faintest border of the source visible in the images after the application of the maximum entropy algorithm. The mean of the three measured values and the associated were taken as the flux density measurement and its error. The background value, obtained as mean value of the mode inside three different boxes free of sources in the same field and multiplied by the number of pixels in the polygonal apertures, was subtracted from the measured fluxes. The resulting flux densities at 60 and 100 m are F60 = 1.1 0.2 Jy and F100 = 3.6 0.7 Jy, from which the total FIR flux between 42.5 and 122.5 m could be derived following Helou, Soifer, & Rowan-Robinson (1985):
| (9) |
yielding a FIR luminosity LFIR = 3.16 1044 erg s-1. Therefore, following Hunter et al. (1986), the total star formation rate of the group can be evaluated as: SFRFIR = 1.3410-43LFIR = 42.3 M⊙ yr-1, a value a factor of a few higher than the one which could be deduced by summing up the SFR of all the group’s objects as measured from their H luminosities.
By assuming a single temperature component and a emissivity law, also estimates of the temperature and mass of the “warm” dust – having a temperature T 25 K – could be derived with the following expressions (Young et al., 1989; Bregman et al., 1998):
| (10) |
| (11) |
where the distance D is expressed in Mpc and and are in Jy. These calculations yielded 30 K and 6.2107 M⊙.
4.6 System Mass Estimate
The traditional methods of mass estimate of a galaxy system are all based on the assumption that the system has reached the virial equilibrium. Numerical simulations (Perea, Del Olmo, & Moles 1990) have shown that such a condition is reached after about three crossing times. Before that time, mass estimators assuming virial equilibrium might lead to considerable errors in mass. Despite the short crossing time we estimated for CG J1720-67.8, we cannot state that this group is already virialized. The presence of an asymmetric optical halo, the strong signs of recent interactions, the prominence of (typically short-lived) tidal features, the interaction induced bursts of star formation, which can be dated 40 – 180 Myr according to evolutionary synthesis models (Temporin & Fritze-von Alvensleben, 2002), are all elements that suggest CG J1720-67.8 is most probably not yet in virial equilibrium. Furthermore, only projected separation among galaxies and radial velocities are known, and the lack of three-dimensional information could lead to large errors in the mass of small groups.
Even so, we attempted to obtain an indication of the system mass by applying the four mass estimators described in Heisler, Tremaine, & Bahcall (1985): virial mass (), projected mass (), median mass (), and average mass (). All of these estimators, except for , are sensitive to the presence of interlopers, but in our case the small radial velocity difference among the group’s members and the evidence of interactions assure the absence of interlopers.
Although Heisler et al. (1985) claimed that calculated under the assumption of equal mass bodies is accurate even in case of galaxies of different mass, Perea et al. (1990) found that the absence of virial equilibrium can result in an overestimate as large as a factor of two of when a weighting over the mass of the galaxies (or alternatively over their luminosity, by assuming an adequate M/L ratio) is not performed. Nevertheless, given the lack of adequate kinematic information, we are not able to estimate the masses of the members of CG J1720-67.8. Albeit estimates of the masses of the three galaxies have been obtained from the comparison of the observed luminosities with the best-fit chemically consistent evolutionary synthesis models taking into account the contribution of the starbursts to the galaxy luminosities (Temporin & Fritze-von Alvensleben, 2002), M/L ratios for the TDG candidates cannot be reliably estimated. Up to date the only example of CG where the masses of candidate TDGs have been measured is Stephan’s Quintet. Its candidate TDGs have been found to have a median M/LB ratio of 7 (Mendes de Oliveira et al., 2001), but with a very large scatter. We find that assuming such a value for our TDG candidates would not be meaningful. Therefore we calculated only the non-weighted virial mass of the group. The application of the four mass estimators cited above gave the following values (expressed in M☉ units): 7.01011, 2.61011, 3.31011, and 8.11011.
We note that the projected mass, less affected by the mass spectrum, is a factor of 2.6 lower than the virial mass.
The lack of sufficient information on the mass of the individual group members (in particular TDG candidates) as well as on the gaseous mass of the group (no radio nor X-ray observations are available for CG J1720-67.8) prevent us from giving an estimate of the dark matter content of the group.
5 FURTHER DISCUSSION AND CONCLUSIONS
We have presented a detailed photometric and spectroscopic study of CG J1720-67.8, a rare example of compact group that allows an observation of the very process whereby galaxies are stripping themselves. We have found that the star formation activity is not confined to the three main galaxies of CG J1720-67.8, but is spread over the whole group, including its extended tidal tail. We have concentrated our attention mainly on the galaxies (objects no. 2, 4, and 1 in order of decreasing luminosity), and we have attempted a quantitative morphological classification and a quantification of the interaction effects on their morphology, by means of bidimensional fitting and bulge-disk decompositions. From our investigation the presence of morphological distortions in all the three galaxies appeared clearly. Despite the application of quantitative methods, an unambiguous morphological classification turned out to be difficult, because these galaxies are already about to loose their identity as a consequence of the interaction processes in which they are involved.
Nonetheless, we conclude that galaxy no. 2, is probably an S0, with a B/T ratio typical of a bulge-dominated system and a bulge which can be well reproduced by a de Vaucouleurs law, once the seeing effects are taken into account. The color analysis of this galaxy shows that it is considerably reddened by dust. Actually its optical spectrum exhibits a red continuum, although its absorption lines indicate that it is dominated by a relatively young (A-type) stellar population, and the presence of emission lines suggests recent star formation activity most likely concentrated in the central part of the galaxy. Emission line ratios and photoionization models indicate that, with its Z 0.5 Z☉, this is the galaxy with the highest metallicity inside the group.
Galaxy 4 appears to be a disk-dominated system with internal structures reminiscent of knotty spiral arms apparently connected with the extended arc-shaped tidal feature of the group. Its spectrum indicates the starburst nature of the galaxy. This is probably an Sc galaxy, whose spiral structure has been already destroyed by the interaction.
Galaxy 1 shows blue colors and the most intense star formation activity inside the group. Its B/T ratio is typical of a bulge-dominated system. Although its surface brightness distribution can be fitted with a de Vaucouleurs bulge plus an exponential disk, a fit with a Sérsic bulge would give a Sérsic index 1, i.e. an exponential bulge, similar to that found in late-type spirals (Andredakis & Sanders, 1994; Andredakis, 1998). The galaxy is somewhat elongated towards galaxy 2, to which it seems to be connected by a bridge of matter. It is not yet clear whether this galaxy is an Scd system, whose outermost layers have been completely stripped away to leave a dominating exponential bulge, or it is a small disk system whose B/T ratio is increased as an effect of a central starburst faking a bulge structure.
The star formation activity of the group is accompanied by a patchy distribution of dust, with a concentration in the north-eastern part of it. However, once the star formation rates estimated from the H emission are considered, the expected FIR flux for this 180 Mpc distant object is only slightly above the IRAS detection limit. Furthermore the Galactic latitude of the group (b 16) locates it in a region of the sky particularly affected by Galactic cirrus in the FIR. This contamination by Galactic cirrus can explain why the group is not cataloged as an IRAS source, although our analysis of IRAS raw data revealed a measurable source at the coordinates of CG J1720-67.8, whose flux is consistent with the measured SFR.
The virial mass of the group estimated by taking into account all the group members is 71011 M⊙, a factor of 2.6 higher than the projected mass. The virial mass could actually be overestimated since the mass spectrum of the group was not taken into account. A comparison with the estimated total mass of the group with the luminous mass is not possible with the data currently available – in particular the mass of TDG candidates as well as the total gas content of the group, cannot be estimated. Therefore no conclusions can be drawn about the dark matter content of the group. Since the dark matter content and distribution play an important role in the evolution of groups (see e.g. numerical simulations by Athanassoula, Makino, & Bosma (1997)), further investigations are needed.
Appendix A Reliability of Optical Photometry
Since there are no (non-saturated) stars in the galaxy group’s frames with cataloged B,V, and R magnitudes available, it was impossible to use some of the stars in these frames either for performing the photometric calibration or for testing in a direct way the one we adopted, thus an alternative way to verify the reliability of the optical photometry had to be followed.
Due to the importance of the use of color indices for the purposes of our analysis, we tried to reveal effects of variations in the atmospheric conditions on the measured colors through photometric measurements of the stars contained in the same frames of CG J1720-67.8. For this purpose we measured 65 non-saturated stars visible in those B, V, and R images, which we used for the photometry of CG J1720-67.8. The magnitudes of the stars were measured with the IRAF task PHOT inside apertures of 4′′ in radius. Errors were calculated according to the following expression:
| (A1) |
where is the flux in ADU inside the aperture of area , is the number of pixels used for the sky determination, is the standard deviation and the CCD gain is expressed in e- ADU-1.
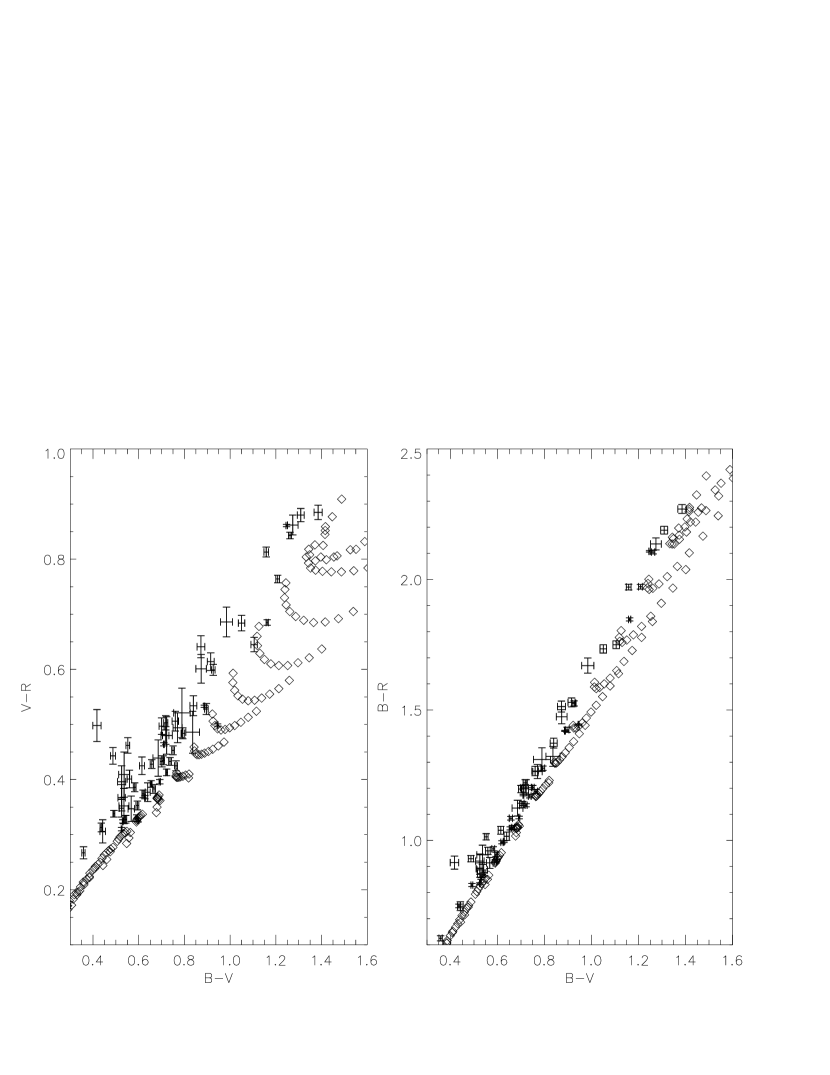
Specifically, we compared the distribution of such field stars in color-color diagrams with the distribution of colors from synthetic spectra calculated by Bessel, Castelli, & Plez (1998) from the Kurucz (1995) grids of model atmospheres. Table 1 of Bessel et al. (1998), containing the synthetic colors, is available via anonymous ftp from cdsarc.u-strasbg.fr. The resulting color-color diagrams in Fig. 12 show agreement within the error measurements between most of the stars and the distribution of the synthetic colors. In fact, except for a few points, most of the stars agree with the synthetic tracks better than 0.05 mag. The 6 deviant points all lie above the synthetic track in both color-color diagrams, indicating that in the R image they appear brighter than expected with respect to their B and V magnitudes. After an inspection of the R image we found that one of these points is a star contaminated by an edge-on background galaxy, which becomes visible only in the deep R image. The other peculiar points correspond to stars lying in crowded regions and contaminated by the halos of saturated stars. Note that a systematic effect in one of the bands would cause a uniform shift of all the observational points above or below the track defined by synthetic points. No such effects can be observed in Fig. 12, therefore if a systematic effect is present, it must be affecting all three bands by the same amount and has no consequences in the optical colors. Although we consider the possibility as unlikely that non-photometric conditions of the sky have generated such an effect, because the images in the three bands were all taken in different nights, we performed a further test to assess the reliability of the optical absolute magnitudes. For this purpose we attempted an alternative procedure for calibrating our images.
New BVR short exposures (240 s in B, 120 s in V and R) of the galaxy group were obtained at the ESO 3.6 m telescope with EFOSC2 and kindly provided by L. Infante. After the application of the standard reduction procedure to these new images, we proceeded as follows:
-
1.
We measured on the new BVR images aperture magnitudes of 10 bright stars, for which and 131313The correct nomenclature for these filters would be J and F, but we adopt here the alternative one and to avoid confusion with the NIR band J. magnitudes are given in the Guide Star Catalog (GSC-2141414http://www-gsss.stsci.edu/gsc/gsc2/GSC2home.htm). We used these stars as standard to calibrate the three images in the system by means of the following transformation equations:
(A2) (A3) (A4) where , and are the instrumental magnitudes measured in the B, V, and R images and kn (n = 1, …, 6) are the zero points and color terms to be determined through the fit to the standard stars.
-
2.
Out of the 65 stars already used for the tests on optical colors, we identified 24 with known and magnitudes in the GSC-2. We measured their aperture magnitudes in the new BVR images and applied the above transformation equations. This operation gave us measured and magnitudes to be compared with the cataloged ones. We found a good agreement between cataloged magnitudes and measured magnitudes obtained from the B and R frames, while the magnitudes obtained from the V frame show significant deviations (0.2 mag on average) from the catalogued magnitude. In the following we use the cataloged magnitudes of these stars, but the measurements and comparison we have done here indicate that the V filter offers a poor match to the system.
-
3.
We selected a set of 15 Landolt standard stars approximately matching in colors the stars in our frames and having and magnitudes available from the GSC-2. We used these stars to obtain the transformation equations from the system to the Johnson-Cousins BVR system:
(A5) (A6) (A7) which yielded the following color terms: = 0.0710.026, = -0.5740.015, and = 0.0300.015. When the fits are evaluated on the standard stars themselves (IRAF task PHOTCAL.EVALFIT) they give median residuals with respect to the cataloged values of -0.019 in B, -0.024 in V and 0.003 in R, with large scatters (up to 0.2 mag) in B and V. Therefore the photometric system transformation will be a significant source of error especially in the calibration of B and V bands.
-
4.
We applied the transformations (A5), (A6), and (A7) to the set of 24 faint stars with known magnitudes selected in the field of view of the galaxy group (see point 2 above). Thus we obtained a set of non-saturated BVR stars to be used as standard for the calibration of our original BVR images. We used transformation equations analogous to (1), (2), and (3) (Section 3.2), only omitting the term concerning the atmospheric extinction correction, which is now implicitly included in the zero point of the photometric system. The newly found zero points, B = 25.630.07, V = 25.850.03, and R = 25.920.04, agree within the errors with the zero points we have used to calibrate the optical images of the galaxy group (once the extinction correction has been included, see Section 3.2); in fact the differences between the zero points we used and the new ones are -0.03, -0.09, and -0.008 in B, V, and R, respectively. Note that the errors reported here are the ones given by the IRAF task PHOTCAL.FITPARAM by performing a uniformly weighted fit, therefore they do not account for the errors due to the transformation between the and the Johnson-Cousins BVR system. Furthermore the V band is badly calibrated with magnitudes as seen in point 2 above. The errors given by FITPARAM for the color terms are comparable to the values themselves, and again this is an underestimate of the actual error.
-
5.
We finally applied the new calibration to all the 65 stars previously used for the optical color reliability test and we built again color-color diagrams analogous to those in Fig. 12. The result is shown in Fig. 13. The match of the observational points to the synthesized tracks is considerably poorer than the one in Fig. 12, especially for redder colors. This is probably a consequence of the numerous sources of errors in the transformations applied to obtain the new photometric calibration.
We conclude that an alternative calibration based on cataloged stars with known and magnitudes would be still consistent with the one we adopted, but would be affected by larger errors.
References
- Andredakis (1998) Andredakis, Y. C. 1998, MNRAS, 295, 725
- Andredakis & Sanders (1994) Andredakis, Y. C. & Sanders, R. H. 1994, MNRAS, 267, 283
- Athanassoula, Makino, & Bosma (1997) Athanassoula, E., Makino, J., & Bosma, A. 1997, MNRAS, 286, 825
- Barnes (1990) Barnes, J. E. 1990, Nature, 344, 379
- Bertin & Arnouts (1996) Bertin, E. & Arnouts, S. 1996, A&A, 117, 393
- Bessel, Castelli, & Plez (1998) Bessel, M. S., Castelli, F., & Plez, B. 1998, A&A, 333, 231
- Bontekoe et al. (1994) Bontekoe, Tj. R., Koper, E., & Kester, D. J. M. 1994, A&A, 284, 1037
- Borne et al. (2000) Borne, K. D., Bushouse, H., Lucas, R. A., & Colina, L. 2000, ApJ, 529, L77
- Bregman et al. (1998) Bregman, J. N., Snider, B. A., Grego, L., & Cox, C. V. 1998, ApJ, 499, 670
- Buta & Williams (1995) Buta, R. & Williams, K. L. 1995, AJ, 109, 543
- Cardelli, Clayton, & Mathis (1989) Cardelli, J. A., Clayton, G. C., & Mathis, J. S. 1989, ApJ, 345, 245
- Carollo et al. (2001) Carollo, C. M., Stiavelli, M., de Zeeuw, P. T., Seigar, M., & Dejonghe, H. 2001, ApJ, 546, 216
- Corsini et al. (1999) Corsini, E. M. et al. 1999, A&A, 342, 671
- Coziol et al. (1998) Coziol, R., Ribeiro, A. L. B., de Carvalho, R. R., & Capelato, H. V. 1998, ApJ, 493, 563
- Denicoló et al. (2001) Denicoló, G., Terlevich, R., & Terlevich, E. 2001, preprint, astro-ph0110356 (MNRAS in press)
- Dopita & Sutherland (1995) Dopita, M. A. & Sutherland, R. S. 1995, ApJ, 455, 468
- de Vaucouleurs (1948) de Vaucouleurs, G. 1948, Ann. Astrophys., 11, 247
- de Vaucouleurs et al. (1991) de Vaucouleurs, G., de Vaucouleurs, A., Corwin, H., Buta, R., Paturel, G., & Forqué, P. 1991, Third Reference Catalogue of Bright Galaxies (Springer, New York)
- Ferland (1996) Ferland, G. 1996, Hazy, a Brief Introduction to Cloudy 90.04, Univ. of Kentucky, Department of Physics and Astronomy, Internal Report
- Galaz (2000) Galaz, G. 2000, AJ, 119, 2118
- Heisler et al. (1985) Heisler, J., Tremaine, S., & Bahcall, J. N. 1985, ApJ, 298, 8
- Helou, Soifer, & Rowan-Robinson (1985) Helou, G., Soifer, B. T., & Rowan-Robinson, M. 1985, ApJ, 298, L7
- Hickson et al. (1992) Hickson, P., Mendes de Oliveira, C., Huchra, J. P., & Palumbo, G. G. C. 1992, ApJ, 399, 353
- Ho, Filippenko, & Sargent (1993) Ho, L. C., Filippenko, A. V., & Sargent, W. L. W. 1993, ApJ, 417, 63
- Hunter & Gallagher (1986) Hunter, D., A. & Gallagher, J. S. 1986, PASP, 98, 5
- Hunter et al. (1986) Hunter, D., A., Gillet, F. C., Gallagher, J. S., Rice, W. L., Low, F. J. 1986, ApJ, 303, 171
- Jones, Ponman, & Forbes (2000) Jones, L. R., Ponman, T. J., & Forbes, D. A. 2000, MNRAS, 312, 139
- Kauffmann et al. (1999) Kauffmann, G., Colberg, J., Diaferio, A., & White, S. D. M. 1999, MNRAS, 303, 188
- Kurucz (1995) Kurucz, R. L. 1995, CD-ROM No. 23
- Landolt (1992) Landolt, A. U. 1992, AJ, 104, 340
- Larson (1990) Larson, R. B. 1990, PASP, 102, 709
- McGaugh (1991) McGaugh, S. S. 1991, ApJ, 380, 140
- Mendes de Oliveira et al. (2001) Mendes de Oliveira, C., Plana, H., Amram, P., Balkowski, C., & Bolte, M. 2001, AJ, 121, 2524
- Mulchaey & Zabludoff (1999) Mulchaey, J. S. & Zabludoff, A. I. 1999, ApJ, 514, 133
- Perea et al. (1990) Perea, J., Del Olmo, A., & Moles, M. 1990, A&A, 237, 319
- Persson et al. (1998) Persson, S. E., Murphy, D. C., Krzeminski, W., Roth, M., & Rieke, M. J. 1998, AJ, 116, 2475
- Ponman et al. (1994) Ponman, T. J., Allan, D. J., Jones, L. R., Merrifield, M., McHardy, I. M., et al. 1994, Nature, 369, 462
- Rauch, Haehnelt, & Steinmetz (1997) Rauch, M., Haehnelt, M. G., & Steinmetz, M. 1997, ApJ, 481, 601
- Rose (1984) Rose, J. A. 1984, AJ, 89, 1238
- Rubin, Waterman, & Kenney (1999) Rubin, V. C., Waterman, A. H., & Kenney, J. D. P. 1999, AJ, 118, 236
- Schlegel, Finkbeiner, & Davis (1998) Schlegel, D. J., Finkbeiner, D. P., & Davis, M. 1998, ApJ, 500, 525
- Sérsic (1968) Sérsic, J. L. 1968, Atlas de galaxias australes, Observatorio Astronomico, Cordoba
- Simard (1998) Simard, L. 1998, in Astronomical Data Analysis Software Systems VII, eds Albrecht, R., Hook, R. N., and Bushouse, H. A., ASP Conf. Ser., 145, 108
- Simard et al. (2001) Simard, L. et al. 2001, preprint, http:// nenuphar.as.arizona.edu/simard/gim2d/paper/
- Stetson & Harris (1988) Stetson, P. B. & Harris, W. E. 1988, AJ, 96, 909
- Temporin & Fritze-von Alvensleben (2002) Temporin, S. & Fritze-von Alvensleben, U. 2002, ApJ, submitted
- Temporin et al. (2002) Temporin, S., Weinberger, R., Galaz, G. & Kerber, F. 2002, ApJ, submitted
- Tran et al. (2001) Tran, K.-V. H., Simard, L., Zabludoff, A. I., & Mulchaey, J. S. 2001, ApJ, 549, 172
- Vikhlinin et al. (1999) Vikhlinin, A., McNamara, B. R., Hornstrup, A., Quintana, H., Forman, W., Jones, C., & Way, M. 1999, ApJ, 520, L1
- Veilleux & Osterbrock (1987) Veilleux, S. & Osterbrock, D. E. 1987, ApJS, 63, 295
- Weinberger, Temporin, & Kerber (1999) Weinberger, R., Temporin, S., & Kerber F. 1999, ApJ, 522, L17 (Paper I)
- Worthey (1994) Worthey, G. 1994, ApJS, 95, 107
- Young et al. (1989) Young, J. S., Xie, S., Kenney, J. D. P., & Rice, W. L. 1989, ApJS, 70, 699


| Telescope | Instrument | Filter/Grism/Mask | Date | Exp. Time | Seeing | Spatial Scale | Spec. Res. aaSpectral resolution at 6800 Å, i.e. at the redshifted H wavelength. | Disp. | Spec. Range bbSpectral ranges given for MOS spectra are only indicative, as the actual spectral range was changing with the position of the slitlets on the field. |
|---|---|---|---|---|---|---|---|---|---|
| (s) | (′′) | (′′ px-1) | (Å) | (Åpx-1) | (Å) | ||||
| ESO 3.6m | EFOSC1 | Johnson IccThe I-band image could not be calibrated. | 1995 Jun 28 | 900 | 1.6 | 0.61 | |||
| ESO-MPIA 2.2m | EFOSC2 | GR#6 | 1997 May 4 | 1200 | 1 | 0.262 | 12 | 2.052 | 3850 – 7950 |
| Du Pont 2.5m | Mod. Spec. | Grat. 600 l/mm | 1998 Feb 13 | 1500 | 1 | 0.56 | 4 | 2.005 | 3770 – 7180 |
| Du Pont 2.5m | CCD Tek#5 | Johnson V | 1998 Feb 15 | 900 | 1.7 | 0.259 | |||
| ESO 3.6m | EFOSC2 | Johnson R | 1999 Jun 7 | 480 | 1.3 | 0.157 | |||
| ESO 3.6m | EFOSC2 | Johnson B | 1999 Jun 7 | 900 | 1.5 | 0.157 | |||
| ESO 3.6m | EFOSC2 | Johnson R | 1999 Jun 15 | 3 600s | 1.5 | 0.157 | |||
| ESO 3.6m | EFOSC2 | Johnson B | 1999 Jun 15 - 16 | 2 1800s | 1.6 | 0.157 | |||
| ESO 3.6m | EFOSC2 | Johnson V | 1999 Jun 16 | 600 | 1.8 | 0.157 | |||
| ESO 3.6m | EFOSC2-MOS | GR#11 M#1 | 1999 Jun 16 | 1800 | 1.4 | 0.157 | 19 | 2.05 | 3350 – 7560 |
| ESO 3.6m | EFOSC2-MOS | GR#11 M#2 | 1999 Jun 16 | 1800 | 1.4 | 0.157 | 19 | 2.05 | 3350 – 7560 |
| ESO 3.6m | EFOSC2-MOS | GR#11 M#3 | 1999 Jun 16 | 1800 | 1.4 | 0.157 | 19 | 2.05 | 3350 – 7560 |
| ESO 3.6m | EFOSC2-MOS | GR#11 M#4 | 1999 Jun 16 | 1800 | 1.4 | 0.157 | 19 | 2.05 | 3350 – 7560 |
| ESO 3.6m | EFOSC2-MOS | GR#11 M#5 | 1999 Jun 16 | 1800 | 1.4 | 0.157 | 19 | 2.05 | 3350 – 7560 |
| Swope 1m | IRC-NICMOS3 | J | 2000 Apr 22 | 90 20s | 1.4 | 0.1498ddSpatial resolution after subpixeling the original resolution of 0.599 ”/pix (0.599/4). | |||
| Swope 1m | IRC-NICMOS3 | H | 2000 Apr 22 | 40 50s | 1.5 | 0.1498ddSpatial resolution after subpixeling the original resolution of 0.599 ”/pix (0.599/4). | |||
| Swope 1m | IRC-NICMOS3 | Ks | 2000 Apr 22 | 50 50s | 1.4 | 0.1498ddSpatial resolution after subpixeling the original resolution of 0.599 ”/pix (0.599/4). |
| Line | Spec. 1 | Spec. 1 | Spec. 1a | Spec. 2 | Spec. 4 | Spec. 4 |
|---|---|---|---|---|---|---|
| OII 3727 | 2.380.36 | 1.790.29 | 2.050.70 | 3.862.28 | … | 0.920.30 |
| 3.26 | 2.28 | 3.70 | 6.23 | … | 1.70 | |
| H | 0.390.18 | 0.420.14 | … | … | … | … |
| 0.49 | 0.49 | … | … | … | … | |
| H | 0.420.06 | 0.420.05 | 0.390.24 | … | … | … |
| 0.49 | 0.47 | 0.53 | … | … | … | |
| OIII 4959 | 0.650.05 | 0.630.04 | 1.020.47 | 0.410.26 | 0.070.06 | … |
| 0.64 | 0.62 | 0.98 | 0.40 | 0.07 | … | |
| OIII 5007 | 1.920.08 | 1.890.08 | 2.090.71 | 0.990.58 | 0.250.12 | 0.280.12 |
| 1.85 | 1.84 | 1.95 | 0.81 | 0.23 | 0.26 | |
| HeI 5876 | 0.200.03 | 0.170.03 | … | … | 0.160.08 | 0.090.04 |
| 0.16 | 0.14 | … | … | 0.10 | 0.06 | |
| OI 6300 | 0.090.03 | 0.090.03 | … | 1.340.84 | 0.180.06 | 0.090.05 |
| 0.06 | 0.07 | … | 0.81 | 0.10 | 0.05 | |
| NII 6548 | 0.310.05 | 0.330.06 | 0.270.23 | 1.110.85 | 0.490.20 | 0.390.18 |
| 0.21 | 0.25 | 0.13 | 0.63 | 0.24 | 0.19 | |
| H | 4.150.17 | 3.800.15 | 5.771.62 | 5.052.17 | 5.760.86 | 5.941.07 |
| 2.85 | 2.85 | 2.85 | 2.85 | 2.85 | 2.85 | |
| NII 6583 | 0.700.06 | 0.670.06 | 0.800.34 | 2.561.33 | 1.860.35 | 1.200.34 |
| 0.48 | 0.50 | 0.39 | 1.44 | 0.91 | 0.57 | |
| SII 6717 | 0.530.10 | 0.440.07 | 0.950.45 | 1.360.95 | 1.000.28 | 0.690.24 |
| 0.35 | 0.32 | 0.45 | 0.74 | 0.47 | 0.32 | |
| SII 6731 | 0.420.10 | 0.350.06 | 0.980.44 | 1.060.86 | 0.730.22 | 0.600.23 |
| 0.28 | 0.26 | 0.46 | 0.57 | 0.34 | 0.27 | |
| F(H) | 89.03.0 | 67.162.01 | 9.42.1 | 14.25.0 | 16.302.12 | 28.04.0 |
| 277.0 | 160.6 | 79.9 | 80.0 | 137.4 | 261.0 | |
| E(B-V) | 0.340.04 | 0.170.03 | 0.650.26 | 0.520.39 | 0.560.14 | 0.670.16 |
Note. — Bold-face numbers are extinction-corrected intensities. All fluxes and intensities are relative to H; F(H) is in units of 10-16 erg cm-2 s-1. Spectra 1, 1, and 1a are all referred to galaxy 1 (see section 4 for further explanations); spectra 4 and 4 are centered on galaxy 4 at P.A. = 130° and P.A. = 90°, respectively.
| Line | Obj. 3 | Obj. 7 | Obj. 8 | Obj. 9 | Obj. 10 |
|---|---|---|---|---|---|
| OII 3727 | … | 4.190.80 | 3.801.52 | 3.931.65 | 2.551.45 |
| … | 6.06 | 4.37 | 6.32 | 2.57 | |
| H | … | 0.480.18 | … | … | … |
| … | 0.58 | … | … | … | |
| OIII 4959 | 0.560.50 | 0.850.24 | 1.020.62 | … | … |
| 0.53 | 0.83 | 1.01 | … | … | |
| OIII 5007 | 1.090.62 | 2.430.49 | 1.860.76 | 1.811.00 | 0.590.41 |
| 1.00 | 2.33 | 1.83 | 1.71 | 0.59 | |
| NII 6548 | 0.720.64 | 0.270.29 | 0.280.43 | 0.380.64 | … |
| 0.31 | 0.17 | 0.24 | 0.22 | … | |
| H | 6.673.07 | 4.430.84 | 3.371.35 | 5.031.81 | 2.881.44 |
| 2.85 | 2.85 | 2.85 | 2.85 | 2.85 | |
| NII 6583 | 1.681.01 | 0.760.35 | 0.850.59 | 1.130.85 | 0.390.37 |
| 0.71 | 0.49 | 0.72 | 0.64 | 0.39 | |
| SII 6717 | 2.372.37 | 1.060.39 | 0.740.44 | 1.700.93 | … |
| 0.96 | 0.66 | 0.62 | 0.93 | … | |
| SII 6731 | 1.421.85 | 0.920.38 | 0.640.44 | 1.020.65 | … |
| 0.57 | 0.57 | 0.53 | 0.55 | … | |
| F(H) | 7.93.2 | 13.02.0 | 7.02.0 | 3.50.9 | 8.93.0 |
| 104.0 | 48.0 | 11.7 | 19.3 | 9.2 | |
| E(B-V) | 0.780.42 | 0.400.17 | 0.150.36 | 0.520.33 | 0.010.67 |
Note. — Bold-face numbers are extinction-corrected intensities. All the fluxes and intensities are relative to H; F(H) is in units of 10-16 erg cm-2 s-1.
| Band | Galaxy 1 | Galaxy 2 | Galaxy 4 | ||||||||
|---|---|---|---|---|---|---|---|---|---|---|---|
| (1) | (2) | (3) | (1) | (2) | (3) | (1) | (2) | (3) | |||
| B | 17.69 | 0.34 | 17.36 | 17.35 | 0.89 | 16.46 | 16.45 | 0.47 | 15.97 | ||
| V | 17.17 | 0.29 | 16.89 | 16.37 | 0.80 | 15.58 | 15.81 | 0.39 | 15.42 | ||
| R | 16.84 | 0.26 | 16.58 | 15.87 | 0.75 | 15.12 | 15.26 | 0.35 | 14.91 | ||
| J | 15.06 | 0.08 | 14.98 | 14.04 | 0.24 | 13.81 | 13.10 | 0.12 | 13.88 | ||
| H | 14.60 | 0.05 | 14.54 | 13.36 | 0.15 | 13.21 | 13.48 | 0.07 | 13.40 | ||
| Ks | 14.49 | 0.03 | 14.46 | 13.15 | 0.10 | 13.06 | 13.27 | 0.05 | 13.22 | ||
| BV | 0.52 | 0.05 | 0.47 | 0.98 | 0.10 | 0.88 | 0.64 | 0.08 | 0.55 | ||
| VR | 0.33 | 0.03 | 0.30 | 0.50 | 0.05 | 0.46 | 0.55 | 0.04 | 0.51 | ||
| JH | 0.47 | 0.03 | 0.43 | 0.68 | 0.09 | 0.59 | 0.52 | 0.04 | 0.48 | ||
| HKs | 0.11 | 0.02 | 0.09 | 0.21 | 0.05 | 0.16 | 0.21 | 0.03 | 0.18 | ||
| JKs | 0.57 | 0.05 | 0.52 | 0.89 | 0.14 | 0.75 | 0.73 | 0.07 | 0.66 | ||
| VKs | 2.68 | 0.25 | 2.43 | 3.22 | 0.70 | 2.52 | 2.54 | 0.34 | 2.20 | ||
Note. — For each galaxy, col. (1) lists observed magnitudes and colors after Galactic extinction correction (extinction values from NED, based on Schlegel et al. (1998)); col. (2) lists internal extinctions and corresponding color excesses derived as a function of morphological type and disk inclination according to RC3; col. (3) lists magnitudes corrected for Galactic and internal extinction.
| Galaxy 1 | Galaxy 2 | Galaxy 4 | ||||||||||||||||||
|---|---|---|---|---|---|---|---|---|---|---|---|---|---|---|---|---|---|---|---|---|
| Param. | B | V | R | J | H | Ks | B | V | R | J | H | Ks | B | V | R | J | H | Ks | ||
| B/T | 1.00aaA comparably good fit with a Sérsic bulge gives B/T = 0.4. | 0.44 | 0.56 | 0.67 | 0.71 | 0.71 | 0.71 | 0.29 | 0.44 | 0.56 | 0.63 | 0.63 | 0.19 | 0.22 | 0.29 | 0.47 | 0.57 | 0.58 | ||
| (arcsec) | 2.69 | 1.23 | 2.18 | 0.21 | 0.19 | 0.04 | 1.89 | 0.21 | 0.45 | 0.55 | 0.59 | 0.53 | 3.50 | 4.35 | 4.09 | 2.60 | 2.49 | 1.87 | ||
| (arcsec) | 1.92 | 7.78 | 4.83 | 4.52 | 4.15 | 1.61 | 2.15 | 1.57 | 1.52 | 1.87 | 2.26 | 2.29 | 4.37 | 4.20 | 4.16 | 4.09 | 4.00 | 4.29 | ||
| (arcsec) | 2.69 | 6.27 | 4.57 | 0.53 | 0.41 | 9.67 | 2.47 | 1.82 | 1.48 | 1.42 | 1.36 | 1.26 | 6.75 | 6.63 | 6.34 | 4.96 | 4.34 | 3.87 | ||
| 0.19 | 0.53 | 0.47 | 0.70 | 0.55 | 0.27 | 0.38 | 0.70 | 0.56 | 0.26 | 0.32 | 0.39 | 0.70 | 0.70 | 0.64 | 0.55 | 0.61 | 0.65 | |||
| (°) | 36.0 | 72.2 | 79.0 | 93.1 | 86.7 | 79.4 | 169.4 | 169.7 | 168.1 | 128.1 | 167.8 | 165.0 | 123.0 | 124.4 | 128.4 | 121.8 | 124.6 | 122.5 | ||
| (°) | 41.8 | 158.7 | 20.27 | 131.8 | 135.4 | 82.4 | 97.2 | 211.2 | 212.9 | 71.2 | 88.8 | 102.6 | 175.5 | 186.9 | 183.6 | 183.7 | 189.1 | 184.3 | ||
| (°) | 39.6 | 75.5 | 68.7 | 68.0 | 68.2 | 64.5 | 60.9 | 8.6 | 3.6 | 16.7 | 39.3 | 41.1 | 46.0 | 43.0 | 20.0 | 43.1 | 57.4 | 62.7 | ||
| RT | 0.04 | 0.07 | 0.09 | 0.02 | 0.03 | 0.07 | 0.04 | 0.02 | 0.01 | 0.03 | 0.00 | 0.01 | 0.10 | 0.07 | 0.05 | 0.02 | 0.01 | 0.01 | ||
| RA | 0.13 | 0.11 | 0.19 | 0.06 | 0.04 | 0.00 | 0.14 | 0.06 | 0.02 | 0.07 | 0.02 | 0.01 | 0.10 | 0.17 | 0.08 | 0.06 | 0.00 | 0.02 | ||
| 2.40 | 1.55 | 2.35 | 1.32 | 1.13 | 1.18 | 2.06 | 1.53 | 1.52 | 1.78 | 1.21 | 1.04 | 3.10 | 3.24 | 1.77 | 1.25 | 1.13 | 0.99 | |||
| Object Id. | (J2000) | (J2000) | Vhel | ErroraaThe calibration error is calculated at the H wavelength. |
|---|---|---|---|---|
| (h m s) | (∘ ′ ′′) | (km s-1) | (km s-1) | |
| 1 | 17 20 27.8 | -67 46 20.8 | 13430 1 | 14 |
| 1a | … | … | 13708 12 | 21 |
| 1b | … | … | 13756 15 | 21 |
| 2 | 17 20 28.8 | 67 46 25.2 | 13558 4 | 14 |
| 3 | 17 20 29.8 | 67 46 30.6 | 13523 4 | 14 |
| 4 | 17 20 28.7 | 67 46 31.4 | 13427 10 | 17 |
| 5 | 17 20 27.9 | 67 46 27.9 | 13641 19 | 21 |
| 6bbThe radial velocity of obj. 6 rests on H and [SII] lines, all having a very low SNR. | 17 20 29.6 | 67 46 34.3 | 13639 88 | 17 |
| 7 | 17 20 26.4 | 67 46 45.7 | 13211 13 | 23 |
| 8 | 17 20 26.0 | 67 46 43.3 | 13197 11 | 17 |
| 9 | 17 20 29.7 | 67 46 33.1 | 13584 24 | 37 |
| 10 | 17 20 27.8 | 67 46 42.9 | 13154 20 | 31 |
| 11ccThe radial velocity of obj. 11 is based on the only detectable emission line, which was assumed to be [O II] 3727. | 17 20 25.8 | 67 46 30.4 | 13861 69 | 39 |
| Spectrum Id. | LHα | SFR | SFRD |
|---|---|---|---|
| (1040 erg s-1) | (M☉ yr-1) | (10-8 M☉ yr-1 pc-2) | |
| 1* | 30.82 | 2.18 | 21.22 |
| 1a | 8.89 | 0.63 | 11.97 |
| 2 | 8.93 | 0.63 | 11.03 |
| 4 | 15.26 | 1.08 | 9.98 |
| 4* | 28.97 | 2.05 | 19.51 |
| Model Param. | Obj. 1 | Obj. 1a | Obj. 2 | Obj. 4 |
|---|---|---|---|---|
| T∗ (104 K) | 4.0 | 4.0 | 4.0 | 4.0 |
| Z/Z⊙ | 0.18 | 0.18 | 0.45 | 0.08 |
| N/N⊙ | 0.14 | 0.14 | 0.45 | 0.08 |
| O/O⊙ | 0.16 | 0.16 | 0.58 | 0.08 |
| S/S⊙ | 0.18 | 0.18 | 0.45 | 0.09 |
| U (10-4) | 6.98 | 7.50 | 2.49 | 2.21 |
| NH (102cm-3) | 1.35 | 1.33 | 2.47 | 3.12 |
| Line | Obj. 1 | Obj. 1a | Obj. 2 | Obj. 4 |
|---|---|---|---|---|
| OII 3727 | 3.260.15 | 3.700.34 | 6.230.59 | 1.700.33 |
| 3.62, 5.6E-1 | 3.54, 1.8E-2 | 5.07, 1.5E-1 | 2.58, 2.5E+0 | |
| H | 0.480.46 | … | … | … |
| 0.27, 3.0E+0 | … | … | … | |
| H | 0.490.14 | 0.530.61 | … | … |
| 0.48, 4.0E-2 | 0.48, 3.4E-2 | … | … | |
| OIII 4959 | 0.640.08 | 0.980.46 | 0.400.63 | 0.080.46 |
| 0.64, 2.4E-3 | 0.69, 8.1E-1 | 0.18, 3.6E+0 | 0.08, 1.3E-3 | |
| OIII 5007 | 1.850.04 | 1.950.34 | 0.940.59 | 0.260.43 |
| 1.85, 4.3E-3 | 2.21, 6.1E-3 | 0.53, 1.8E+0 | 0.23, 1.1E-1 | |
| HeI 5876 | 0.160.15 | … | … | 0.060.44 |
| 0.13, 1.7E+0 | … | … | 0.13, 8.1E0 | |
| OI 6300 | 0.060.33 | … | 0.810.63 | 0.050.55 |
| 0.05, 6.4E-1 | … | 0.18, 3.2E+1 | 0.06, 5.4E-2 | |
| NII 6548 | 0.210.13 | 0.130.85 | 0.630.77 | 0.190.46 |
| 0.21, 4.7E-4 | 0.20, 4.2E-1 | 0.50, 1.2E-1 | 0.19, 6.9E-4 | |
| H | 2.850.04 | 2.850.28 | 2.850.43 | 2.850.18 |
| 2.85,5.0E-5 | 2.85, 1.2E-10 | 2.87, 3.1E-4 | 2.89, 6.7E-3 | |
| NII 6583 | 0.480.08 | 0.390.43 | 1.440.52 | 0.570.28 |
| 0.61, 1.3E+1 | 0.60, 1.5E+0 | 1.46, 9.1E-4 | 0.57, 2.6E-4 | |
| SII 6716 | 0.350.18 | 0.450.47 | 0.740.70 | 0.320.35 |
| 0.34, 2.2E-2 | 0.33, 6.2E-1 | 0.75, 1.1E-4 | 0.30, 3.9E-2 | |
| SII 6731 | 0.280.24 | 0.460.45 | 0.570.81 | 0.270.38 |
| 0.27, 5.3E-2 | 0.26, 3.2E+0 | 0.62, 1.4E-2 | 0.26, 1.6E-2 |
Note. — Line intensities are relative to H. For every emission line, the observed values with relative errors are in the first row and the modeled values with the of the fit to the line are in the second row, in bold type.