A census of metals at high and low redshift and the connection between submillimetre sources and spheroid formation.
Abstract
Deep surveys in many wavebands have shown that the rate at which stars were forming was at least a factor of 10 higher at redshifts than today. Heavy elements (‘metals’) are produced by stars, and the star formation history deduced by these surveys implies that a significant fraction of all metals in the universe today should already exist at . However, only 10% of the total metals expected to exist at this redshift have so far been accounted for (in Damped Lyman Alpha absorbers and the Lyman forest). In this paper, we use the results of submillimetre surveys of the local and high redshift universe to show that there was much more dust in galaxies in the past. We find that a large proportion of the missing metals are traced by this dust, bringing the metals implied from the star formation history and observations into agreement. We also show that the observed distribution of dust masses at high redshift can be reproduced remarkably well by a simple model for the evolution of dust in spheroids, suggesting that the descendants of the dusty galaxies found in deep submm surveys are the relatively dust-free spiral bulges and ellipticals in the universe today.
keywords:
galaxies:evolution – galaxies:ISM – galaxies:luminosity function, mass function – submillimetre – (ISM):dust, extinction1 Introduction
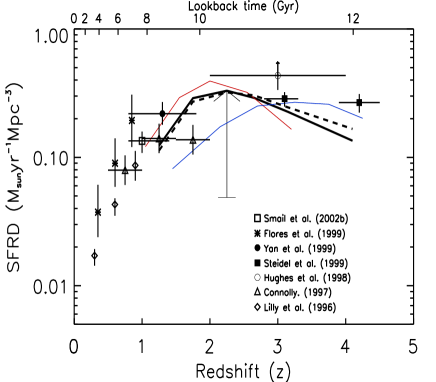
The star formation history (SFH) of the universe deduced from optical/UV surveys (Lilly et al. 1996; Madau et al. 1996, 1998) has recently been revised to account for dust extinction (Steidel et al. 1999), largely motivated by the detection of a population of dusty star-forming objects in deep submm surveys with SCUBA (Hughes et al. 1998; Eales et al. 1999; Smail, Ivison & Blain 1997; Scott et al. 2002). The current best estimate of the SFH is that the global star-formation rate in the universe was fairly constant over the redshift interval , falling by a factor to the present epoch, see Fig. 1. (Steidel et al. 1999; Ivison et al. 2002). A simple integration of this history implies that % of all stars and metals today should have formed by a redshift of .111In a flat cosmology. However, the metal content of objects believed to contain most of the baryonic matter at high-z – principally the Lyman alpha forest and damped Lyman alpha absorption systems (DLAs)– is only 2.5% of the total amount of metals in the universe today (Pettini 1999; Pagel 2002). Thus 90% of metals expected to exist at have not yet been seen or recognised – the ‘missing metals’.
The submm surveys revealed a population of extremely dusty and obscured objects with very high bolometric luminosities, probably residing at high redshifts, (Dunlop 2001a; Ivison et al. 2002). If the dust is heated by stars, the star formation rates implied by the submm fluxes are , high enough to produce an entire galaxy worth of stars in Gyr. Since the properties of low-redshift ellipticals suggest that most of their stars formed quickly at high redshift (Bower et al. 1992; Renzini 1997; Jimenez et al. 1999), several authors have argued that the SCUBA sources may be elliptical galaxies in the process of formation (Lilly et al. 1999; Eales et al. 2000; Dunlop 2001b; Granato et al. 2001). It has been claimed (Cen & Ostriker 1999) that the regions of greatest over-density in the universe at any epoch are the most metal enriched, and that these regions will have reached a given metallicity much earlier than lower density environments. This argument suggests that SCUBA galaxies should be a large reservoir for metals at high redshift, since if they are proto-ellipticals they should have formed from the highest density peaks at high redshift when there has been less time for pollution of the low density inter-galactic medium (IGM).
In this paper, we wish to investigate the connection between the ‘missing metals’, the formation of the spheroids and the dusty sources seen by SCUBA. However, instead of using the bolometric luminosities of the submm sources to infer their physical properties, we interpret the results of the deep submm surveys and our submm survey of the nearby universe in a completely different way, by carrying out the first investigation into the cosmic evolution of the dust mass in galaxies. This provides a new way of looking at the chemical evolution of the universe, as there is evidence that the fraction of ISM metals which are bound up in dust grains is percent, a value which seems remarkably constant from galaxy to galaxy and which also appears to apply at higher redshifts (Issa, MaClaren & Wolfendale 1990; Edmunds 2001; Pei, Fall & Hauser 1999; James et al. 2002). We will determine the dust content of the low and high-z universe by constructing dust mass functions, i.e. the space densities of galaxies as a function of dust mass. At low-z, we will use the results of the SCUBA Local Universe Galaxy Survey (Dunne et al. 2000), the first attempt at an unbiased submm survey of the local universe. For the high redshift dust mass function, we will use submm data from the deep SCUBA submm surveys. In Section 4 we will use these dust mass functions, together with a simple chemical evolution model, to estimate the co-moving density of metals and baryons associated with the ISM of galaxies at low and high redshift. Finally, we will produce a simple prediction for the dust mass function of the spheroids during the epoch in which they had their maximum dust masses, and compare with our observational estimate of the dust mass function of the SCUBA sources.
2 Dust Masses from Submillimetre Fluxes
Dust mass can be calculated from the submm flux according to
| (1) |
where is the distance for the assumed cosmology and is the observed flux. The dust mass opacity coefficient normalises the submm emission for a given dust mass and is currently measured only at FIR wavelengths and then extrapolated to the submm with a dependency. We have taken the average value from the following sources of , where the is the error on the mean value (Hildebrand 1983; Draine & Lee 1984; Krügel, Steppe & Chini 1990; Sodroski et al. 1997; Bianchi, Davies & Alton 1999). We use (for which there is compelling evidence from our local survey and elsewhere, Dunne & Eales 2001 and references within) to extrapolate to the rest wavelength of the submm emission (m for an 850m source at ). This agrees with the recent estimation of using a different technique (James et al. 2002).
We also require the value of , which is a mass-weighted dust temperature. Submillimetre and ISO observations of many nearby galaxies have shown that, when enough data is present, the SED is best described by dust at more than one temperature (Haas et al. 1998,2000; Frayer et al. 1999; Braine et al. 1997; Dumke et al. 1997, Calzetti et al. 2000; Guélin et al. 1995; Sievers et al. 1994; Neininger et al. 1996; Alton et al. 1998, 2001; Papadopoulos & Seaquist 1999; Reach et al. 1995; Trewhella et al. 2000). For our local SCUBA survey of bright IRAS galaxies, we found that in addition to the typical ‘IRAS-detected’ dust at K, a colder dust component at K was required in all cases (Dunne & Eales 2001), even for highly luminous galaxies such as Arp 220. Klaas et al. (2001) also find that the SEDs of 41 local ULIRGs are best represented by a combination of warm and cold dust. Following the notation of the two-component SED model from Dunne & Eales (2001), the value which should enter Eqn. 1 can be approximated by
| (2) |
where is the characteristic temperature of the cold/warm dust, and is the ratio of mass in the cold/warm components. For the local survey, the value of was 21.3 K, with a standard error in the mean for the population of 0.5 K. This mass-weighted temperature should not be confused with the dust temperature traditionally used to estimate bolometric luminosity, which should be the temperature defining the peak in the spectrum. Since we are not integrating the SED and have observations at wavelengths longer than the peak, our estimation of the dust mass from a single submm flux is not as sensitive to temperature as an estimate of the bolometric luminosity would be. In local galaxies, including ULIRGs, most dust is contained in the cold K component, which means we do not need to worry about the location of the peak in the SED; the temperature of the warm dust has a negligible effect on the dust mass estimate, providing . For the local objects, we use for each galaxy in our survey (Dunne & Eales 2001).
The biggest uncertainty in our analysis is our lack of knowledge of in the high redshift SCUBA galaxies. As discussed above, there is now a lot of evidence that most of the dust in low redshift FIR sources, including ULIRGs, is at a relatively cold temperature. It will not be possible to perform a similar analysis of the temperature of dust in high redshift galaxies because of the lack of instruments operating at wavelengths long enough to sample the rest-frame emission from the cold dust (i.e. 850m in the rest-frame). It is difficult to determine the existence of a colder dust component without many fluxes at wavelengths at and beyond the peak in the SED. It is plausible that the mean temperature of dust in galaxies was higher in the past, as star-formation rates and possibly interstellar radiation fields were higher. However, it is also possible that the mass-weighted dust temperatures in high-z SCUBA galaxies might be as low, or even lower than in low-z ULIRGs. This is because dust equilibrium temperatures are very sensitive to the relative geometry of dust and heating sources, as well as optical depth effects. If the clouds in which the stars form are very dense, it is likely that few UV/optical photons escape (we know this is the case for the high redshift SCUBA galaxies as a whole), and so dust outside these regions will see a much weaker radiation field and hence have a lower temperature. There is also evidence (Frayer 2001; Ivison et al. 2001,2002; Isaak et al. 2002; Lutz et al. 2001, Eales et al. 2000) that the physical sizes of the star forming regions in some submm luminous objects at high redshift are larger than in local ULIRGs. Local ULIRGs have very compact regions of star formation ( kpc) while the radio, mm and CO sizes of the high-z submm sources have been estimated to be as large as 10–30 kpc in some cases. This could be due to the high-z objects having much greater gas fractions than local ULIRGs. Mihos & Hernquist (1996) have argued that it is the presence of large stellar bulges in local ULIRGs which provide enough stability to allow the gas to reach very high central concentrations before forming stars. Galaxies at high redshift may have greater gas fractions and small or non-existent stellar bulges compared to galaxies today. This means that the star formation induced by an interaction or perturbation at high redshift could be much more widespread, as the gas will collapse to form stars before it inflows to the centre of the remnant (Mihos 1999; Tissera et al. 2002). A given star formation rate which is spread over a larger volume will result in a lower intensity radiation field, possibly leading to lower dust temperatures. Two sources at from the 170m FIRBACK survey have also been followed up with SCUBA and appear to have much colder dust for their luminosity than local objects selected by IRAS (Chapman et al. 2002). Such sources may be more representative of objects selected in deep submm surveys, as selection at longer wavelengths is less biased toward objects dominated by warmer dust. The models of Pei, Fall & Hauser (1999) however, predict that there should have been a modest amount of positive evolution in the dust equilibrium temperature between and . In the absence of any direct evidence on the amount of cold dust in the high-z SCUBA galaxies, we have assumed the equilibrium temperature predicted for dust sources at by Pei, Fall & Hauser (1999) of 25 K. If temperatures are more akin to local galaxies (20 K) then the high-z dust masses we present will increase by a factor , and more if the equilibrium temperatures at high redshift are actually lower than in local ULIRGs.
3 Dust Mass Functions at Low and High Redshift
We estimate the space density of galaxies as a function of dust mass (the dust mass function – DMF) using standard accessible volume techniques, such that
| (3) |
where is the accessible volume in the parent sample of the th source and the sum is over all objects in the range . For the local galaxies is their accessible volume at 60m, which was the wavelength of selection of their parent sample, the IRAS BGS (Soifer et al. 1989). The local dust mass function (DMF) we will use here is described in detail in Dunne & Eales (2001).
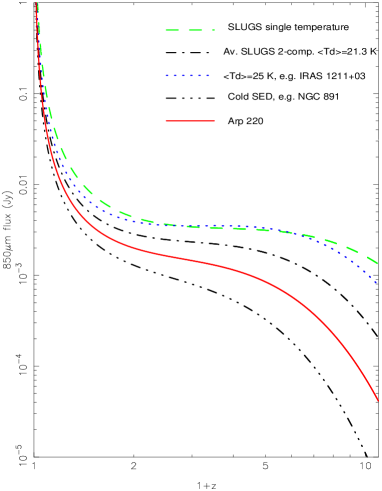
For the high redshift dust sources, we construct the DMF using submm data from the CUDSS blank field submm survey (Eales et al. 2000; Webb et al. 2002), and also the submm number counts at higher and lower flux densities (Smail et al. 2002; Scott et al. 2002; Borys et al. 2002). In order to allow for star forming objects which may be too submm faint to appear in the blank field surveys, we use the statistical submm analysis of starburst galaxies in the HDF by Peacock et al. (2000). The characteristic shape of the thermal dust spectrum means that in a flat cosmology, an object of a given dust mass will be observed to have virtually the same 850m flux-density over a wide range of redshift (). Therefore the redshift we assume for the sources has very little effect on the derived dust masses, providing that the objects are at (any objects known to have were excluded from this analysis). Spectroscopic redshifts (Eales et al. 2000) and estimates using the Dunne, Clements & Eales (2000) version of the radio-submm redshift indicator (Carilli & Yun 1999) were used where available, otherwise sources were placed at for the purposes of calculating . Figure 2 shows that due to the flat flux-density redshift relation, a source visible at will still be visible (in a flux limited sample) at (depending on the exact shape of the spectrum); therefore for the submm sources was simply taken to be the volume in the redshift interval . We fix as there is dramatic evolution in the submm population below this redshift, very few submm sources being found at (Dunlop 2001a), while we take . This is the redshift at which the 850m flux density of a source with an SED similar to Arp 220 would start to fall off (Fig. 2). The effects of using or are a modest % change in the space density. We have treated the statistical detection of submm flux in the HDF in a similar manner to the blank field sources, using , the average of the photometric redshifts, to estimate the dust mass. The photometric redshifts show that the galaxies responsible for the submm emission are found between and this redshift range was used to calculate the space density. There were also 5 optical sources in the HDF which are plausible detections in the submm, these are treated separately and we have used their photometric redshifts to estimate the dust mass.
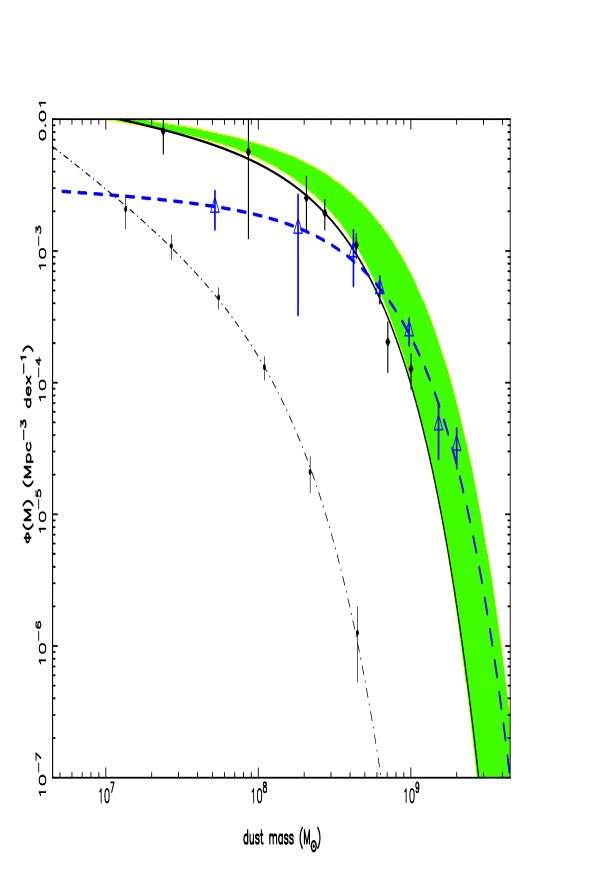
This high-z dust mass function is shown in Fig. 3 for two cosmologies, (solid) and a model with (blue dashed), along with the DMF from our local survey. A value of is used throughout. It is immediately obvious that there has been substantial evolution in the dust mass function, particularly at the highest dust masses.
4 The Metal Content of the Universe
There is growing concern that the metal content of the high-z universe is not observed to be as large as the inferred star formation would suggest (Pettini 1999; Pagel 2002; Blain et al. 1999a,b). Accounting for the metals observed in DLAs and the Lyman forest leaves a shortfall of % in the cosmic metal budget at . Metals are thought to be produced by supernovae and in the winds of cool evolved stars. They are then injected into the ISM with a fraction of them () bound into, or subsequently accreting onto dust grains. From here they can be expelled out of the galaxy into the inter-galactic medium (IGM) by starburst winds, or become part of the next generation of stars. The fraction of metals found in these different locations today is summarised in Fig. 4a.
These fractions do not remain constant, of course, as the fraction of total metals in stars and the IGM will decrease with redshift. Today the fraction of metals in the ISM of galaxies is negligible, but how different could this have been in the past, when galaxies were more gas rich? It is clear that more metals should be found in the most evolved objects at a given redshift, although their distribution between stars and ISM will depend on how far the object has evolved. This has been presented by Cen & Ostriker (1999) as a correlation between over-density and metallicity, the fastest evolving objects being found preferentially in the most over-dense regions. The monolithic collapse models predict massive episodes of star formation at high redshift, and this should be accompanied by rapid enrichment of the locality. Observations of DLAs and the IGM at high redshift have failed to find evidence for this level of enrichment, although high-z QSOs are often found to have near solar or super-solar metallicities (Warner et al. 2002). This makes sense if QSOs represent the accretion phase of the massive black hole, which is presumably forming co-evally with the stellar bulge, as required to produce the BH-bulge mass correlation in the local universe (Magorrian et al. 1998). The IGM is a low-density environment and so not expected to be very enriched at high-z. It has been argued that the Damped Lyman alpha absorbers represent the co-moving mass density of gas in galaxies at high redshift and that the column density-weighted metallicity of these systems traces the global metallicity evolution of the universe222provided that no class of galaxy is excluded from the DLA samples (Pei & Fall 1995). However, there are potential biases in the selection of DLAs as they are only observed along sight lines to optically bright QSOs and thus they are less likely to be observed if they contain dense gas and dust. The cross-sectional area available at the edges of galaxies is also greater than the denser, more evolved inner regions and therefore a sight-line is more likely to intercept a less dense and less metal enriched part of a galaxy (Mathlin et al. 2001). Thus current samples of DLAs may underestimate the metal content of the neutral gas at any redshift. The obvious place to look for the most enriched systems at high-z is to look at the most obscured and actively star forming objects – submm sources, especially as they show evidence for being located in over-dense regions (Ivison et al. 2000).
One simple thing we can do with the high-z DMF is to integrate the total amount of dust in galaxies at low and high redshift. The co-moving density of dust is given by , where and are the Schechter parameters fitted to the dust mass functions in Fig. 3. can be converted into , the co-moving density of metals, by dividing by – the fraction of ISM metals which are in dust. We have used and there is some evidence that this fraction is fairly constant both locally and at higher redshifts (Pei, Fall & Hauser 1999; Issa, MacLaren & Wolfendale 1990; Edmunds 2001; James et al. 2002). Table 1 lists the ISM metals at low and high-z inferred from the dust, along with an inventory of metals and baryons in other locations. Integrating the DMF is currently quite uncertain at low redshift due to the very steep faint end slope fitted to the local DMF333This may simply be because we have not yet probed to low enough dust masses to properly sample the turn over. The minimum and maximum values in Table 1 are obtained by integrating the local DMF down to the lowest observed mass, and to zero mass respectively. To facilitate comparisons with work from the literature, we now restrict ourselves to the cosmology, noting that this does not affect any of our conclusions.
| Location | Baryons () | Metals () | |||
|---|---|---|---|---|---|
| stars | |||||
| SFH | see text | ||||
| ISM | |||||
| DMF & model | K | ||||
| DLAs | |||||
| ISM / IGM? | |||||
| IGM observed | |||||
| cluster gas | Ly forest | ||||
| IGM+ | |||||
| group/field gas | extra inferred | ||||
| by CDM | |||||
| Total observed | |||||
| Inferred | |||||
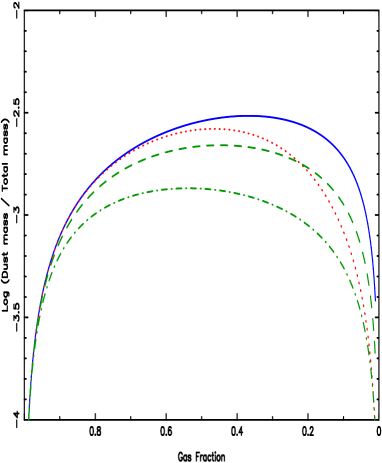
The baryon values are taken from the literature (Fukugita, Hogan & Peebles 1998 – FHP) except for that associated with the ISM at high-z. For this we have used the metals in dust, plus a simple ‘closed-box’ chemical evolution model to predict the baryon content of the ISM at high redshift. This chemical evolution model (Fig. 5), and others which incorporate inflow and outflow of gas, predict that the ratio of dust mass to baryonic mass should change quite slowly over a large part of a galaxy’s evolution, and should peak when roughly half the gas has been converted into stars (Eales & Edmunds 1996, Edmunds & Eales 1998). We have used the maximum ratio of dust mass to baryonic mass (we are assuming that the submm sources are observed at their maximum dust mass) given by the model, and the integral of the DMF, to estimate the total amount of baryons associated with the objects in the DMF. Since the maximum occurs at a gas fraction of , the total baryonic mass is split equally between stars and gas (ISM). The assumption that the submm sources are observed close to their peak dust mass is probably valid for the bright submm selected sources, but cannot be presumed to hold for the faintest lensed sources and the statistical detection of optically selected sources in the HDF. This means that the baryon density we have associated with the ISM in Table 1 is really a minimum.
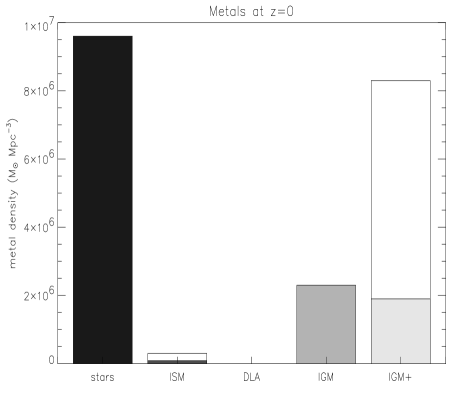
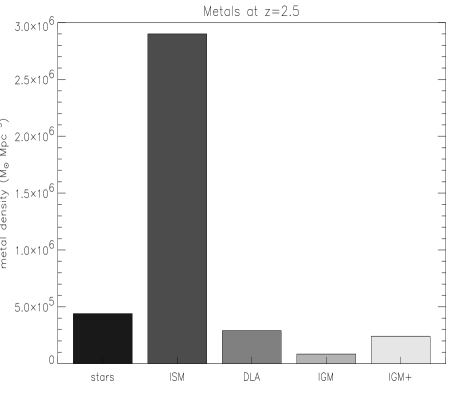
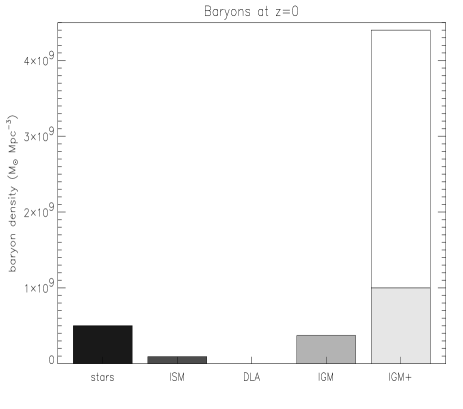
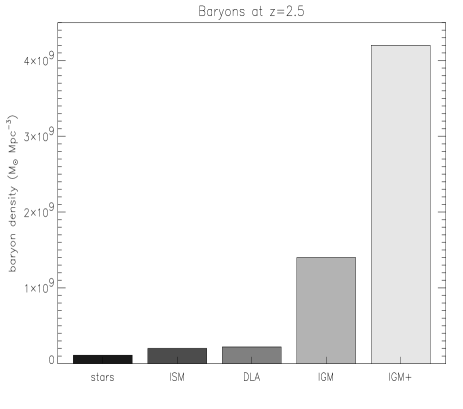
The results in Table 1 and Fig. 4 show a number of different things. First, there was times more dust in galaxies at than there is today (assuming the dust properties used to estimate the masses are similar at low and high-z, most of the uncertainty here comes from the integration of the local DMF). Secondly, as illustrated in Fig. 4, the amount of metals traced by dust at high-z is 3–10 times the total amount of metals in DLA and Lyman forest systems. The Lyman forest represents the IGM at high-z, while the role of the DLAs is less clear. They may be the ISM of galaxies (Wolfe et al. 1986), either the outer parts of galactic disks or their precursors (Efstathiou 2000; Boissier, Peroux & Pettini 2002), or dwarf galaxies (Yanny & York 1992). Some fraction of them may also be linked to outflows from star-forming galaxies and therefore could be classed as IGM (Shaye 2001). Whichever is the case, at high-z the metal content of the ISM is clearly much greater than that of the IGM. At low redshift the situation is reversed: the IGM now contains far more metals than the ISM of galaxies. This is due to two processes: the consumption of ISM gas and metals by star formation and the expulsion of metal enriched gas from galaxies by winds. Much of the IGM today may be contained in groups of galaxies (this is shown in Fig. 4 and Table 1 as ‘IGM+’). The amount of this gas is very uncertain but could be enough to provide the baryonic matter necessary to match that inferred from recent CMB measurements (Netterfield et al. 2002). The amount of metals which may be contained in the postulated group IGM gas is even more speculative. The hot IGM gas in rich clusters has a metallicity of (Renzini 1997) but the metallicity of gas in less dense environments, such as in groups, may be lower (as predicted by Cen & Ostriker 1999). We have used an estimate of for the ‘IGM+’ metallicity but stress the large uncertainty in both the amount of gas and metals in this category.
We have also included in Table 1 an admittedly uncertain estimate of the total amount of metals contained in stars at . This was estimated from the following three populations:
-
1.
Lyman Break Galaxies (LBG) – we took the LF from Shapley et al. (2001), corrected to this cosmology (), and integrated to . Using and (Pettini et al. 2001) we used the integral of the LF to estimate the stellar mass density . We used a metallicity of (Pettini et al. 2001) to produce an estimate of the metal density in stars in bright LBG: . An obvious uncertainty here is the correction to the luminosity density required for dust extinction, which could be a factor 2–5
-
2.
Submm selected sources ( mJy) – the dust mass density (from integrating the dust mass function down to 3 mJy), and the closed box model were used to estimate the mass of metals in stars (and the mass in stars). As above, we assumed that the galaxies were halfway through their evolution, with a gas fraction of . This gave a stellar mass density of and a stellar metal density of . The main uncertainties here are the temperature of the dust (estimates will increase by a factor 2 if the temperature is 20 K rather than 25 K), and the broadness of the maximum in the ratio of dust mass/total mass (Fig. 5). This means there is a considerable range in the gas fraction and hence the stellar mass associated with a given dust mass. Using a model with inflow or outflow will lead to one inferring a greater baryonic mass from a given dust mass
-
3.
The rest of the stellar mass at predicted from the SFH and not in bright LBG or SCUBA sources. We assumed that this is in lower luminosity systems and DLAs and has (the average DLA metallicity (Pettini 1999)).
The sum of these three populations is designed to be equivalent to the total stellar density predicted from the SFH, and has a mean metallicity of . Correction of the LBG values for dust would mean less stars in category (iii) and more stellar metals overall (as LBG have higher metallicities). A comparison of the metals traced by dust (ISM) and those in stars at the two epochs leads to a third conclusion: at low redshift the ratio of metals in the ISM to those in stars is only , while at this ratio is . The chemical evolution model suggests that the ratio will be as high as this when only % of stars in the universe have formed, in agreement with the star formation history inferred from observations. Taken together, this means that most metals at are in the ISM of galaxies. This is as expected in the early stages of galaxy evolution; later as the gas is consumed, the metals become locked into stars and expelled into the IGM.
Table 1 shows that we can now account for all the metals predicted to exist (from integrating the SFH) at both low and high redshift, and thus there is no longer a ‘missing metals’ problem. The DLAs do not seem to trace the bulk of the metals within galaxies at high-z, suggesting that there are indeed biases present in DLA samples against regions of high density and obscuration (Pei & Fall 1995). A survey of DLA’s selected in the radio (Ellison et al. 2001) has found that there is no evidence for a large missing population of high column density absorbers. The data allow for to increase by a factor of 2 at most. However, the statistics of the survey are still somewhat limited, especially at the highest column densities where one may also expect to find the greatest quantities of metals (in an unbiased survey). We have also shown that the ‘missing metals’ can be accounted for without resorting to a large reservoir of metals in a hot, diffuse and as yet undetected part of the IGM at high redshift, as has been suggested by various authors (Pettini 1999; Pagel 2002). However, there is still a ‘missing baryons’ problem, since the total amount of directly observed baryons is less than the amount inferred from recent microwave background (CMB) measurements (Netterfield et al. 2002). This shortfall is currently thought to be made up of inter-galactic gas at both low and high redshift (FHP) (‘IGM+’ in Table 1 and Fig. 4).
5 Dust mass evolution and the spheroid connection.

The chemical evolution models can also be used to try to explain the evolution in the dust mass function shown in Fig. 3. Fig. 6 shows how the ratio of dust mass at any point in the evolution of a spiral galaxy compares with that today. Present-day spiral galaxies have a gas fraction of , and so in Fig. 6 we have shown how the mass of dust in a galaxy is predicted to change relative to the dust mass it has at . The figure shows that there is relatively little scope for the evolution of the dust masses of spirals; they can have at the most dust masses which are factor of 4 greater in the past than their dust masses today. The local DMF is composed entirely of spiral galaxies, and using pure luminosity evolution (or, in this case, dust mass evolution) requires an increase in the dust masses of the local galaxies of a factor in order to reproduce the high redshift objects with . Due to the different shapes of the high and low redshift DMFs, the discrepancy is not as large for the lowest mass objects, and so the dust masses of the faintest submm sources (from the statistical analysis of optically selected starbursts in the HDF) are consistent with simple evolution from the local DMF. Thus the high redshift DMF cannot be reproduced by a chemical evolution model applied to local spiral galaxies, which argues that the high redshift dust sources found in the deep SCUBA surveys are a population which is not represented in the dust mass function today, i.e. that the high redshift sources are in fact the ancestors of the gas and dust poor elliptical galaxies in the local universe.
Present-day elliptical galaxies have a much lower typical gas fraction and if Fig. 6 were to be drawn for ellipticals (showing how dust mass in the past changes relative to that at a gas fraction of 0.01), we would see curves of similar shape to those in Fig. 6 but which peak at a maximum of between 10 and 35 times more dust in the past. However, we note that because the gas fractions and dust masses of present-day ellipticals are poorly known, and because the ratio in Fig. 6 becomes very sensitive to at low gas fractions444For example, if the gas fraction today were 0.001 then the maximum increases in dust mass allowed become 50 – 250. these simple models are unable to predict accurately the factor by which the dust mass of ellipticals could have been greater at their peak dust content. By the time elliptical galaxies have reached their current evolutionary status, there will be competition between grain formation in low-mass giant stellar atmospheres () and the very occasional SNae-Ia, and long-term erosion of grains by hot X-ray gas. These are very different conditions from the grain formation in massive and intermediate-mass stellar envelopes, SNae-II, mantle growth in interstellar clouds and ISM gas conditions that were present at the peak of their dust content. Until a comprehensive model can be based on reliable measurements of the gas and dust content of present-day ellipticals, it is probably unwise to try to extrapolate the dust masses ellipticals should have possessed at their peak dust content (robust value) to the dust masses they should have today (very uncertain), other than to accept that there are good reasons why the dust masses could have been much greater in the past (by factors 10–100).
The highest ratio in Fig. 6 is for an outflow proportional to 4 times the star formation rate. This is quite extreme, and leads to an original mass 5 times greater than the remnant today, which would be difficult to produce in most hierarchical models of galaxy formation. Outflow episodes are expected in a galaxy’s lifetime but at a much lower rate, or for a shorter time. Table 1 also shows that the change in ISM baryons from high redshift to today is of the same order as the increase in stellar baryons. This means there is not scope for 70–80% of the ISM to have outflowed between and today. Some level of outflow is probably necessary to produce sufficient evolution in the dust masses of ellipticals, and to provide an obvious source of at least some of the inter-galactic metals observed in the Lyman-forest at high redshift, and the inter-cluster medium today. However, the elementary outflow models can give rise to problems in interpreting the nucleosynthetic yields and metallicities.
We now use the results so far to address the hypothesis that SCUBA galaxies are the ancestors of today’s massive () spheroids. First, we compare the baryons contained in the two populations. At low-z, we construct a optical spheroid luminosity function (LF) from the 2dF redshift survey (Folkes et al. 1999) and type specific bulge/disk ratios (FHP). We then multiply by the stellar mass-to-light ratio (FHP) to give a spheroid baryonic mass function (assuming that in today’s spheroids, the stars dominate the baryonic mass). This is integrated down to to give the mass density in spheroids as . At high-z, we integrate the DMF down to a mass equivalent to an 850m flux of 3 mJy (). We then use the ratio of from the closed box model (Fig. 5) at a gas fraction of 0.5 to estimate the baryon content of the submm sources, . Since we use the ratio at its maximum (which is very broad) we are being conservative in our estimate; using outflow or inflow would also increase the inferred . The baryonic content of the SCUBA sources at high-z is therefore similar to the baryonic content of today’s massive spheroids, the distant submm sources simply being observed at a time when a greater fraction of those baryons were in the form of gas rather than stars. There is a further interesting result, namely that if we compare the baryons at associated with the SCUBA sources to those in DLAs, we get the same ratio (1.2 – 2.4) as when we compare the baryons in spheroids and all disk galaxies today (FHP). This coincidence supports the idea that spiral disks are the descendants of the high-z DLA population (Wolfe et al. 1986; Pettini 1999), and that the spheroids are the descendants of the SCUBA sources. That there are far more metals in the SCUBA sources than the DLAs is evidence that the bulk of stars in spheroids formed at earlier times than those in disks.
We can also use the chemical evolution model to predict the dust mass function that should have been produced by the spheroids when they had formed % of their stars. We again take the local spheroid LF and multiply by the stellar mass/light ratio to give a spheroid mass function. Using the closed-box model from Fig. 5, we then multiply the spheroid masses by the maximum ratio of dust/baryonic mass to give a dust mass function. This is shown as the shaded region in Fig. 3. Including outflow has little effect on this shaded region, as the decrease in the maximum dust/baryonic mass ratio (Fig. 5) is offset by the increase in overall baryonic mass at higher gas fractions. The agreement between this very simple prediction and the observed DMF is rather good, supporting the idea that the descendants of SCUBA galaxies are not the dusty objects in our low-z DMF, but the now dust-poor spheroids. Putting this another way, bright submm selected sources ( mJy) can account for all the predicted dust from spheroids.
6 Conclusions
We have used submillimetre surveys of the local and distant universe to produce dust mass functions. Taken together these show the evolution in dust mass and ISM metals from redshift zero to . In conjunction with a simple chemical evolution model we have found that:
-
1.
There was much more dust in galaxies in the past. Simple dust mass evolution in local dusty galaxies to match the high-z dust mass function is not feasible as the chemical models do not permit spiral galaxies to have had more dust at an earlier point in their history. This argues that the local submm sources are not the descendants of the sources in the deep surveys.
-
2.
Most metals (%) at are found in the ISM of galaxies – preferentially in the most obscured and active objects. This solves the ‘missing metals’ problem, which was evident when comparing the metals observed in DLAs and the Lyman forest with the metal density inferred from integrating the star formation history. This supports the suggestion (Pei & Fall 1995) that DLA samples are not unbiased tracers of star forming galaxies at high-z, but instead sample the lower density/unobscured (and therefore un-enriched) environments.
-
3.
Comparison of baryons in spheroids today, and submm sources at high-z, show good agreement, indicating that the submm sources are plausibly the ancestors of the spheroids. Using the local optical spheroid LF and the chemical evolution model, we can also predict the dust mass function the spheroids should have had at the time when they had formed % of their stars. This agrees remarkably well with the observed dust mass function at high-z, and again strongly supports the hypothesis that SCUBA sources (particularly brighter ones) are elliptical galaxies in the process of forming most of their stars.
We would like to thank the referee for helpful suggestions on improving the manuscript and also Jon Davies, Sarah Ellison and Bernard Pagel for useful comments. L. Dunne aknowledges the support of a PPARC fellowship. S. Eales thanks the Leverhulme Trust for the award of a research fellowship.
References
- [1] Alton P. B., Bianchi S., Rand R. J., Xilouris E., Davies J. I., Trewhella M., 1998, ApJL, 507, L125
- [2] Alton P. B., Lequeux J., Bianchi S., Churches D., Davies, J. Combes F., 2001, A&A, 366, 451
- [3] Bianchi S., Davies J. I. & Alton P. B., 1999, 344 L1.
- [4] Blain A. W., Smail I., Ivison R. J., Kneib J.-P., 1999a, MNRAS, 302, 632
- [5] Blain A. W., Jameson A., Smail I., Longair M. S., Kneib J.P., Ivison R. J., 1999b, MNRAS, 309, 715
- [6] Boissier S., Péroux C., Pettini M., 2002, MNRAS accepted. (astro-ph/0208457)
- [7] Borys C., Chapman S. C., Halpern M., Scott D., 2002, MNRAS, 330, L63.
- [8] Bower R. G., Lucey J. R. & Ellis R. S., 1992, MNRAS, 254, 601.
- [9] Braine J., Guélin M., Dumke M., Brouillet N., Herpin F., Wielebinski R., 1997, A&A, 326, 963.
- [10] Calzetti D., Armus L., Koorneef J., Storchi-Bergmann T., 2000, ApJ, 533, 682.
- [11] Carilli C. L., Yun M. S., 1999, ApJ, 513, L13
- [12] Cen R. & Ostriker J. P., 1999, ApJ, 519, L107.
- [13] Chapman S. C., Smail I., Ivison R. J., Helou G., Dale D. A., Lagache G., 2002, ApJ, 573, 66.
- [14] Draine B. T., Lee H. M., 1984, ApJ, 285, 89
- [15] Dumke M., Braine J., Krause M., Zylka R., Wielebinski R., Guélin M., 1997, A&A, 325, 124
- [16] Dunlop, J. S., 2001a, New Astronomy Reviews, 45, 609.
- [17] Dunlop, J. S., 2001b, in Lowenthal J., Hughes D. eds, Deep Millimetre Surveys, World Scientific (Singapore), p. 11
- [18] Dunne L. et al., 2000, MNRAS, 315, 115.
- [19] Dunne L., Clements D. L. & Eales S. A., 2000, MNRAS, 319, 813.
- [20] Dunne L. & Eales S. A., 2001, MNRAS, 327, 697.
- [21] Eales S. A. & Edmunds M. G., 1996, MNRAS, 280, 1167.
- [22] Eales S. A., Lilly S. J., Gear W. K. P., Dunne L., Bond J. R., Hammer F., Le Fèvre O., Crampton D., 1999, ApJ, 515, 518
- [23] Eales S. A. et al., 2000, AJ, 120, 2244.
- [24] Edmunds M. G., Eales S. A., 1998, MNRAS, 299, L29
- [25] Edmunds M. G., 2001, MNRAS, 328, 223.
- [26] Efstathiou G., 2000, MNRAS, 317, 697
- [27] Ellison S. L., Yan L., Hook I. M., Pettini M., Wall J. V., Shaver P., 2001, A&A, 379, 393.
- [28] Folkes S. et al., 1999, MNRAS, 308, 459.
- [29] Frayer D. T., Ivison R. J., Smail I., Yun M. S., Armus L., 1999, AJ, 118, 139
- [30] Frayer D. T., 2001, in Lowenthal J., Hughes D. eds, Deep Millimetre Surveys, World Scientific (Singapore), p. 117
- [31] Fukugita M., Hogan C. J. & Peebles P. J. E., 1998, ApJ, 503, 518. (FHP)
- [32] Granato G. L., Silva L., Monaco P., Panuzzo P., Salucci P., de Zotti G., Danese L., 2001, MNRAS, 324, 757.
- [33] Guélin M., Zylka R., Mezger P. G., Haslam C. T., Kreysa E., 1995, A&A, 298, L29
- [34] Haas M., 1998, A&A, 337, L1
- [35] Haas M., Klaas U., Coulson I., Thommes E., Xu C., 2000, A&A, 356, L83
- [36] Hildebrand R. H., 1983, Q. J. R. Astron. Soc., 24, 267.
- [37] Hughes D. H. et al., 1998, Nature, 394, 241.
- [38] Isaak K. G. et al., 2002, MNRAS, 329, 149.
- [39] Issa M. R., MacLaren I. & Wolfendale A. W., 1990, A&A, 236, 237.
- [40] Ivison R. J., Dunlop J. S., Smail I., Dey A., Liu M. C., Graham J. R., 2000, ApJ, 542, 27.
- [41] Ivison R. J., Smail I., Frayer D. T., Kneib J.-P., Blain A. W., 2001, ApJ, 561, L45
- [42] Ivison R. J. et al., 2002, MNRAS in press. (astro-ph/0206432).
- [43] James A., Dunne L., Eales S. A., Edmunds M. G., 2002, MNRAS, 335, 753
- [44] Jimenez R. et al., 1999, MNRAS, 305, L16.
- [45] Klaas U. et al., 2001, A&A, 379, 823.
- [46] Krügel E., Steppe H., Chini R., 1990, A&A, 229, 17
- [47] Lilly S. J., Le Fevre O., Hammer F., Crampton D., 1996, ApJ, 460, L1.
- [48] Lilly S. J. et al., 1999, ApJ, 518, 641.
- [49] Lutz D. et al., 2001, A&A, 378, 70
- [50] Madau P., et al. 1996, MNRAS, 283, 1388
- [51] Madau P., Pozzetti L., Dickinson M., 1998, ApJ, 498, 106
- [52] Magorrian J. et al., 1998, AJ, 115, 2285
- [53] Mathlin G. P., Baker A. C., Churches D. K., Edmunds M. G., 2001, MNRAS, 321, 743
- [54] Mihos J. C., 1999, AP&SS, 266, 195
- [55] Mihos J. C., Hernquist L., 1996, ApJ, 464, 641
- [56] Neininger N., Guélin M., García-Burillo S., Zylka R., Wielebinski R., 1996, A&A, 310, 725
- [57] Netterfield C. B. et al., 2002, ApJ, 571, 604.
- [58] Pagel, B. E. J., 2002, in Matteucci, F. & Giovannelli, F. eds, Chemical Enrichment of Intracluster and Intergalactic Medium, ASP Conf. Proc. Vol. 253, p. 489.
- [59] Papadopoulos P. P., Seaquist E. R., 1999, ApJ, 514, L95
- [60] Peacock J. A. et al., 2000, MNRAS, 318, 535.
- [61] Pei Y. C., Fall M. S., 1995, ApJ, 454, 69
- [62] Pei Y. C., Fall M. S. & Hauser M. G., 1999, ApJ, 522, 604.
- [63] Pettini M., 1999, in Walsh, J. R. & Rosa, M. R. eds, Chemical Evolution from Zero to High Redshift. Springer-Verlag (Berlin) p. 233.
- [64] Pettini M. et al., 2001, ApJ, 554, 981.
- [65] Reach W. T. et al., 1995, ApJ, 451, 188
- [66] Renzini A., 1997, ApJ, 488, 35
- [67] Schaye J., 2001, ApJ, 559, L1
- [68] Scott S. E. et al., 2002, MNRAS, 331, 817.
- [69] Shapley A. et al., 2001, ApJ, 562, 95.
- [70] Sievers A. W., Reuter H.-P., Haslam C. T., Kreysa E., Lemke R., 1994, A&A, 281, 681
- [71] Smail I., Ivison R. J., Blain A. W., 1997, ApJ, 490, L5
- [72] Smail, I., Ivison R. J., Blain A. W., Kneib J.-P., 2002, MNRAS, 331, 495
- [73] Sodroski T. J., Odegard N., Arendt R. G., Dwek E., Weiland J. L., Hauser M. G., Kelsall T., 1997, ApJ, 480, 173
- [74] Soifer B. T., Boehmer L., Neugebauer G., Sanders D. B., 1989, AJ, 98, 766
- [75] Steidel, C. C., Adelberger, K. L., Giavalisco, M., Dickinson, M., Pettini, M., 1999, ApJ, 519, 1.
- [76] Tissera P. B., Domínguez-Tenreiro R., Scannapieco C., Sáiz A., 2002, MNRAS, 333, 327
- [77] Trewhella M., Davies J. I., Alton P. B., Bianchi S., Madore B. F., 2000, ApJ, 543, 153
- [78] Warner C., Hamann F., Shields J. C., Constantin A., Foltz C. B., Chaffee F. H., 2002, ApJ, 567, 68
- [79] Webb T. M. A. et al., 2002, ApJ submitted. (astro-ph/0201180).
- [80] Wolfe A. M., Turnshek D. A., Smith H. E., Cohen R. D., 1986, ApJS, 61, 249
- [81] Yanny B., York D. G., 1992, ApJ, 391, 569