Obscured AGN from the ELAIS Deep X-ray Survey
Abstract
The sources discovered in deep hard X-ray surveys with 2-8 keV fluxes of erg cm-2 s-1 make up the bulk of the X-ray background at these energies. We present here detailed multi-wavelength observations of three such sources from the ELAIS Deep X-ray Survey. The observations include sensitive near-infrared spectroscopy with the Subaru Telescope and X-ray spectral information from the Chandra X-ray Observatory. The sources observed all have optical-to-near-IR colours redder than an unobscured quasar and comprise a reddened quasar, a radio galaxy and an optically-obscured AGN. The reddened quasar is at a redshift and shows a very large X-ray absorbing column of . This contrasts with the relatively small amount of dust reddening, implying a gas-to-dust ratio along the line-of-sight a hundred times greater than that of the Milky Way. The radio galaxy at shows only narrow emission lines, but has a surprisingly soft X-ray spectrum. The softness of this spectrum either indicates an unusually low gas-to-dust ratio for the absorbing medium or X-ray emission related to the young radio source. The host galaxy is extremely red () and its optical/near-IR spectrum is best fit by a strongly reddened () starburst. The third X-ray source discussed is also extremely red () and lies in a close grouping of three other galaxies. No emission or absorption lines were detected from this object, but its redshift (and that of one of the nearby galaxies) are constrained by SED-fitting to be just greater than . The extremely red colours of these two galaxies can be accounted for by old stellar populations. These observations illustrate the diverse properties of hard X-ray selected AGN at high redshift in terms of obscuration at optical and X-ray wavelengths and the evolutionary states of their host galaxies.
keywords:
galaxies: active – galaxies: emission lines – X-rays: galaxies – radio continuum: galaxies1 Introduction
Deep extragalactic surveys with the Chandra and XMM observatories are capable of resolving most of the hard (2-8 keV) X-ray background (e.g. Cowie et al. 2002). Early results from such surveys (e.g. Hornschemeier et al. 2001; Tozzi et al. 2001), confirm that almost all of the X-ray background is produced by accretion of material onto supermassive black holes in active galactic nuclei (AGN). The hard spectrum of the X-ray background and the fact that the majority of hard X-ray sources do not have quasar counterparts shows that obscuration is extremely important. One of the key goals of the current generation of X-ray surveys is understanding the nature and evolution of the gas and dust surrounding AGN and the reprocessing effects they have upon the emitted radiation.
The ELAIS Deep X-ray Survey (EDXS) is a deep survey with the Chandra Observatory in two fields which have been well-studied at other wavebands. In each of the fields, designated N1 and N2, Chandra ACIS-I observations of duration 75 ks have been made. A total of 225 X-ray sources are detected in the full band images above a flux limit of (Manners et al. 2002). Details of the optical identifications of the X-ray sources are presented in González-Solares et al. (2002). These fields lie within the European Large-Area ISO Survey (ELAIS) and have been observed with ISO at 7, 15, 90 and 175 m (Oliver et al. 2000) and with the Very Large Array (VLA) at 1.4-GHz (Ciliegi et al. 1999). One of the two X-ray fields is coincident with the widest survey yet made with SCUBA on the JCMT (Scott et al. 2002) and a very deep VLA map (Ivison et al. 2002). The relationship between the X-ray and sub-mm sources is discussed in Almaini et al. (2002).
With a median keV flux of erg cm-2 s-1, the hard X-ray sources present in the EDXS Chandra data are close to the peak of the source contribution to the X-ray background at these energies (Cowie et al. 2002). Determining the nature of these sources is therefore an essential part of understanding the X-ray background. In this paper, we present detailed observations of three hard X-ray sources selected from the Chandra observations of the EDXS. These sources are all considerably redder than an unobscured quasar and comprise a reddened quasar, a radio galaxy and a totally obscured, Type 2, radio-quiet AGN. The latter two sources are optically faint () and extremely red (). Table 1 shows the basic information on the Chandra sources discussed in this paper.
In Section 2 we present details of the spectroscopic observations performed with the Subaru Telescope and the William Herschel Telescope. In Sections 3-5 we discuss each object in detail. The conclusions are given in Section 6. We assume throughout that , and . The convention for all spectral indices, , is that , where is the flux-density at frequency .
| Source | X-ray position | Near-IR position | X-ray flux (0.5-8 keV) | HR | mag | mag |
|---|---|---|---|---|---|---|
| (J2000.0) | (J2000.0) | (erg cm-2 s-1) | ||||
| N2_21 | 16:36:58.07 +40:58:21.1 | 16:36:58.05 +40:58:20.6 | ||||
| N2_25 | 16:36:55.79 +40:59:10.5 | 16:36:55.79 +40:59:10.4 | ||||
| N2_28 | 16:36:55.21 +40:59:44.1 | 16:36:55.25 +40:59:44.2 |
2 Observations
2.1 Subaru Near-IR Spectroscopy
We selected suitable targets for near-IR spectroscopy from the EDXS N2 region according to the following criteria: (i) detected in the hard (2-8 keV) band; (ii) optically-faint, ; (iii) extremely red colours, . Two sources meeting these criteria, N2_21 (CXOEN2 J163658.0+405821) and N2_28 (CXOEN2 J163655.2+405944), were observed with the OH-airglow suppression Spectrograph (OHS; Iwamuro et al. 2001) on the Subaru Telescope on the night of UT 2001 June 11. This spectrograph uses a fixed grism giving simultaneous and -band spectra over the wavelength ranges m and m. The seeing was arcsec and a 0.95 arcsec slit was used giving a resolution of Å (equivalent to km s-1). The total exposure times per object were 4000 s, split into 4 nodded frames of 1000 s each. The F8 star SAO 46272 was observed immediately after each target to enable correction for atmospheric extinction.
The OHS data were reduced in a standard manner of flat-fielding, sky subtraction, registration and co-addition with cosmic ray rejection. Since the OHS grism is fixed, there was no external wavelength calibration and the polynomial fit given on the OHS web page was used for wavelength calibration. Relative flux-calibration and atmospheric extinction corrections were applied using the F8 star. Photometric flux-calibration was performed by scaling the reduced spectra by the fluxes measured in a 3 arcsec aperture from our own near-IR imaging (González-Solares et al. 2002). We checked that any emission lines have similar spatial extension to the continuum and therefore this method does not over- or under-estimate the emission line fluxes.
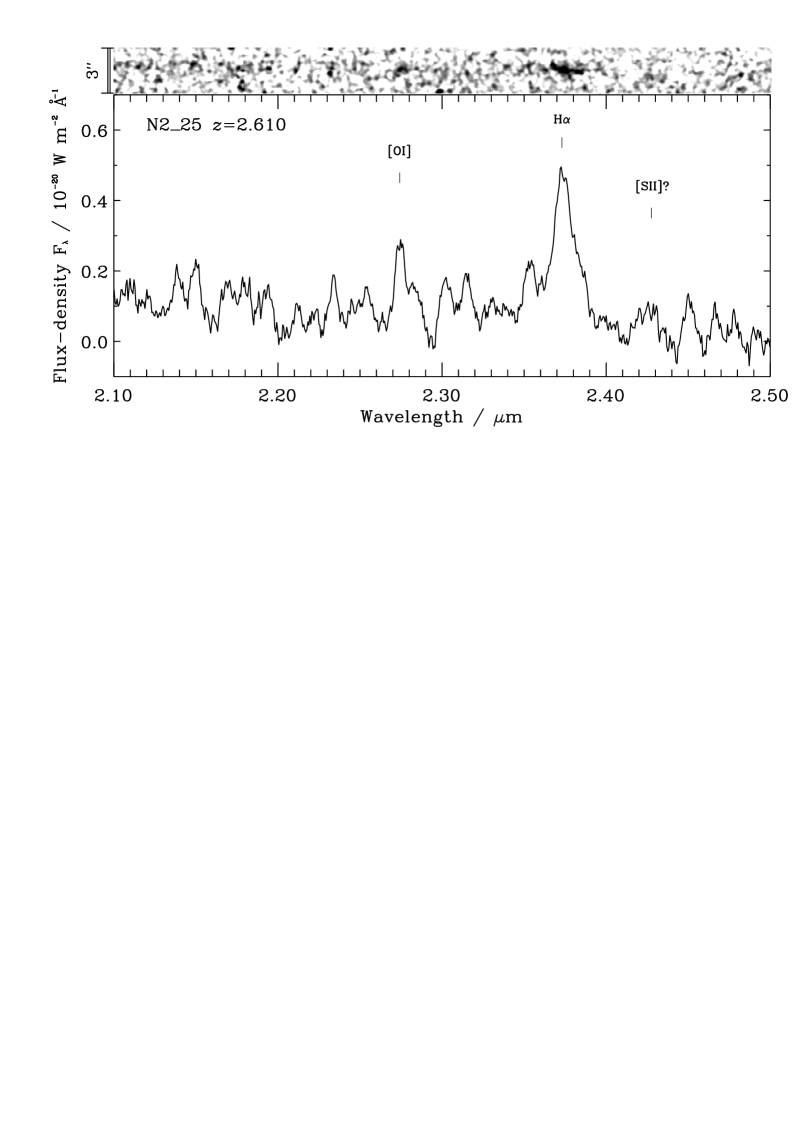
Optical spectroscopy of the X-ray source N2_25 (CXOEN2 J163655.7+405910) had already revealed it to have a redshift of (see Section 2.2) and properties resembling a reddened quasar. Therefore we decided to obtain a spectrum of N2_25 in the -band, since this contains the H emission line. N2_25 was observed with the Infrared Camera and Spectrograph (IRCS; Kobayashi et al. 2000) on Subaru Telescope on the night of UT 2001 May 5. The seeing was arcsec. The -grism was used with the 58 mas pixel scale and a 0.6-arcsec slit (aligned east–west) to give a spectral resolution of km s-1 at the wavelength of redshifted H. Eight separate 600-second exposures were taken, alternating between two positions separated by 7 arcsec along the slit. First-order background subtraction was accomplished by subtracting pairs of exposures, and the IRAF task BACKGROUND was used to remove residual sky emission. These four background-subtracted images were then combined with cosmic ray rejection to produce the final 2D image. Spectra were extracted with 1-arcsec apertures along both the positive and negative beams and combined. The spectrum was flux-calibrated and corrected for atmospheric absorption by ratioing with the F8 star SAO 46107 (which had been reduced in the same manner), whose flux scale had been tied to the UKIRT standard FS 132.

2.2 Optical spectroscopy
These three X-ray sources were also observed using the ISIS spectrograph at the William Herschel Telescope on 2001 May 18 and 21. The low resolution R158R and R158B gratings were used giving continuous wavelength coverage from Å. The seeing was 1.0 arcsec. A slit width of 2 arcsec gave a resolution of 12 Å (equivalent to km s-1 at 5000 Å). N2_21 and N2_25 were observed simultaneously using a slit position angle of for a total integration time of 1800 s. N2_28 was observed simultaneously with two other X-ray sources (N2_32 and N2_34 – Willott et al. 2001a) along a position angle of for a total integration time of 3600 s. Data reduction was performed using standard procedures which are fully described in Willott et al. (1998). N2_25 was clearly detected and is fully discussed in Section 3. Neither continuum nor emission lines were detected in the optical spectra of N2_21 or N2_28.
3 N2_25 - a lightly reddened quasar with a very hard X-ray spectrum
| Emission line | FWHM | Flux/ | ||
|---|---|---|---|---|
| (Å) | (km s-1) | (W m-2) | ||
| O VI | 3731 5 | 2.606 | — | 4.3 1.0 |
| Ly | 4390 2 | 2.610 | 1980 | 17 2.0 |
| N V | 4475 1 | 2.609 | 2410 | 7.0 1.3 |
| Si IV + O IV | 5052 12 | 2.609 | — | 1.7 0.6 |
| C IV | 5595 2 | 2.612 | 2310 | 4.5 0.8 |
| He II | 5920 2 | 2.610 | — | 0.7 0.4 |
| 22741 5 | 2.610 | 650 | 1.3 0.4 | |
| H + [N II] | 23737 6 | 2.617 | 1900 | 5.8 0.6 |
| ? | 24275 10 | 2.610 | — | 0.8 0.5 |
The X-ray source N2_25 is identified optically with an unresolved (in 0.8 arcsec seeing) object with . The corresponding -band counterpart is also spatially unresolved. N2_25 has an optical/near-infrared colour of , considerably redder than the colours of typical high-redshift quasars which have .
3.1 Spectroscopic data
In Fig. 1 we show the optical spectrum of N2_25 in a arcsec2 aperture. The spectrum reveals a weak continuum and several strong, relatively narrow emission lines. The -band spectrum of N2_25 is shown in Fig. 2. The continuum is clearly detected and also there are emission lines of H, [O I] and (marginally) [S II]. Measurements of the emission lines from these two spectra are given in Table 2. The lines are consistent with a redshift of .
The H, Ly, N V and C IV lines have FWHM in the range km s-1. These velocity widths are close to the traditional dividing line between the broad line region (BLR) and the narrow line region (NLR). In contrast the only forbidden line detected, [O I], has a much narrower line width which is virtually unresolved at a resolution of km s-1. This suggests that the permitted transitions are from the BLR. Further support for this inference comes from the very strong N V emission. N2_25 has line ratios N V / C IV and N V / He II. These ratios are consistent with those of the BLR of super-solar metallicity quasars (Hamann & Ferland 1993) and much greater than the ratios observed in the NLR of high-redshift radio galaxies (Vernet et al. 2001). The narrow emission lines in most high-redshift radio galaxies and in at least one X-ray selected Type-II quasar are spatially resolved (Jarvis et al. 2001; Stern et al. 2002). Therefore a further test of whether the observed emission lines are from the BLR or NLR is their spatial extent. Both the Ly and N V lines appear marginally resolved with FWHM = 1.2 arcsec, compared to the continuum FWHM arcsec. However, the low signal-to-noise in the continuum hampers an accurate FWHM measurement and this difference could also be due to a dependence of seeing upon wavelength.
Fig. 3 shows the two-dimensional spectrum of the Ly and N V region. It is clear that both lines are asymmetric with a broader wing on the blueward side. These blue wings appear as residuals in the gaussian fitting process which gave the FWHM values in Table 2. The velocity offsets of these residuals from the line peaks at are km s-1 for both Ly and N V. These components could be associated with an outflowing line-emitting wind or an unobscured line-of-sight to part of a higher velocity region of the BLR.

The central wavelength of the gaussian fit to the H line gives a redshift of , significantly greater than the redshift measured from the other lines. The fact that the [O I] line in the near-IR spectrum has the same redshift as the UV lines in the optical spectrum shows that this is not due to wavelength calibration differences. The offset of H from the other lines is km s-1. It is possible that contamination of the broad H line by the narrow [N II] lines could be affecting the position of the line centre. To investigate this possibility we have fit the spectrum with a broad H line of variable width and flux and the two [N II] lines with fixed widths equivalent to that observed for narrow [O I] (the fluxes of the lines are variable but the ratio of the [N II] lines are fixed such that ). It is not possible to get a good fit to the observed spectrum by fixing the redshifts of all 3 lines at . The only way to obtain a good fit is to allow the redshift of the broad H line to float. In this case the best fit is obtained for a negligible contribution from the [N II] lines and the H line centre has the offset of km s-1 as in Table 2. A km s-1 shift in the Balmer lines compared to the narrow lines has been observed for a sample of luminous quasars at , although its cause remains unclear (McIntosh et al. 1999a). However, the high-ionization broad UV lines are normally blue-shifted from the narrow line redshift, but this is not observed for N2_25. Finally we note that there is a bump in the -band spectrum at 2.3530 m which is possibly the H counterpart of the Ly and N V residuals mentioned previously. The velocity offset from of this H component is km s-1, very close to the offset of the broad wing components in the Ly and N V lines.

3.2 The X-ray spectrum
N2_25 has a very hard X-ray spectrum as indicated by its hardness ratio of (Table 1 – see Manners et al. 2002 for the hardness ratio definition and spread in values for the whole survey). Spectral analysis of the Chandra data on this source was performed using the XSPEC package. Due to the relatively low number of net counts detected (85) it was not possible to simultaneously constrain the power-law index and the absorbing column. Therefore we set the photon index to be typical of an unabsorbed quasar () and allowed the gas absorption column (at redshift ) to be fitted as a free parameter. The best fit value is (shown in Fig. 4). For comparison, using and resulted in column densities of , respectively. Therefore for any reasonable power-law continuum slope there is very heavy absorption by a column with . The observed hard X-ray (2-10 keV) rest-frame luminosity of N2_25 is erg s-1, but correcting for the hard X-ray absorption by this column density gives the corresponding de-absorbed keV luminosity of erg s-1.
3.3 Gas and dust obscuration
These observations of N2_25 allow us to estimate the nuclear obscuration from three different components: the X-ray spectrum, the rest-frame optical-UV spectrum and the broad line region. Assuming that the intrinsic X-ray spectrum is heavily absorbed by a column density of , the corresponding nuclear reddening would be , assuming a galactic gas-to-dust ratio. Comparison of the optical spectrum with that of a reddened typical quasar spectrum (Francis et al. 1991) shows that the optical reddening is much lower with (or equivalently, assuming a galactic extinction law: ). The flux ratio of Ly / H. For luminous quasars, McIntosh et al. (1999b) find that this ratio is typically . Therefore there does not seem to be evidence for a very large amount of reddening of the broad line region. The amount of reddening required to change the observed value of this ratio from to the typical value of is only .
Reconciling the much lower reddening of the optical light (both continuum and from the BLR) with the very high X-ray absorption leads to two possibilities: either the absorbing medium has a very low reddening to absorption ratio (about 1% of the standard galactic value), or the optical radiation does not pass through the bulk of the medium responsible for the X-ray absorption. In the latter case, the optical emission we observe would be scattered into our line-of-sight and likely to be just a small fraction of the total luminosity. Therefore a test of the scattering hypothesis is to see whether the de-reddened optical luminosity (in lines or continuum) is consistent with that expected given the absorption-corrected hard X-ray luminosity.
It is well known that broad emission line luminosities, such as that of H, correlate well with hard X-ray luminosity, due to the direct link between these properties of photo-ionization. The ratio of can be used as an indicator of the optical absorption to the BLR in Seyfert 2s and ULIRGs because hard X-rays suffer much less absorption than the optical (Ward et al. 1988). Imanishi & Ueno (1999) give the best-fit linear relationship between these quantities for broad-line AGN as with a small rms scatter of a factor of . For N2_25 we have determined the broad H luminosity to be erg s-1 which would increase up to erg s-1 if we take account of the reddening of the optical continuum (). Using the de-absorbed hard X-ray luminosity of erg s-1 gives a ratio of (or 15 if we do not take account of BLR reddening). This implies that we are seeing effectively all the H emission, ruling out a scattering origin for this line.
Quasars tend to follow a well-defined correlation between the X-ray flux and optical magnitude (e.g. Schmidt et al. 1998) and therefore we can apply a similar test to that in the previous paragraph using the optical continuum. The observed ratio of hard X-ray flux to optical (observed -band) flux of N2_25 is greater than for typical quasars (Willott et al. 2001a; González-Solares et al. 2002). Correcting for the hard X-ray absorption of a factor of 3 gives a ratio of X-ray to optical flux greater than typical, i.e. 3.7 magnitudes. The observed optical extinction of corresponds to 3.3 magnitudes of extinction at the observed -band for a galactic extinction law. Therefore, after corrections, the intrinsic ratio of hard X-ray to optical fluxes of N2_25 is typical of quasars. This result is consistent with that found for the ratio of X-ray and broad emission line fluxes.
The results above suggest that once we take account of a small amount of reddening () and the much greater X-ray absorption, we find the intrinsic hard X-ray, optical continuum and broad-line luminosity ratios are all consistent with those found in normal quasars. Hence it does not appear that the optical light we see is scattered and we deduce that both the optical and hard X-ray radiation are passing through the same material.
In recent years, there have been several reports of AGN which tend to show much more absorption in X-rays than in their optical properties (Simpson 1998; Akiyama et al. 2000; Risaliti et al. 2001; Maolini et al. 2001a; Comastri et al. 2001). Possible explanations of this effect are discussed in Maiolino et al. (2001a,b). The most likely reasons for the higher gas absorption are that either the gas-to-dust ratio is much higher in the circumnuclear regions of AGN than the standard galactic ratio or the dust grain composition is different. The implication of such a scenario is that the AGN classification into Types 1 and 2 could be decoupled in the optical and X-rays, such that there exist a large population of sources with properties similar to N2_25. The existence of large numbers of optically-bright quasars with hard X-ray spectra would lessen the number of optically-obscured QSOs necessary in models which fit the X-ray background. In future work we plan to investigate the fraction of such objects in the EDXS.
3.4 Interpretation
As shown in Section 3.1, the FWHM of the broad emission lines in N2_25 are very narrow () for such an intrinsically luminous quasar. This low velocity width could arise from three different possibilities: (i) a small black hole mass , since assuming Keplerian motion the FWHM ; (ii) a pole-on line-of-sight, since the BLR gas is likely to be in a flattened disk configuration along the torus axis and therefore when viewed pole-on there is a reduced radial velocity component (Wills & Browne 1986); (iii) there is substantial obscuration of the BLR and we are only viewing some regions with low velocity dispersion.
In case (iii) we would expect the emission line profiles to be poorly fit by a single gaussian. Indeed, there is some evidence of this from the blueshifted (by ) components observed in the wings of Ly, N V and possibly H. However, this blueshifted emission could equally be due to an outflow. There is some observational support for separating the broad line region of quasars into an intermediate line region (ILR) and very broad line region (VBLR) (Brotherton 1996). The ILR is proposed to be further away from the active nucleus and has lower velocity dispersion () and stronger low ionization lines. In this case our observed small velocity widths would be due to total obscuration of the VBLR. However, the observed emission line spectrum of N2_25 is characterized by strong highly ionized species such as N V and O VI which are expected to be relatively weak in the ILR. As mentioned in the previous section, the absorption-corrected ratios of X-ray and broad line luminosities are typical and therefore suggest that the majority of the broad line emission is not totally obscured.
Discounting the VBLR obscuration hypothesis leaves us with the possibilities of either a relatively small black hole mass or an orientation effect. Considering the first of these, one can calculate the black hole mass assuming Keplerian motion of the BLR clouds and that N2_25 has no special orientation with respect to us. McLure & Jarvis (2002) give the relationship between black hole mass, optical luminosity and BLR FWHM as . For N2_25 with we find . Given the absorption-corrected absolute magnitude of , we determine its bolometric luminosity to be W (assuming a bolometric correction, as in Wandel, Peterson & Malkan 1999). The Eddington limit for a black hole mass of is W, therefore N2_25 would be accreting at approximately its Eddington limit, higher than most low-redshift quasars which are typically accreting at % of the Eddington limit (e.g. Kaspi et al. 2000; McLure & Dunlop 2001).
N2_25 shares several properties with the class of objects known as narrow-line Seyfert 1s (NLSy1s) such as narrow emission lines and very high metallicity (as indicated by the strength of N V). A major difference between N2_25 and NLSy1s is that the NLSy1s tend to have a soft X-ray excess and steep hard X-ray spectra (; Brandt, Mathur & Elvis 1997). However, any soft X-ray excess would be redshifted out of the Chandra energy range and the spectrum of N2_25 can be fit with an intrinsically steep hard X-ray spectrum with a slightly higher absorbing column than that derived in Section 3.2. The relatively small black hole for such a luminous quasar could indicate that the black hole is still in a growing phase, since there is evidently a plentiful fuel supply, as has been proposed for NLSy1s (Mathur 2000).

As suggested previously, the small FWHM of N2_25 may actually be indicative of an orientation effect, rather than related to the mass of the black hole and the fraction of the Eddington luminosity. If we are observing N2_25 within a fairly small angle to the torus axis, then the derived black hole mass could be a factor of greater (e.g McLure & Dunlop 2001), thereby reducing the percentage of the Eddington luminosity at which the quasar is accreting to %, similar to other quasars. However, for distant radio-quiet quasars there is no orientation indicator as exists for radio-loud objects, so the orientation remains unknown. Under the unification scenario, the dusty torus provides the bulk of the X-ray and optical obscuration. For radio-loud objects it has been found that quasars observed close to the torus opening-angle tend to be redder, due to dust reddening by material near the edges of the torus (Baker 1997). However, Becker et al. (2000) find that about a third of radio-loud broad absorption line quasars have flat radio spectra, signifying that these obscured objects are observed pole-on. It would be interesting therefore if N2_25 is actually observed close to pole-on and contains a very high column density absorber.
N2_25 is detected in our deep 1.4-GHz VLA map (Ivison et al. 2002) with a peak flux-density of Jy. The source is spatially unresolved at 1.5 arcsec resolution, implying an angular size arcsec. The radio luminosity (evaluated at 5-GHz to minimize -corrections) is . This is below the usual dividing line between radio-loud and radio-quiet quasars of (e.g. Kellermann et al. 1994) and this quasar is classified as radio-quiet.
N2_25 is marginally detected in the mid-IR with ISOCAM, with a m flux of mJy. The ratio of mid-IR to hard X-ray fluxes for this source is similar to that of AGN in the Lockman Hole and Hubble Deep Field North (Fadda et al. 2002; Alexander et al. 2002). At , N2_25 has the highest known redshift of all the mid-IR sources within the 0.14 square degrees of the ELAIS survey covered by the Chandra observations.
4 N2_21 - a dusty radio galaxy
The X-ray source N2_21 coincides with the position of a bright radio source ( mJy; Ciliegi et al. 1999). The optical counterpart to the X-ray and radio source is a faint galaxy (). The -band image also shows a resolved counterpart with giving an extremely red colour of .
4.1 Spectroscopic data
The OHS spectrum of N2_21 is shown in Fig. 5. A strong emission line of H is detected at m. Weak emission lines at the expected positions of H and [O III] are also detected. Table 3 gives the emission line data. We adopt a redshift of on the basis of the H line position, since this is detected with the highest signal-to-noise. The widths of the emission lines are all consistent with being unresolved at the spectral resolution of 80 Å ( km s-1). This indicates these lines are narrow and typical of those of high-redshift radio galaxies. The H emission line is spatially unresolved on the 2-dimensional spectrum. The Balmer decrement ratio of the fluxes of the H and H lines is (note that this assumes the contribution of the nearby [N II] lines to the H flux is negligible). This is much larger than the typical case B recombination value of 3, perhaps suggesting that there is some reddening [] along our line-of-sight to the narrow line region. However, the low signal-to-noise of the H line, the possibility of contamination of H by [N II] and the uncertainty of the intrinsic line ratio prevents a firm statistical limit on the reddening being derived. The optical spectrum of N2_21 showed neither continuum nor emission lines. This is consistent with the lack of strong emission lines in the optical wavelength range for this redshift and does not constrain the reddening to the narrow line region.
| Emission line | FWHM | Flux/ | ||
|---|---|---|---|---|
| (Å) | (Å) | (W m-2) | ||
| H | 12496 8 | 1.571 | 0.9 0.4 | |
| 12878 8 | 1.572 | 2.0 0.5 | ||
| H | 16899 9 | 1.575 | 8.0 1.2 |
Assuming that N2_21 contains an obscured broad line region as expected in unified schemes, we can obtain a limit on the differential reddening between the broad and narrow line regions. From the lack of a broad base to the narrow H line in Fig. 5, the observed ratio of broad to narrow line fluxes is . Assuming an intrinsic ratio of 40 for unobscured radio-loud quasars (Jackson & Eracleous 1995), this gives a lower limit to the differential reddening of . Combined with the estimated extinction to the narrow line region of , gives that the extinction along our line-of-sight to the broad line region is .
4.2 Radio imaging
The radio source coincident with N2_21 is unresolved in our deep 1.4-GHz VLA map which has 1.4 arcsec resolution (Ivison et al. 2002). The radio spectrum is steep between 326-MHz and 1.4-GHz with . In order to determine the radio structure, we obtained higher resolution data with the VLA at 8.4-GHz. The source was observed for two 5 minute snapshots, using MHz bandwidths centred at 8.4351 and 8.4851 GHz. The data was flux calibrated using 3C 286 and phase calibrated using the VLA calibrator 1640+397. The data was self calibrated (for phase only), and imaged using the AIPS task IMAGR with a ROBUST parameter = 0, i.e. a compromise between natural and uniform weighting. The resulting synthesized beam is arcsec at a position angle of . The rms noise in the final map is 60 Jy/beam.
The optical and near-infrared images were aligned with the radio reference frame by comparing the positions of 5 radio sources on the 1.4-GHz image within a 2 arcmin radius around N2_21 with their optical counterparts. These sources (2 quasars and 3 galaxies) all have fairly compact radio and optical structures. The rms in the offsets between the radio and optical positions is only 0.12 arcsec in RA and 0.10 arcsec in DEC.
The 8.4-GHz map of N2_21 is shown in Fig. 6 along with the registered -band image. There are three distinct radio components which resemble the core and lobes/hotspots of powerful radio galaxies. The weak core is unresolved and has a flux-density of 0.9 mJy. Its position of 16:36:58.05 +40:58:20.6 is identical to that of the centroid of the -band emission, which is as expected for core emission from the bases of the jets close to the supermassive black hole at the centre of the galaxy. The northern hotspot lies 0.40 arcsec away and is significantly resolved with a deconvolved size of arcsec along a position angle of 135 degrees east of north, i.e. pointing towards the core. The fainter, southern lobe is 1.1 arcsec from the core and much more extended. The northern hotspot dominates the radio flux with an integrated flux-density of 19.7 mJy out of the total mJy of the whole source. It also dominates the flux at 1.4-GHz given the 1.4-GHz position of 16:36:58.03 +40:58:20.8. The spectral index of N2_21 between 1.4-GHz and 8.4-GHz is steep with , consistent with the same slope as at lower frequencies.
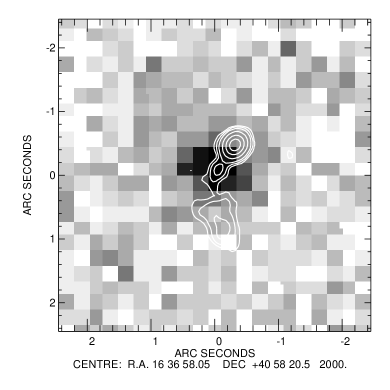
The core to lobe flux ratio is similar to other radio galaxies of this redshift and luminosity (Blundell et al. in prep.). This, combined with the spectroscopic observations discussed in the previous section, lead us to conclude that N2_21 appears to be a fairly typical radio galaxy and does not have the properties of a quasar (such as bright radio core and broad emission lines). One unusual aspect of the radio structure is that the lobes/hotspots are quite asymmetric in terms of position angle, distance from the core and flux-density. These asymmetries are not due to the beaming of the hotspot emission, since this is not thought to be a major factor for radio galaxies (Dennett-Thorpe et al. 1999). The observed asymmetries would tend to suggest that the radio source is expanding into an inhomogeneous medium (Barthel & Miley 1988). The side of the brighter, shorter hotspot would then have a much denser ambient medium which confines the hotspot advance and enhances the radiative efficiency. McCarthy, van Breugel & Kapahi (1991) also find that the closer hotspot tends to have a higher optical emission line luminosity, consistent with the idea of a denser medium. It is interesting to note that the faint -band emission in N2_21, which samples the rest-frame UV, is more extended than the -band emission and centred closer to the north hotspot than the core.
4.3 The X-ray spectrum and plausible emission mechanisms
The X-ray spectrum of N2_21 is fairly soft with (a total of 175 net counts were detected). The best-fit power-law spectrum in XSPEC gives and . The hard ( keV) X-ray luminosity of N2_21 is erg s-1. Fig. 7 shows the binned data with a model where the photon index is fixed to that of a typical quasar () giving . The X-ray spectrum is similar to that of a typical quasar with only a very small amount of absorption ( lower than for N2_25). We have also fitted the X-ray spectrum of N2_21 in XSPEC with a thermal Raymond-Smith model and find that viable fits are only obtained for very high temperatures (the best fit is for T=18 keV with reduced and T=10 keV has reduced ). Much lower temperatures which are more common in hot cluster gas are ruled out (e.g. a fit with temperature of 5 keV has reduced ). This suggests a non-thermal origin for the X-ray emission is more plausible.
The lack of X-ray absorption in N2_21 is rather surprising given that the fact we observe only narrow optical emission lines implies that the broad line region is heavily obscured. Chandra observations of the nuclei of other high-redshift radio galaxies show much harder spectra with absorbing columns (e.g. Fabian et al. 2001; Carilli et al. 2002). Assuming a galactic gas-to-dust ratio, the reddening due to the gas column density in N2_21 is (note the X-ray spectrum is also formally consistent with no absorption). This amount of reddening is consistent with that from the narrow line Balmer decrement, suggesting it could be due just to material in the extended host galaxy (see also Sec. 4.4). The limit on the reddening to the broad line region derived in Section 4.1 implies a limit on the column density of . The fact that this is considerably greater than the observed limit on the column density raises the possibility that the bulk of the observed X-ray emission is not from the nucleus, but from a more extended region beyond the obscuring torus.

On the Chandra image, N2_21 is consistent with being a point source with a FWHM = 0.7 arcsec (equivalent to 6 kpc at ). We cannot determine whether the centroid of the X-ray emission is closer to the radio core or hotspot since their separation is only 0.4 arcsec. However, the X-ray position is not consistent with the southern lobe/hotspot. The small scale of the X-ray emission argues against the soft X-ray emission being due to large-scale thermal cluster gas which would be expected to have a much greater extent of kpc. However, it is possible that the soft X-ray emission is related to the bright, compact radio emission from the northern hotspot. We can rule out the possibility that the X-rays are due to an extrapolation of the synchrotron radiation since the radio to X-ray spectrum would need to have a slope of to give the required X-ray flux and the X-ray spectral index of is flatter than this. Further, we can rule out Thomson scattering of nuclear X-ray emission since scattering fractions are generally rather low (e.g. 1% for the central few kpc of Cygnus A – Young et al. 2002) and hence the intrinsic hard X-ray luminosity would have to be erg s-1. However, given the [O III] emission line luminosity of erg s-1, the correlations between [O III] and hard X-ray luminosities for both radio galaxies and Seyferts predict that the intrinsic hard X-ray luminosity is only erg s-1 (Sambruna, Eracleous & Mushotzky 1999; Mulchaey et al. 1994).
Recent Chandra imaging of radio-loud AGN has revealed that extended soft X-ray emission on scales and axes similar to the radio lobes are a common occurrence (e.g. 3C 294 – Fabian et al. 2001; PKS 1138-262 – Carilli et al. 2002; 3C 9 - Fabian et al. 2002). Unfortunately, the low numbers of counts detected in each case limit the constraints on the spectral shapes of this extended emission, except that it is fairly soft in all cases. The most likely emission mechanisms invoked by the authors are different for all three sources. For 3C 294 it is thermal cluster gas. For PKS 1138-262 it is gas which has been shocked by the expanding radio source. For 3C 9, it is claimed that the double-sided jet is scattering nuclear photons.
The spectrum of N2_21 cannot be fit well with a thermal model, but the reduced for hot ( keV) gas is not strictly ruled out (note also that a lower temperature gas could also fit the data if it is absorbed by a high column density). Therefore we keep the option open that the X-ray emission could be due to gas shocked by the expanding radio source (c.f. Carilli et al. 2002) until we have more sensitive, higher spectral resolution X-ray data. The compactness of the X-ray emission indicates that to produce such a high X-ray luminosity the gas would need to be very dense, m-3. The density of dark matter (and gas) within recently collapsed structures scales with redshift as . The arm-length and flux asymmetries indicate a difference in the densities of the two sides assuming models for radio source evolution and emission (e.g. Willott et al. 1999). Strong shocks from the advancing radio source could provide a further increase of a factor of in density. Together these factors give a density which is higher than is found in local clusters. Young et al. (2002) estimate the central electron density in the cluster surrounding Cygnus A is m-3. Therefore it is plausible that the high density required by the hot gas model to explain the X-ray emission from N2_21 could be viable. One consequence of this high density is that the cooling time would be very short, but this is not a problem as the small angular size of the radio source indicates its jet-triggering event was quite recent and energy is constantly being pumped into the environment by the expanding radio source.
We next consider inverse–Compton (IC) scattering off the relativistic electrons in the radio lobes as the X-ray production mechanism for N2_21. If the relativistic electrons and seed photons are co-spatial in a uniform magnetic field then the IC scattering luminosity is where is the integrated synchrotron luminosity, the energy density in the seed photons and the energy density in the magnetic field (e.g. Moran, Lehnert & Helfand 1999). In such a compact radio source, the energy density of the IR quasar photons is likely to dominate over that of either the cosmic microwave background or the synchrotron emission itself (Brunetti et al. 2001). Since for N2_21, then the IC mechanism can only produce a high enough luminosity if . This will only be true for a magnetic field strength much lower than the equipartition value. Blundell & Rawlings (2000) argue that such deviations from equipartition will only occur in large, aged radio sources and not in compact, young sources. Therefore we find that IC scattering of the nuclear photons cannot generate all the observed X-ray emission.
In conclusion, the emission mechanism for the X-rays from N2_21 remains a mystery. The compact nature of the radio and X-ray emission precludes differentiating between nuclear emission or emission on a size scale comparable to the radio source. No viable mechanisms related to the radio source seem to be able to fit the spectrum and extent of the soft emission from this object. Perhaps we cannot exclude the possibility that the X-rays come from the nucleus and are not heavily obscured, despite the obvious obscuration in the optical and the weakness of the radio core. Whereas N2_25 showed evidence for a very high gas-to-dust ratio in its absorbing material, perhaps the absorber in N2_21 has a very low gas-to-dust ratio such that we observe most of the soft X-rays coming from the nucleus. As noted above, the observed X-ray luminosity of N2_21 is consistent with that expected given its narrow emission line luminosity.
4.4 The evolutionary state of the host galaxy
The sensitive near-infrared spectrum and acquisition of a redshift for N2_21 allows us to investigate the properties of the stellar continuum in this galaxy. Willott et al. (2001b) showed that about half of all radio galaxies at have extremely red colours (). However, for these objects, spectroscopic redshifts were not available and broad-band photometry alone did not allow a distinction to be made between evolved stellar populations or dusty starbursts. N2_21 has properties such as redshift, colour and radio luminosity similar to the extremely red radio galaxies in Willott et al. (2001b).

The continuum spectral index in the and bands is . This is considerably steeper than the of unreddened, moderately old (a few Gyr) stellar populations at this redshift and suggests that dust reddening is important. Pozzetti & Manucci (2000) have proposed colour-colour criteria which can distinguish between old and dusty EROs. They show that, because the 4000 Å break in the spectrum falls between the and bands at , EROs with large colours compared to their colours tend to be dusty starbursts and those with smaller colours represent old galaxies. N2_21 has giving an colour of 4.9 and a colour of 2.8. This places it well into the starburst regime (the division between old galaxies and dusty starbursts for is ).
The images of N2_21 at all optical and near-IR wavelengths show resolved structure and hence we are confident that the observed light is stellar in origin and not strongly affected by a point-source such as a reddened quasar. Using the observed broad-band magnitudes in the , , and bands and the calibrated OHS spectrum in the and bands we have determined the rest-frame UV-optical spectrum of N2_21 (Fig. 8). Emission lines were subtracted from the OHS spectrum and fluxes in 500 Å bins generated to reduce the errors. The SED cannot be fit by a single power-law as might be expected if scattered AGN emission dominates at all wavebands.
A wide range of galaxy SEDs were fit to these data using the HYPERZ routine (Bolzonella, Miralles & Pelló 2000). The redshift was fixed to and a range of Bruzual & Charlot evolving SEDs were used. The SEDs were subject to variable amounts of reddening using both the Milky Way (MW) extinction curve (Allen 1976)222The strong absorption feature at 2175 Å was removed from the Milky Way extinction curve since it is generally not observed in extragalactic objects (e.g. Pitman, Clayton & Gordon 2000).and that of starburst galaxies derived by Calzetti et al. (2000). The maximum amount of reddening was determined such that the de-reddened -magnitude of N2_21 would not be brighter than the typically observed for the most luminous radio galaxies at this redshift (Eales et al. 1997). This corresponds to for MW extinction or for the Calzetti law. The best fitting model (reduced ) is for a 90 Myr old starburst reddened by of MW dust. The best fitting model with the Calzetti reddening law is for a fairly old (2.0 Gyr) elliptical reddened by (reduced ). Younger starbursts with ages Myr can also fit the data, but require a higher or a steeper extinction curve than the MW. Finally we performed a fit without dust reddening and this gave a very poor fit with reduced , confirming our expectation from the broad-band colours and near-IR continuum slope that the starlight from N2_21 is strongly affected by dust. The best fit MW-reddened and unreddened spectra are plotted on Fig. 8.
The large amount of reddening necessary to fit the SED of N2_21 indicates substantial quantities of dust distributed throughout the galaxy. The existence of such a large amount of dust strongly suggests that N2_21 is undergoing an intense starburst. This galaxy is contained within the area surveyed at 850m with SCUBA in the 8 mJy survey of the ELAIS N2 region (Scott et al. 2002). N2_21 is not detected in the submillimetre to a upper limit of 5.3 mJy (Almaini et al. 2002). This non-detection is not at a sensitive enough level to rule out a massive starburst in this galaxy, only giving limits of star-formation rate and dust mass (assuming dust parameters as in Hughes, Dunlop & Rawlings 1997). More sensitive observations are required to determine the far-infrared output of N2_21 and its star-formation rate, but it is clear from our observations that it must be a very dusty galaxy. It is interesting to note that the radio source hosts with the highest submillimetre luminosities tend to contain the smallest (youngest) radio sources (Willott et al. 2002a; Rawlings et al. 2002) and N2_21 appears to be a further example of a very dusty young radio source.
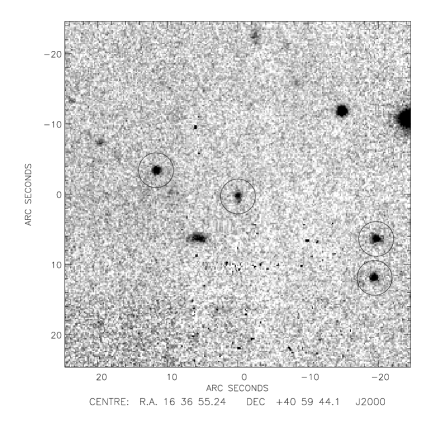
5 N2_28 - an obscured AGN in a cluster of EROs?
The X-ray source N2_28 is identified with an extremely red galaxy which has and . This galaxy is near the centre of a group of 4 extremely red () galaxies (Fig. 9). The other 3 extremely red galaxies are all a bit brighter with . The surface density of objects with and in this region is 30 times higher than is typical (Thompson et al. 1999). This high overdensity strongly suggests that at least some of these objects are at the same redshift and physically associated. These galaxies are part of a cluster of galaxies to the north-east of N2_28 which is discussed by Roche et al. (2002).
5.1 Spectroscopic data
The slit of the OHS spectrograph was oriented at a position angle of east of north for the observations of N2_28 so that the closest of the nearby EROs (object ‘r552’ in Roche et al. 2002), which is 12 arcsec north-east of the X-ray source, fell along the slit. One-dimensional spectra of both sources were extracted from the reduced 2-D spectra. Continuum was detected from both objects, but no clear spectral features were found. The near-IR spectral indices of both sources are , much flatter than was found for N2_21, suggesting that the continua of these EROs are not so affected by dust reddening. The lack of a 4000 Å break further suggests that these galaxies are not at very high redshift ().
5.2 The X-ray spectrum
N2_28 is detected in both the hard and full band Chandra images. The hardness ratio of is harder than the typical of unobscured quasars, indicating a substantial absorbing column. We have fit the data in XSPEC, however with only 32 net counts detected from this source, our constraints on the spectral shape are not very strong. An unobscured power-law model has a best fit photon index of . To estimate the absorbing column if the source has an intrinsic power-law similar to quasars (), we also fit the spectrum with a fixed slope and variable absorption at . This gave a best fit absorbing column of . If the X-rays are from an obscured AGN, this level of absorption is consistent with the optical and near-IR data which shows a resolved host galaxy and no nuclear point-source. The hard X-ray luminosity of N2_28 is erg s-1 assuming it is at a redshift of 1.1 (see Sec. 5.3), which would increase to erg s-1, when correcting for the X-ray absorption. The hard spectrum and high luminosity indicate the presence of an obscured AGN, however this source is considerably less luminous than quasars and more similar to Seyfert galaxies.
5.3 Redshift constraints
We can use the information from the OHS spectrum and broad-band photometry to determine the SEDs of N2_28 and the nearby ERO placed along the slit. These SEDs can then be compared to a range of galaxy models to constrain the redshifts of these two galaxies. We have used the HYPERZ package as described in Sec. 4.4 to perform this analysis. Again the OHS fluxes in the and bands were extracted in 500 Å bins. Because the slope of the near-IR spectra indicated that there is not a huge amount of reddening of these sources, the maximum reddening used was . Both Calzetti and MW extinction laws were used, giving very similar results, so for simplicity we will only quote the results obtained for the Calzetti extinction law.


Fig. 10 shows the optical and near-IR photometry for these two galaxies. Also shown are the best-fit reddened and unreddened galaxy models. Fig. 11 shows the probability distributions of the redshift of these two galaxies for the fits allowing reddening. Both distributions peak at a redshift of about one. The 90% confidence range for N2_28 is , whilst that for the nearby ERO is . The weighted mean redshift for N2_28 evaluated over all possible models (assuming equal priors for all models) is . Given the evidence for clustering of extremely red galaxies in this field it is quite probable that these two galaxies are physically associated with redshifts of . Although evolved (several Gyr) single burst models with moderate amounts of reddening () provide the best fit to the data, unreddened models with similar ages also fit the data well.
At redshifts between 1.06 and 1.25, the strong narrow emission lines which one would expect in the near-IR such as H, H and [O III] lie in the gaps either side of the -band which are not covered by the OHS spectra due to strong atmospheric absorption. Therefore the lack of emission lines observed from the X-ray source does not necessarily mean that it does not possess strong emission lines. The most stringent limit on emission line luminosity for an object at this redshift comes from the lack of [O II] emission in the optical spectrum. Given that the expected wavelength of [O II] falls in regions affected by strong sky emission lines, the limiting line flux is W m-2, corresponding to a limiting luminosity of W at . Assuming an emission line ratio of [O III]/[O II] = 3 for Seyfert 2s (Ferland & Netzer 1983) this limit is similar to that of [O III] on the OHS spectrum if it is not in a gap ( W m-2). The limit on the emission line to hard X-ray luminosity for N2_28 [] is greater than the typical ratio for low redshift Seyfert 2s of [ (Mulchaey et al. 1994). Therefore this X-ray source is not necessarily especially sub-luminous in emission lines.
The X-ray luminosity of N2_28 is much higher than can be accounted for by star-formation (e.g. Brandt et al. 2001) and, in addition to the X-ray hardness, indicates the presence of an obscured AGN at a level just below that normally used to divide quasars from Seyferts. The X-ray source resides in a host galaxy which has a luminosity a factor of two lower than a passively evolving galaxy assuming our redshift estimate is correct. Even if at the luminosity would only be equal to a passively evolving galaxy. This host is much less luminous than radio galaxies which have a mean luminosity of (e.g. Willott et al. 2002b) and probably reflects the fact that this source has a smaller black hole and a lower accretion rate. If the nearby extremely red galaxies are indeed members of a cluster containing the X-ray source, then the galaxy hosting the X-ray source is not even the dominant galaxy in the cluster.
6 Conclusions
The shape of the X-ray background requires the majority of sources in hard X-ray selected surveys to have flat X-ray slopes, most likely due to significant absorption of intrinsically steep slopes (e.g. Comastri et al. 1995). The range of X-ray absorbing columns in AGN and its evolution is poorly constrained at present and is one of the major aims of the on-going Chandra and XMM-Newton surveys. The finding of objects such as N2_25 which have only a small amount of optical reddening and a much greater X-ray absorbing column further complicates the picture and shows that optical obscuration does not always equal X-ray absorption. Therefore the popular radio-loud unified scheme which unifies radio galaxies and quasars on the basis of their orientation (by means of optical obscuration – Barthel 1989) may be quite different from that of X-ray selected AGN which are classified by their X-ray absorption. Unfortunately, investigating the links between the radio-loud and radio-quiet unified schemes is further complicated by the fact that luminous radio sources emit X-rays associated with the radio emission. As may be the case for the radio galaxy N2_21, this emission could dominate over that of the absorbed nucleus, meaning that even with the high spatial resolution of Chandra , it is difficult to accurately measure the nuclear absorbing columns in powerful radio galaxies.
Little is known about the large numbers of optically-faint () sources contained within hard X-ray surveys, due to the fact that they are too faint for optical spectroscopy. As discussed by Alexander et al. (2001) their X-ray to optical flux ratios, inferred luminosities (given their likely redshifts at ) and variability suggest that most are AGN. Since some of these objects are extremely red and hence accessible with near-IR spectroscopy on 8-m class telescopes, we have attempted to determine the redshifts and nature of two such sources with Subaru Telescope. Emission lines were only detected from the radio-loud source N2_21, although the lack of lines in the spectrum of N2_28 could plausibly be due to the strongest lines falling in the gap between the and bands. The upper limit on the ratio of emission line to hard X-ray luminosity for N2_28 is greater than the typical ratio for low redshift Seyfert 2s, so there is no evidence that such sources have particularly weak emission lines.
It seems likely that most optically-faint hard X-ray sources are obscured high-redshift AGN in which the rest-frame UV/optical light is dominated by the host galaxies. This provides an opportunity to study the nature of high-redshift galaxies with the only selection effect being that they contain a massive black hole which is undergoing substantial accretion. Our observations of the radio galaxy N2_21 show that its luminous host galaxy contains a large amount of dust and is likely to be undergoing a massive starburst. In contrast, the sub- host of the radio-quiet N2_28 has an SED consistent with an evolved stellar population at and may be located in a cluster. With the on-going follow-up observations of the EDXS, we plan to characterize the properties of a larger sample of optically-faint hard X-ray hosts and shed further light on the nature of the sources responsible for the hard X-ray background.
Acknowledgements
Thanks to Dave Alexander and Ross McLure for useful discussions. Many thanks to the referee Dan Stern for his interesting suggestions. Thanks to Katherine Blundell for help with obtaining the 8.4-GHz radio data. Based on data collected at Subaru Telescope, which is operated by the National Astronomical Observatory of Japan. The William Herschel Telescope is operated on the island of La Palma by the Isaac Newton Group in the Spanish Observatorio del Roque de los Muchachos of the Instituto de Astrofisica de Canarias. The United Kingdom Infrared Telescope is operated by the Joint Astronomy Centre on behalf of the U.K. Particle Physics and Astronomy Research Council. The VLA is a facility of the National Radio Astronomy Observatory (NRAO), which is operated by Associated Universities, Inc. under a cooperative agreement with the National Science Foundation. CJW thanks PPARC for support.
References
- [1] Akiyama M., et al., 2000, ApJ, 532, 700
- [2] Alexander D.M., Brandt W.N., Hornschemeier A.E., Garmire G.P., Schneider D.P., Bauer F.E., Griffiths R.E., 2001, AJ, 122, 2156
- [3] Alexander D.M., Aussel H., Bauer F.E., Brandt W.N., Hornschemeier A.E., Vignali C., Garmire G.P., Schneider D.P., 2002, ApJ, 568L, 85
- [4] Allen C.W., 1976, in “Astrophysical Quantities”, University of London, The Athlone Press, p.264
- [5] Almaini O., et al., 2002, MNRAS, in press, astro-ph/0108400
- [6] Baker J.C., 1997, MNRAS, 286, 23
- [7] Barthel P.D., 1989, ApJ, 336, 606
- [8] Barthel P.D., Miley G.K., 1988, Nature, 333, 319
- [9] Becker R.H., White R.L., Gregg M.D.,Brotherton M.S., Laurent-Muehleisen S.A., Arav N., 2000, ApJ, 538, 72
- [10] Blundell K.M., Rawlings S., 2000, AJ, 119, 1111
- [11] Bolzonella M., Miralles J.-M., Pelló R., 2000, A&A 363, 476
- [12] Brandt W.N., Mathur S., Elvis M., 1997, MNRAS, 285L, 25
- [13] Brandt W.N., Hornschemeier A.E., Schneider D.P., Alexander D.M., Bauer F.E., Garmire G.P., Vignali C., 2001, ApJ, 558, L5
- [14] Brunetti G., Cappi M., Setti G., Feretti L., Harris D.E., 2001, A&A, 372, 755
- [15] Brotherton M.S., 1996, ApJS, 102, 1
- [16] Calzetti D., Armus L., Bohlin R.C., Kinney A.L., Koornneef J., Storchi-Bergmann T., 2000, ApJ, 533, 682
- [17] Carilli C.L., Harris D.E., Pentericci L., Röttgering H.J.A., Miley G.K., Kurk J.D., van Breugel W., 2002, ApJ, 567, 781
- [18] Ciliegi P., et al., 1999, MNRAS, 302, 222
- [19] Comastri A., Setti G., Zamorani G., Hasinger G., 1995, A&A, 296, 1
- [20] Comastri A., Fiore F., Vignali C., Matt G., Perola G.C., La Franca F. 2001, MNRAS, 327, 781
- [21] Cowie L.L., Garmire G.P., Bautz M.W., Barger A.J., Brandt W.N., Hornschemeier A.E., 2002, ApJ, 566L
- [22] Dennett-Thorpe J., Bridle A.H., Laing R.A., Scheuer P.A.G., 1999, MNRAS, 304, 271
- [23] Eales S.A., Rawlings S., Law-Green J.D.B., Cotter G., Lacy M., 1997, MNRAS, 291, 593
- [24] Fabian A.C., Crawford C.S., Ettori S., Sanders J.S., 2001, MNRAS, 322, L11
- [25] Fabian A.C., Celotti A., Johnstone R.M., 2002, MNRAS, submitted, astro-ph/0204488
- [26] Fadda D., Flores H., Hasinger G., Franceschini A., Altieri B., Cesarsky C.J., Elbaz D., Ferrando P., 2002, A&A, 383, 838
- [27] Ferland G.J., Netzer H., 1983, ApJ, 264, 105
- [28] Francis P.J., Hewett P.C., Foltz C.B., Chaffee F., Weymann R.J., Morris S.L., 1991, ApJ, 373, 465
- [29] González-Solares E.A., et al., 2002, in preparation
- [30] Hamann F., Ferland G., 1993, ApJ, 418, 11
- [31] Hornschemeier A.E., et al., 2001, ApJ, 554, 742
- [32] Hughes D.H., Dunlop J.S., Rawlings S., 1997, MNRAS, 289, 766
- [33] Imanishi M., Ueno S., 1999, MNRAS, 305, 829
- [34] Ivison R.J., et al., 2002, MNRAS, in press, astro-ph/0206432
- [35] Iwamuro F., Motohara K., Maihara T., Hata R., Harashima T., 2001, PASJ, 53, 355
- [36] Jackson N., Eracleous M., 1995, MNRAS, 276, 1049
- [37] Jarvis M.J., et al., 2001, MNRAS, 326, 1563
- [38] Kaspi S., Smith P.S., Netzer H., Maoz D., Jannuzi B.T., Giveon U., 2000, ApJ, 533, 631
- [39] Kellermann K.I., Sramek R.A., Schmidt M., Green R.F., Shaffer D.B., 1994, AJ, 108, 1163
- [40] Kobayashi N., et al., 2000, in Proc. SPIE 4008: Optical and IR Telescope Instrumentation and Detectors, eds M. Iye, A. F. Moorwood, 1056
- [41] Maiolino R., Marconi A., Salvati M., Risaliti G., Severgnini P., Oliva E., La Franca F., Vanzi L., 2001a, A&A, 365, 28
- [42] Maiolino R., Marconi A., Oliva E., 2001b, A&A, 365, 37
- [43] Manners J.C., et al., 2002, MNRAS, submitted, astro-ph/0207622
- [44] Mathur S., 2000, MNRAS, 314L, 17
- [45] McCarthy P.J., van Breugel W., Kapahi V.K., 1991, ApJ, 371, 478
- [46] McIntosh D.H., Rix H.-W., Rieke M.J., Foltz C.B., 1999a, ApJ, 517L, 73
- [47] McIntosh D.H., Rieke M.J., Rix H.-W., Foltz C.B., Weymann R.J., 1999b, ApJ, 514, 40
- [48] McLure R.J., Dunlop J.S., 2001, MNRAS, 327, 199
- [49] McLure R.J., Jarvis M.J., 2002, MNRAS, in press, astro-ph/0204473
- [50] Moran E.C., Lehnert M.D., Helfand D.J., 1999, ApJ, 526, 649
- [51] Mulchaey J.S., Koratkar A., Ward M.J., Wilson A.S., Whittle M., Antonucci R.J.R., Kinney A.L., Hurt T., 1994, ApJ, 436, 586
- [52] Oliver S., et al., 2000, MNRAS, 316, 749
- [53] Pitman K.M., Clayton G.C., Gordon K.D., 2000, PASP, 112, 537
- [54] Pozzetti L., Manucci F., 2000, MNRAS, 317L, 17
- [55] Rawlings S., Willott C.J., Hill G.J., Archibald E.N., Dunlop J.S., Hughes D.H., 2002, MNRAS, in press
- [56] Risaliti G., Marconi A., Maiolino R., Salvati M., Severgnini, P., 2001, A&A, 371, 37
- [57] Roche N.D., Almaini O., Dunlop J.S., Ivison R.J., Willott C.J., 2002, MNRAS, in press, astro-ph/0205259
- [58] Sambruna R.M., Eracleous M., Mushotzky R., 1999, ApJ, 526, 60
- [59] Schmidt M., et al., 1998, A&A, 329, 495
- [60] Scott S.E., et al., 2002, MNRAS, 331, 817
- [61] Simpson C., 1998, ApJ, 509, 653
- [62] Stern D., et al., 2002, ApJ, 568, 71
- [63] Thompson D., et al., 1999, ApJ, 523, 100
- [64] Tozzi P., et al., 2001, ApJ, 562, 42
- [65] Vernet J., Fosbury R.A.E., Villar-Martín M., Cohen M.H., Cimatti A., di Serego Alighieri S., Goodrich R.W., 2001, A&A, 366, 7
- [66] Wandel A., Peterson B.M., Malkan M.A., 1999, ApJ, 526, 579
- [67] Ward M.J., Done C., Fabian A.C., Tennant A.F., Shafer R.A., 1988, ApJ, 324, 767
- [68] Willott C.J., Rawlings S., Blundell K.M., Lacy M., 1998, MNRAS, 300, 625
- [69] Willott C.J., Rawlings S., Blundell K.M., Lacy M., 1999, MNRAS, 309, 1017
- [70] Willott C.J., et al., 2001a, in “Galaxy Clusters and the High Redshift Universe Observed in X-rays”, eds. D. Neumann, F.Durret, J. Tran Thanh Van, astro-ph/0105560
- [71] Willott C.J., Rawlings S., Blundell K.M., 2001b, MNRAS, 324, 1
- [72] Willott C.J., Rawlings S., Archibald E.N., Dunlop J.S., 2002a, MNRAS, 331, 435
- [73] Willott C.J., Rawlings S., Jarvis M.J., Blundell K.M., 2002b, MNRAS, in press, astro-ph/0209439
- [74] Wills B.J, Browne I.W.A., 1986, ApJ, 302, 56
- [75] Young A.J., Wilson A.S., Terashima Y., Arnaud K.A., Smith D.A., 2002, ApJ, 564, 176