Abstract
Recently, with the Chandra X-ray Telescope we have detected several local X-ray absorption lines along lines-of-sight towards distant quasars. These absorption lines are produced by warm/hot gas located in local intergalactic space and/or in our Galaxy. I will present our observations and discuss the origin of the X-ray absorption and its implications in probing the warm/hot component of local baryons.
Chandra Detection of X-ray Absorption from Local Warm/Hot Gas
1 Introduction
The cosmic baryon budget at low and high redshift indicates that a large fraction of baryons in the local universe have so far escaped detection (e.g., Fukugita, Hogan, & Peebles 1998). While there is clear evidence that a significant fraction of these “missing baryons” (between 20-40% of total baryons) lie in photoionized, low-redshift Ly clouds (Penton, Shull, & Stocke 2000), the remainder could be located in intergalactic space with temperatures of K (warm-hot intergalactic medium, or WHIM). Resonant absorption from highly-ionized ions located in the WHIM gas has been predicted based on both analytic studies of structure formation and evolution (Shapiro & Bahcall 1981;Perna & Loeb 1998;Fang & Canizares 2000) and cosmic hydrodynamic simulations (Hellsten, Gnedin, & Miralda-Escudé 1998;Cen & Ostriker 1999a;Davé et al. 2001;Fang, Bryan, & Canizares 2002). Recent discovery of O 6 absorption lines by the Hubble Space Telescope (HST) and the Far Ultraviolet Spectroscopic Explorer (FUSE) (see, e.g., Tripp & Savage 2000) indicates that there may be a significant reservoir of baryons in O 6 absorbers. While Li-like O 6 probes about of the WHIM gas (Cen et al. 2001;Fang & Bryan 2001), the remaining is hotter and can only be probed by ions with higher ionization potentials, such as H- and He-like Oxygen, through X-ray observation.
Recently, with Chandra Low Energy Transmission Grating Spectrometer (LETGS) we detected resonance absorption lines from H- and He-like Oxygen in the X-ray spectra of background quasars, namely PKS 2155-304 and 3C 273. The detected lines can be categorized into (1) those at and (2) one redshifted intervening system. In this paper, we will discuss these detections and their implications for the physical properties of the hot gases that give rise to these absorption features.
| Table 1: Fitting parameters of the X-ray absorption Lines | |||
|---|---|---|---|
| PKS 2155-304 | 3C 273 | ||
| O viii Ly | O vii He | O vii He | |
| Line Widtha | |||
| EW (m) | |||
| SNR | 4.5 | 4.6 | 6.4 |
a. 90% upper limit of the line width , in units of .
b. Absorbed line flux in units of .
2 Data Reduction
PKS 2155-304 and 3C 273 are bright extragalactic X-ray sources used as Chandra calibration targets. They were observed with the Chandra LETG-ACIS (the observations ids for PKS 2155 are 1703, 2335, 3168; and the ids for 3C 273 are 1198, 2464, 2471). For detailed data analysis, we refer to Fang et al. 2002. We found all continua are well described by a single power law absorbed by Galactic neutral hydrogen.
After a blind search for any statistically significant absorption features, several absorption features with S/N 4 were detected in the spectra of both quasars in the 2–42 Å region of the LETGS spectral bandpass (Figure 1). These features were subsequently fit in ISIS (Houck & Denicola 2000).
3 Discussion
3.1 PKS 2155-304
The absorption feature at Å was reported by Nicastro et al. (2002) in the LETGS-HRC archival data. We concentrate on the absorption feature which appears at (619 eV). Considering cosmic abundances and oscillator strengths for different ions, O 8 Ly is the only strong candidate line between 18 and 20 Å , the measured wavelength de-redshifted to the source. It is plausible that the 20 Å absorption is due to O 8 Ly in a known intervening system at . With HST, Shull et al. (1998) discovered a cluster of low metallicity H 1 Ly clouds along the line-of-sight (LOS) towards PKS 2155-304, most of which have redshifts between and . Using 21 cm images from the Very Large Array (VLA), they detected a small group of four H 1 galaxies offset by kpc from the LOS, and suggested that the H 1 Ly clouds could arise from gas associated with the group (We use throughout the paper).
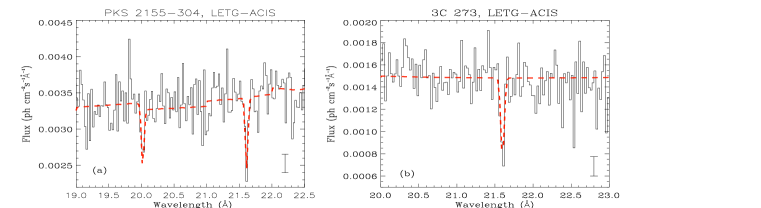
Taking the absorption line to be O 8 Ly, we estimate the column density is if the line is unsaturated. We can constrain the density of the absorbing gas, assuming it is associated with the intervening galaxy group. Since the line is unresolved, a lower limit of can be obtained. Here is the metallicity in units of 0.1 solar abundance, is the ionization fraction in units of 0.5, and is the path length in units of . A more reasonable estimate of the path length comes from the mean projected separation of 1 Mpc for the galaxies in the group, which gives . This implies a range of baryon overdensity ( 50 - 350) over the cosmic mean . Interestingly, Shull et al.(1998) estimate an overdensity for the galaxy group of 100.
In the case of pure collisional ionization, temperature is the only parameter of importance over a wide range of density so long as the gas is optically thin. The O 8 ionization fraction peaks at 0.5, and exceeds 0.1 for temperatures K. Using CLOUDY (Ferland et al. 1998) we find that photoionzation by the cosmic UV/X-ray background is not important for . CLOUDY calculations of the column density ratios between other ions and O 8 also show that K.
Assuming conservative upper limits of and an O 8 ionization fraction of , and a path length of , we estimate . This is about 10% of the total baryon fraction, or about 30-40% of the WHIM gas, if the WHIM gas contains about 30-40% of total baryonic matter. This baryon fraction is consistent with the prediction from Perna & Loeb (1998) based on a simple analytic model.
3.2 3C 273
Based on the detected line equivalent width () and non-detection of local O 7 He line at , we estimate the column density if the line is unsaturated