Did SN 1989B Exhibit a Light Echo?
Abstract
The late light curves of SN 1989B exhibited an emission excess relative to other type Ia supernovae. We investigate whether this emission excess suggests light echo emission from this supernova, or rather intense background galaxy contamination at the location of the supernova. We conclude that stellar emission can better explain the late spectra, and that the emission excess is likely due to background contamination.
1 Introduction
Two type Ia supernovae (SN 1991T and 1998bu) have been determined to have exhibited the “light echo” phenomenon, where dust in the vicinity of the SN scatters intrinsic SN light, making the SN detectable for years in reflected light (Schmidt et al. 1994, Cappellaro et al. 2001). Light echoes were suspected to be present when these supernovae (SNe) remained brighter at late epochs than expected from intrinsic luminosity sources. In both cases, light echo emission was confirmed when spectra taken at late times matched the continuous spectra of the peak emission (folded through the wavelength dependence of dust scattering), rather than the nebular emission expected at those epochs. Light echo emission from SN 1991T was further investigated with Hubble Space Telescope (HST) images of the light echo, showing both the extended nature of the echo and the evolution of the echo image with time (Sparks et al. 1999). Similarly, HST images of SN 1998bu revealed two light echo rings (Garnavich et al. 2001).
SN 1989B occurred in NGC 3627 and was well-observed from discovery111There were multiple discoverers, including, Waagen, E., Knight, S., Evans, R.O., Villi, M., Cortini, G., and Johnson, W. (IAUC 5239). until 370 days post-peak by Barbon et al. (1990) and Wells et al. (1994). In a 1995 survey of recent SNe designed to produce a list of light echo candidates for further study, Boffi et al. (1999) observed NGC 3627 and detected fuzzy, blue emission from the location of SN 1989B. In this paper, we study SN 1989B in detail and assert that the available information suggests against this being the third SN Ia with detected light echo emission.
In section 2, we compare the year one photometry with other SNe Ia and discuss how these observations suggest an excess of emission. In section 3, we compare the observations of SN 1989B made years after the SN explosion with observations of the light echo from SN 1991T and determine that the fading light curves are similar. In section 4, we use the constraints derived from the light curve studies in an analysis of spectra taken within the first year after the SN explosion, determining that the emission excess is better explained by a collection of B-A stars than by the presence of light echo emission. We conclude with a discussion of the importance that a detection of light echo emission would have upon the study of SNe Ia, and how the example of SN 1989B demonstrates the utility of obtaining late spectra of SNe.
2 Light Curves to +351 days
2.1 Evidence of Excess Emission
SN 1989B was detected before B-band maximum and the SN was well-observed by many observers. The most complete study was performed by Wells et al. (1994), which included UBVRIJHK-band photometry and spectra at many epochs. The SN is understood to have been a so-called normal SN Ia, exhibiting neither the light curve, nor spectral anomalies seen in super-luminous SNe (i.e. 1991T, 1992bc, etc.) and sub-luminous SNe Ia (i.e. 1991bg, 1998de, 1999by, etc.). The color indices indicated that the SN was highly reddened, reddening was also suggested by the large equivalent width of Na-D and Ca-K absorption lines. High-resolution spectra revealed that there were at least two Na-D absorption features with red-shifting that placed them in NGC 3627 (Bolte et al. 1989).
Although the early observations suggested a SN Ia typical of the normal sub-class, the late observations revealed anomalous late light curves. Milne, The and Leising (1999) (hereafter MTL99), studied the late emission from eight normally- or super-luminous SNe Ia, comparing V- and B-band photometry with simulated light curves. Of those eight SNe, only two were not able to be fit by the simulated light curves, SNe 1991T and 1989B. SN 1991T had already been revealed to have been dominated by light echo emission after 600 days (Schmidt et al. 1994). This left SN 1989B as the only SN of the eight that was not explained by the simulated light curves. Milne, The and Leising (2001, hereafter MTL01) extended their earlier work by studying the B,V,R, and I band light curves after 65 days of a larger collection of SNe Ia. They asserted that the late light curves follow two distinct shapes; 1) normally- and super-luminous SNe Ia follow a similar evolution which is consistent with a single curve.222SNe 1991T and 1998bu were used in that study. However, only the data before the light echoes contributed were used. and 2) sub-luminous SNe Ia follow an evolution different from normally- and super-luminous SNe Ia and possibly consistent with a single curve.333Recent observations of the very sub-luminous SN 1999by suggests that the late light curves of very sub-luminous SNe Ia might differ from slightly (or transitional) sub-luminous SNe Ia, such as SN 1986G (Garnavich et al., in preparation).
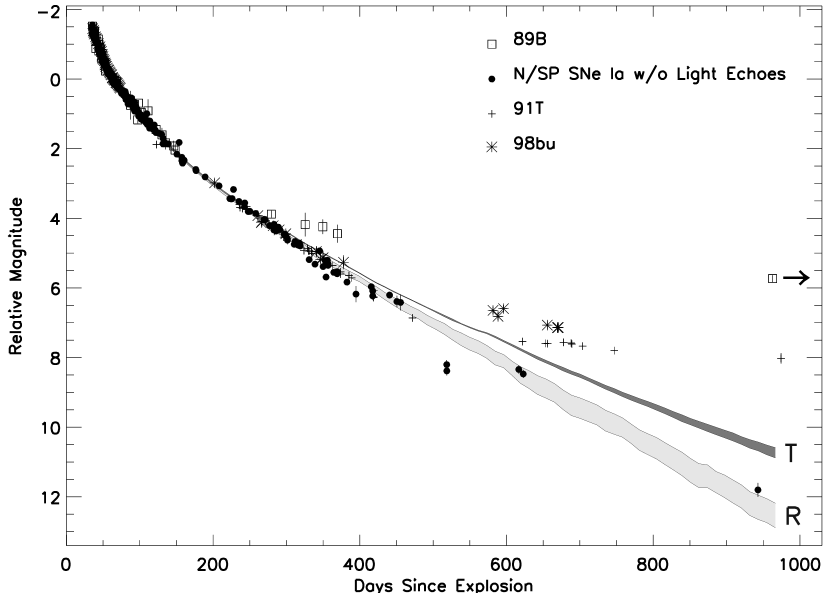
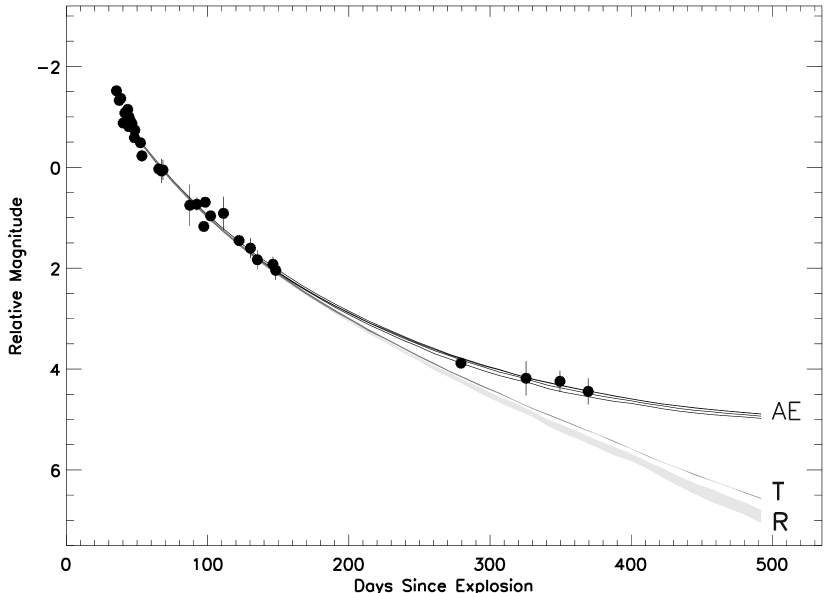
Shown in Figure 1 are the V-band light curves of SNe 1989B, 1991T, and 1998bu compared with the light curves of 16 other normally- or super-luminous SNe Ia. It is apparent that initially these three SNe evolve similarly with the other SNe, but at later times their curves flatten dramatically. The data has been fit with model-generated energy deposition rates from the SN model DD23C (Hőflich et al. 1998). The earlier studies (MTL99, MTL01) investigated positron transport in SNe Ia, concluding that at late times positrons escape the ejecta in quantity as would be permitted by either a radially-combed magnetic field or by a weak magnetic field (denoted in Figure 1 by “R”).444The simulated light curves have finite thicknesses due to the allowed range of ionizations in the simulations. See MTL99 for an explanation of this effect. The alternative transport scenario is that a strong, turbulent magnetic field traps positrons in-situ, allowing for delayed energy deposition, but no escape. The trapping light curves (denoted by “T”) remain brighter than the radial curves, but are not bright enough to explain the late data for SNe 1989B, 1991T and 1998bu. Shown in Figure 2 are the same simulated energy deposition rates fit to the SN 1989B data after the addition of a second light source which has a constant luminosity. The data are consistent with a transition from intrinsic emission to this additional emission.
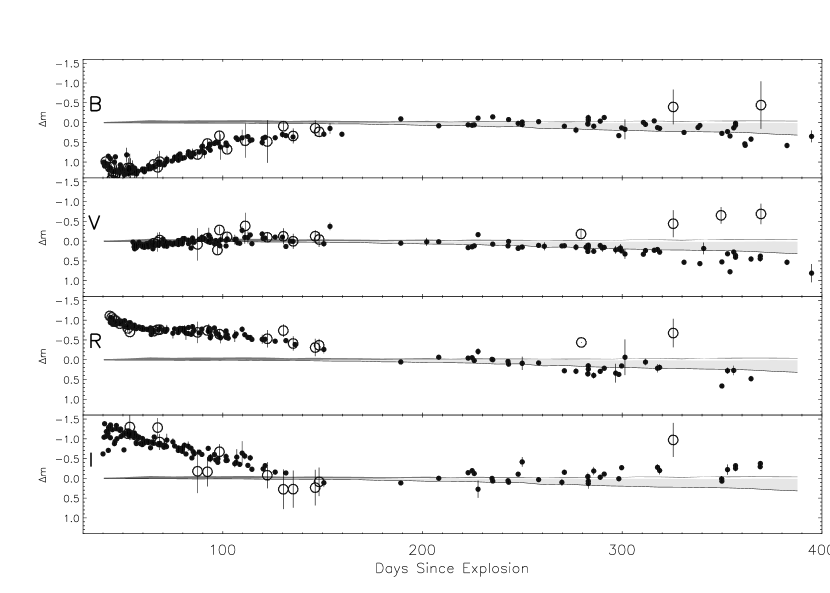
Excess emission is also apparent in the B,R and I band data. Shown in Figure 3 are B,V,R, and I band observations of SN 1989B compared with other normally- and super-luminous SNe Ia. The “delta magnitude” format is used in this figure, meaning that all data and simulations are displayed as residuals relative to instantaneous deposition of 100% of the positron kinetic energy. The fits of the simulated light curves to the data is complicated by color evolution from 50 -200 days (as discussed in MTL01), however estimates of the amount of excess can be derived from comparisons with the other SNe. SN 1989B is roughly one magnitude brighter than the other SNe at +351 days, with B-V=0.500.75. At +307 days, we derive B-V = 0.51 0.62, V-R = -0.08 0.61, V-I = 0.40 0.62. The errors are derived from both the photometry errors and the scatter of the other SNe Ia and are added in quadrature.
2.2 Potential Sources of Emission Excess
The data shown in Figures 1-3 demonstrate that there was an excess of emission in the optical bands at the location of SN 1989B. However, the data do not require that the emission is from the SN, or even if it was from the SN, it does not isolate a light echo as the emission source. If the emission excess is due to a light echo, the spectrum and flux would be expected to be similar to the previously detected SN Ia light echoes. The B-V indices derived in the previous section are redder, but consistent with the values of -0.130.21 and -0.1 for 1991T and 1998bu, respectively (Schmidt et al. 1994, Cappellaro et al. 2001). The constant luminosity emission source added in Figure 2 is 6.7 magnitudes fainter than the peak V magnitude of SN 1989B. By comparison, SNe 1991T and 1998bu were both 9 magnitudes fainter. If this additional emission is entirely due to a light echo, it would imply a light echo about seven times more efficient at scattering the peak light than the other two light echoes. The images of the light echoes from SNe 1991T and 1998bu are very irregular, presumably because of density inhomogeneities in the clouds of scattering dust. It seems plausible that a scattering medium that uniformly possesses the characteristics of the brighter limbs of the 1991T and 1998bu light echoes would be able to enhance the total efficiency by a factor of seven. We point out that MTL99 saw hints that the light echo for SN 1991T “turned on” after 450 days, again suggestive that light echo magnitudes can vary appreciably.
There are a number of alternative explanations for the excess emission, both related to the SN, and related to the host galaxy background. We will defer discussion of the latter to section 3 (and the Boffi et al. 1999 observations). Of alternative SN sources of emission, the production in SN 1989B of additional, longer-lived radioisotopes is the most plausible. The light curves from 100 -365 days are fit in Figures 1-3 with the energy deposition from the gamma-ray and positron decay products of 56Co decays. The decays of 57Ni 57Co 57Fe produce gamma-rays and the decays of 44Ti 44Sc 44Ca produce gamma-rays and positrons, the energy deposition from the interactions of these decay products with the ejecta might be suggested to explain the emission excess. The primary argument against this mechanism is based on the spectra (as will be discussed in section 4), but the yields required to explain the light curve are too large, which constitutes a strong secondary argument. Using the same gamma-ray and positron transport algorithms used to generate the energy deposition rates shown in MTL99 and MTL01, we estimated the amount of each isotope that would have to be produced to account for the excess. In the lowest-yield scenario, we determined that 1.5 M⊙ of 57Ni (and/or 57Co) and 1.0 M⊙ of 44Ti would have to be produced, yields far in excess of those allowed by observations.
In summary of Section 2, emission attributed to SN 1989B was observed to exhibit flattening in the multi-band photometric evolution. This flattening is consistent with the contribution from a constant luminosity emission source. These observations do not necessitate light echo emission, but they would provide insight into the nature of the light echo emission, if it were to be determined that a light echo is present.
3 Detection of Emission after 5 Years
Although not continuously monitored, SN 1989B was observed on one occasion since the Wells et al. observations. B,V, and R band observations were made by Boffi et al. (1999) as part of a survey of potential light echo candidates. The Boffi et al. 1999 observations detected emission at the location of SN 1989B, with V = 19.93, B-V = -0.03, and V-R = 0.02 magnitudes. The SN was considered a light echo candidate as it met their three criteria, 1) the emission was located near enough to the reported locations of the (now faded) SN, 2) the emission appeared to be from a compact patch rather than from a point-like source or a broadly-extended patch, and 3) the emission was bluer than expected from clusters of background stars. We note that the color indices are consistent with the values derived from the +307 and +351 day observations.
Wells et al. 1994 pointed out that the host galaxy background is bright at the location of SN 1989B, it would require observations with better spatial resolution to determine whether the patches are due to a light echo, or instead to a collection of stars. Assuming the emission to be due to a light echo, extrapolation to the Boffi et al. 1999 observations from the Wells et al. 1994 observations suggest that the light echo would have faded by 1.2 magnitudes in V. After accounting for the fading contribution from the intrinsic emission, the decline rate of the light echo is found to be 0.14 mag yr-1, roughly equal to the 0.16 mag yr-1 decline rate of SN 1991T (as derived from the Schmidt et al. 1994, and the Sparks et al. 1999 V-band observations taken 3 years apart).
Different geometries of scattering material can lead to different decline rates, and the color of the light echo would change if multiple scattering is dominant. Rather than discuss implications of the exact value of the decline rate, we emphasize that the emission detected 6 years after the SN explosion has both the correct luminosity and the correct color to be a single-scatter dominated light echo, within the limited precision of the data.
4 Spectra taken during the First Year
It is clear from Figure 2 that the transition from dominance by intrinsic emission to dominance by other emission occurs between 200 -300 days after the SN explosion. In addition to photometry, Wells et al. 1994 took a sequence of spectra of SN 1989B. The epochs of these spectra ranged from -7 days to +346 days. Shown in Figure 5 are six spectra from SN 1989B, taken at 100 365 days since the SN explosion (again assuming an 18 day rise to peak B magnitude). The sequence demonstrates that from 100 -170 days the spectra transition from continuum emission to nebular emission (as is typical of SNe Ia during that epoch), but that the 300+ day spectra appear to be continuum emission. These three-stage continuum-nebular-continuum transitions were also seen in SNe 1991T and in 1998bu and were the basis of the determining that the late emission from each was from a light echo.555We point out that both SNe 1991T and 1998bu were observed after 600 days, at which time the nebular-continuum transition was complete. The 365 day spectrum of SN 1989B is mid-transition. To date, there are no post-transition spectra of SN 1989B. If the emission excess were due to additional radioactivities, the late spectra would be expected to be nebular. The fact that significant continuum emission is present at 365 days constitutes the primary argument against additional radioactivities as the source of the emission.
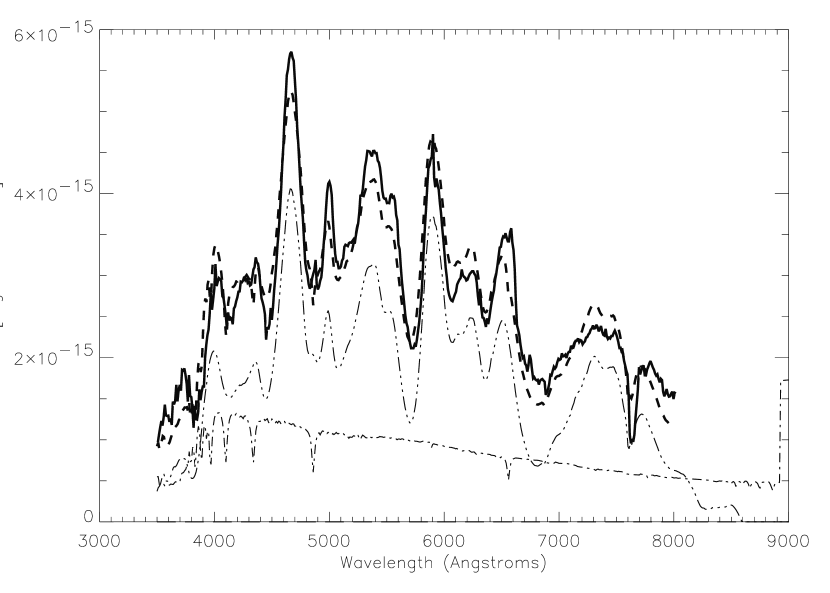
We study this two-stage transition by fitting a sequence of spectra of SN 1989B. We combine spectra from other SNe at similar epochs first with the integrated spectrum of SN 1989B reflected off of dust, and second with individual stellar spectra. By comparing the ability of the light echo/nebular emission spectra to fit the SN 1989B spectra with the ability of the stellar spectra/nebular emission spectra to fit the same spectra, we investigate whether the emission excess is more likely to be due to a light echo or to background contamination. To generate a light echo, we blended the collection of spectra taken during the first 133 days, weighing each according to the bolometric light curve (Contardo et al. 2000). All of the spectra used have been reddened by dust along the line of sight, so the integrated spectrum was de-reddened assuming E(B-V) = 0.37 (Wells et al. 1994). Near-peak spectral sequences were obtained by two groups, Wells et al. 1994, and Barbon et al. 1990. To avoid complications from different analysis methods, and to afford a glimpse at the effects of irregular spectral sampling upon the integrated spectrum, we treated the two spectral sequences separately. The two integrated spectra are shown in Figure 6, and appear to be largely continuous with bumps at roughly 4600, 4950, 5600, 5900, and dips at 4900 and 5750. We use the Wells et al. 1994 spectrum for fitting, both because it is the better sampled spectrum, and because the late spectra we fit were also taken by Wells et al.. The stellar spectra were obtained from an on-line catalog, and are of individual stellar types.666The stellar spectra were obtained at http://zebu.uoregon.edu/spectrar.html.
The 108, 110 and 133 day spectra would be expected to be essentially pre-light echo (based on the light curve comparisons), and are comprised of both continuous emission with absorption lines, and of emission lines. These spectra can be reasonably well-fitted with the spectra from other SNe Ia paired with a light echo or a stellar spectrum. Shown in the upper panel of Figure 7 is the 108 day spectrum fitted with a combination of a light echo and a nebular spectrum from SN 1994ae (Bowers et al. 1997). Shown in the lower panel is the same spectrum fitted with the combination of a stellar spectrum of a A5-7V star and the nebular spectrum of SN 1994ae. Results of fits of these combinations to the SN 1989B spectrum are shown in Table 1. The addition of light echo and/or stellar emission clearly improves the fits to the 108 day spectra, suggesting that additional emission is present in the spectra as early as 108 days. This emission is likely to be stellar, a byproduct of host galaxy light entering the slit. Results of fits to the 110 and 133 day spectra are not shown or listed due to their lack of coverage of the important 3500 -4500 wavelength range.
The 170 day spectrum (Figure 8) demonstrates that the SN emission is largely nebular by this epoch. This spectrum can be well-fitted with the nebular spectrum of SN 1987L (Ruiz -Lapuente et al. 1993). The addition of a light echo or stellar emission improves the fit slightly, although there are no unique spectral features that could differentiate between the light echo and the stellar emission.
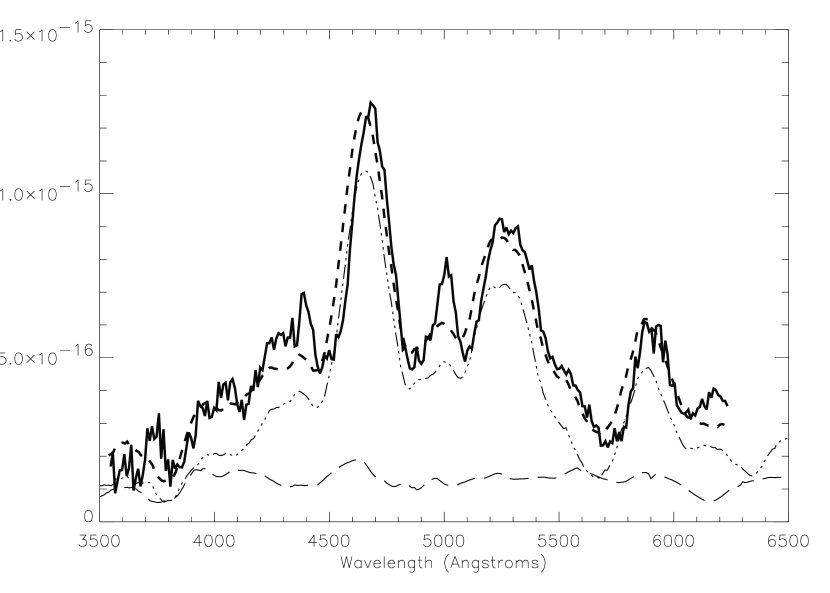
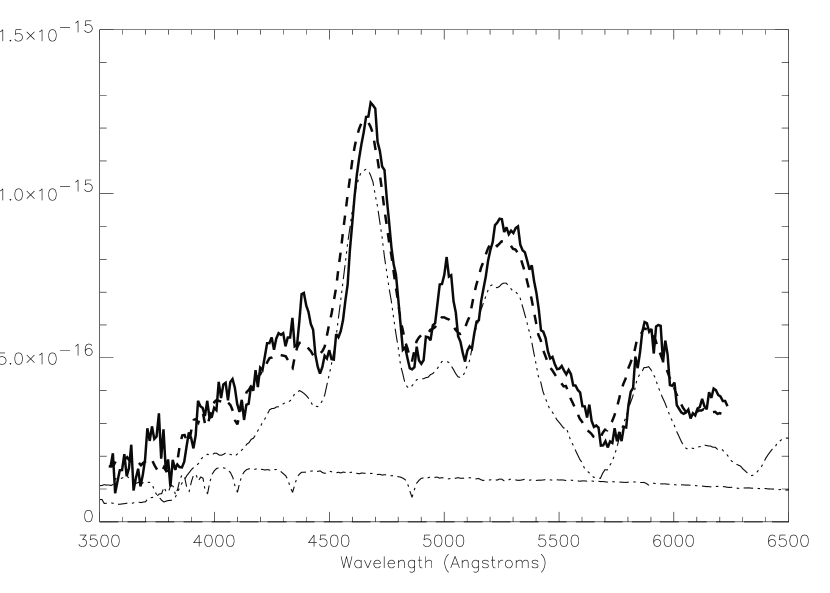
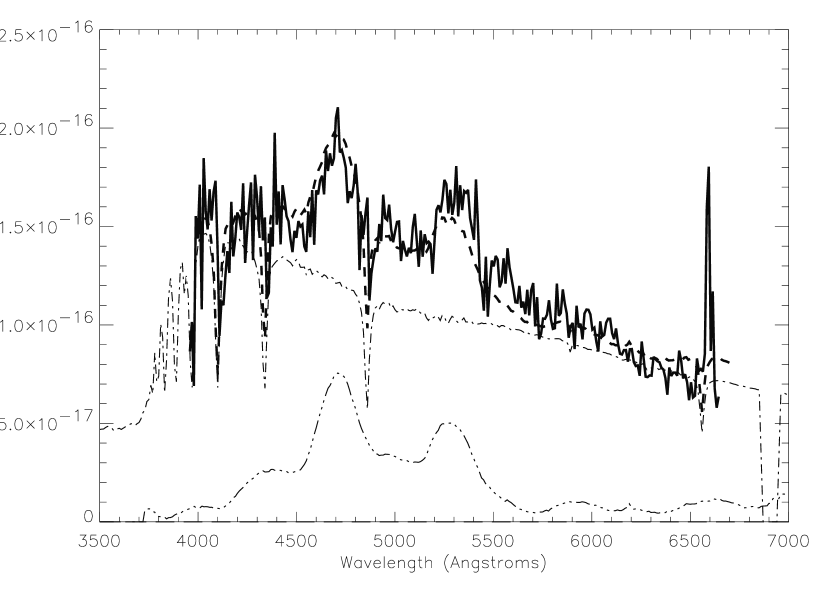
The 330 day spectrum is the first that is expected to be dominated by the additional emission. Shown in the upper panel of Figure 9 is the 330 day spectrum fitted with a combination of a light echo and a nebular spectrum from SN 1996X (Salvo et al. 2001). Shown in the lower panel is the same spectrum fitted with the combination of a stellar spectrum of a G9-K0V star and the nebular spectrum of SN 1996X. In both cases, the additional emission contributes primarily blue-ward of the 4700 bump and red-ward of the 5250 bump; these wavelength ranges are better fitted with the stellar spectrum than with a light echo. The light echo/nebular combination generates a red-ward edge to the 4700 feature that is not present in the 1989B spectrum. The near-peak spectra from both Wells et al. 1994 and Barbon et al. 1990 clearly display a peak around 4550. It does not seem realistic that a light echo could be present without it producing a feature at 4550. The 4900 emission feature is not reproduced in either the light echo or the stellar spectrum. However, the sequence of earlier SN 1989B spectra have shown a 4900 bump that exceeds the same feature in comparison spectra. Thus, the 4900 bump might be nebular emission that is poorly modelled with the SN 1996X spectrum (Liu et al. 1997 attributes the nebular emission at 4900 to a pair of FeII/FeIII lines).
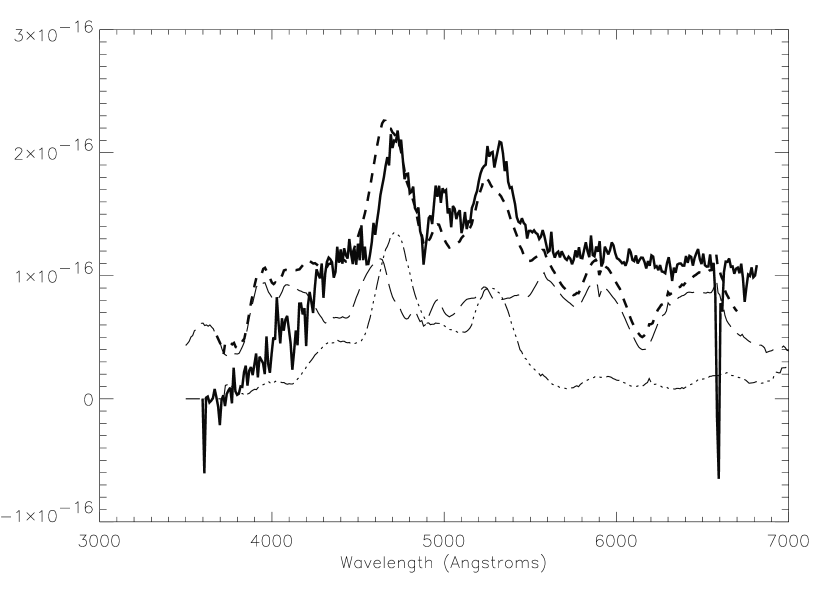
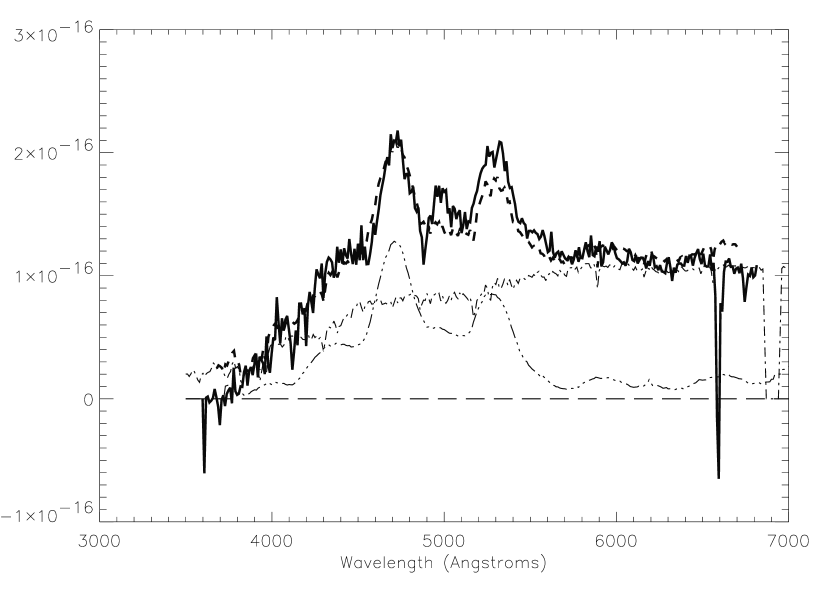
A second late spectrum was obtained by Wells et al. 1994, at day 365. This spectrum was fitted similarly to the 330 day spectrum. The resulting fits are shown in Figure 10. The same nebular spectrum of SN 1996X was used for comparison, as the shape of the nebular spectrum is not expected to change very much from 330 -365 days. It is clear that the continuous emission in this spectrum is quite different than the continuum seen in the 330 day spectrum. In addition, the H line observed at 6600 is an emission line in the 365 day spectrum, whereas it is an absorption line in the 330 day spectrum. The light echo’s angular diameter would be expected to be less than 6 mas at one year, which would be a point source compared with the 0.4 arcsec pixel-1 slit width of the instrument. Since the nebular emission was detected in both the 330 day and 365 day spectra, it is likely that the variation in the spectra is due to differences in the background sampling rather than due to differences in the sampling of the light echo. In the lower panel of Figure 10, the 365 day spectrum is shown fitted with the nebular emission from SN 1996X combined with a stellar spectrum from an A1-3V star. Again the stellar spectrum affords the better fit. As with the 330 day spectrum, the light echo generates an absorption feature at 6150 that is not present in the 365 day spectrum. Also, the 4700 bump is better fitted by the stellar spectrum than by the light echo. There are absorption features in the 365 day spectrum that suggest Balmer lines (as would be expected from stellar spectra of this spectral type), although the spectrum does not reach to short enough wavelengths to fully sample the Balmer discontinuity.
In summary, spectra taken of SN 1989B between 100 -170 days after the explosion reveal it to have been a relatively normal SN Ia, becoming increasingly dominated by nebular emission lines. The addition of stellar and/or light echo emission as secondary components improves the fits to these spectra. Two spectra taken after 300 days exhibited substantial continuum emission, which is not expected from SN Ia at that epoch. The continuous nature of these spectra argue against additional radioactivities as an explanation for the excess emission seen in the light curves. The spectra can be suitably reproduced with combinations of nebular emission plus stellar spectra, with these combinations affording better fits overall than combinations of nebular emission plus light echo emission. The two late spectra exhibit different continua, this is likely due to differing background contamination from two different slit orientations. The preference for nebular/stellar emission combinations evident in Table 1 does not preclude a light echo contributing at some, lower level, which might be observable in a future observation. The light echo spectrum is not rich with structure, but in the absence of the nebular emission (as would be the case if a spectrum were obtained now) a light echo would be apparent in a sufficiently high S/N spectrum.
5 Discussion
The declining light curves, late images, and one-year spectrum of SN 1989B all appear to be consistent with the existence of an emission excess at the location of the SN. If a light echo from this SN is the dominant contributor of this emission excess, it is more efficient (by roughly a factor of seven) at reflecting light than the previous two SN Ia light echo detections, SN 1991T and SN 1998bu. However, the current collection of observations suggest against the dominance of light echo emission as a source of this emission excess, favoring instead background contamination. Bearing in mind that it has been suggested that light echoes might be detectable for decades, the opportunity remains to further study this region. Two promising observations would be a high-resolution image of the SN 1989B region, and a high S/N spectrum of the region (now that the intrinsic, nebular emission has faded). The first observation has been selected for the HST-ACS (as a GTO observation), the second would be a good observation for a large ground-based telescope.
Whether or not the emission excess is due to a light echo, the late spectra suggest that the emission is not intrinsic to the supernova. This removes SN 1989B as an exception to the tendencies claimed at late times for SNe Ia (i.e. that the late light curves show evidence of positron escape). Although it is unlikely that a light echo dominates the emission excess, a light echo could be present at some level. If present, a light echo could be used to probe the medium surrounding SN 1989B, and for polarization images of the light echo to be used to estimate the distance to NGC 3627.
| Epoch | Wavelength | Neb. + Echo | Neb. + Stellar | Neb. -Only | ||||
|---|---|---|---|---|---|---|---|---|
| Range | N:LEb | N:Stel.d | Type | |||||
| 108 | 3500-8000 | 2.77 | 3.2 | 0.1 | 2.48 | 1.5 | A5-7V | 3.57 |
| 170 | 3540-6220 | 0.49 | 3.4 | 0.3 | 0.43 | 2.3 | A5-7V | 0.62 |
| 330 | 3680-6700 | 0.31 | 0.7 | 0.1 | 0.20 | 0.4 | G9-K0V | 0.46 |
| 365 | 3950-6700 | 0.18 | 0.4 | 0.7 | 0.14 | 0.2 | A1-3V | 0.44 |
| a | Standard deviation of spectral fit in units of 10-16 erg cm-2 s-1 |
|---|---|
| b | Nebular to light echo ratio in the 3500 -9700 wavelength range. |
| c | Scattering index of light echo (). |
| d | Nebular to stellar emission ratio in the 3500 -9700 wavelength range. |


References
- (1) Barbon, R., Benetti, S., Rosino, L., Cappellaro, E., Turatto, M. 1990, A&A, 237, 79B.
- (2) Boffi, F.R., Sparks, W.B., Macchetto, F.D. 1999, A&A, 138, 253.
- (3) Bolte, M., Saddlemyer, L., Mendes de Oliveira, C., Hodder, P. 1989, PASP, 101, 921.
- (4) Bowers, E.J.C., Meikle, W.P.S., Geballe, T.R., Walton, N.A., Pinto, P.A., Dhillon, V.S., Howell, S.B., & Harrop-Allin, M.K. 1997, MNRAS, 290, 663.
- (5) Cappellaro, E., Patat, F., Mazzali, P.A., Benetti, S., Danziger, J.I., Pastorello, A., Rizzi, L., Salvo, M., Turatto, M. 2001, ApJ, 549, L215.
- (6) Chevalier, R.A. 1986, ApJ, 308, 225.
- (7) Contardo, G., Leibudgut, B., Vacca, W.D. 2000, A&A, 359, 876.
- (8) Garnavich, P.A., et al. 2001, BAAS, 199, 4701G.
- (9) Hőflich, P., Wheeler, J. C., & Thielemann, F.-K. 1998, ApJ, 495, 617.
- (10) Liu, W., Jeffery, D.J., Schultz, D.R., Quinet, P., Shaw, J., Pindzola, M.S. 1997, ApJ, 489, L141.
- (11) Milne, P.A., The, L.-S., Leising, M.D. 1999, ApJS, 124, 503.
- (12) Milne, P.A., The, L.-S., Leising, M.D. 2001, ApJ, 559, 1019.
- (13) Ruiz-Lapuente, P., Jeffery, D.J., Challis, P.M., Filippenko, A.V., Kirshner, R.P., Ho, L.C., Schmidt, B.P., Sanchez, F., Canal, R. 1993, Nature, 365, 728.
- (14) Schmidt, B.P., Kirshner, R.P., Leibundgut, B., Wells, L.A., Porter, A.C., Ruiz-Lapuente, P., Challis, P., Filippenko, A.V. 1994, ApJ, 434, L19.
- (15) Sparks, W.B., Macchetto, F., Panagia, N., Boffi, F.R., Branch, D., Hazen, M.L., Della Valle, M. 1999, ApJ, 523, 585.
- (16) Wells, L.A., et al. 1994, AJ, 106, 2233.