CLASS B0445+123: A new two-image gravitational lens system
Abstract
A new two image gravitational lens system has been discovered as a result of the Cosmic Lens All-Sky Survey (CLASS). Radio observations with the VLA, MERLIN and the VLBA at increasingly higher resolutions all show two components with a flux density ratio of 7:1 and a separation of 134. Both components are compact and have the same spectral index. Follow-up observations made with the VLA at 8.4 GHz show evidence of a feature to the south-east of the brighter component and a corresponding extension of the weaker component to the north-west. Optical observations with the WHT show 1 extended emission aligned in approximately the same direction as the separation between the radio components with an R-band magnitude of .
keywords:
– gravitational lensing – radio sources:individual:B0445+123| Date | Telescope | Frequency/Band | Time on source | Resolution/Seeing |
|---|---|---|---|---|
| (yyyymmdd) | (arcseconds) | |||
| 19950903 | VLA | 8.4 GHz | 30 seconds | 0.2 |
| 19990702 | VLA | 15 GHz | 3 hours | 0.1 |
| 19990903 | VLA | 8.4 GHz | 3 hours | 0.2 |
| 20000309 | MERLIN | 5 GHz | 1 hour | 0.05 |
| 20010321 | VLBA | 5 GHz | 1 hour | 0.002 |
| 20020203 | WHT | R-band | 4x600 seconds | 1.0 |
| 20011117 | Keck | Spectrum | 1 hour (blue), 1 hour (red) |
 |
 |
1 Introduction
The Cosmic Lens All-Sky Survey (CLASS), conducted in four phases between 1994 and 1999, has mapped a total of 16,503 radio sources with the aim of detecting gravitationally lensed, flat-spectrum, compact objects. The sources for the first two phases were selected from the 87GB (Gregory & Condon 1991) catalogue while those in the later CLASS-3 and 4 samples were chosen from the updated GB6 (Gregory et al. 1996) survey when it became available. Spectral selection was performed by comparing the 5 GHz 87GB (or GB6) flux with that from the 1.4 GHz NVSS catalogue (Condon et al. 1998); sources with a spectral index, , of -0.5 between 1.4 and 5 GHz (where ) and total flux densities 30 mJy at 5 GHz were then included in the list of targets for CLASS. The initial selection of the CLASS samples is described in greater detail in Myers et al. (2002) and radio maps and catalogues covering the entire CLASS sample are available at http://www.jb.man.ac.uk/research/gravlens/.
Each object in the survey was first mapped at a resolution of 0.2 arcseconds with the VLA (Very Large Array) at a frequency of 8.4 GHz. The images were then systematically examined for signs of structure. Potential lens candidates are those sources displaying multiple compact components within 15′′ of each other. They were selected from the CLASS sample according to specific criteria; the full width at half maximum (FWHM) of at least two of the components must be 170 mas when observed with the VLA at 200-mas resolution, the separation of the components must be 300 mas, all components observed must have similar surface brightnesses, the sum of the 8.4-GHz flux densities must be 20 mJy, and the flux density ratio between the two brightest components must be 10:1.
In order to distinguish between physically extended objects (e.g. core-jet systems) and those displaying gravitational lensing effects, sources displaying multiple compact components in the VLA images were mapped at a frequency of 5 GHz and a resolution of 50 mas using MERLIN (Multi-Element Radio Linked Interferometer Network). Sources showing components with significantly different surface brightnesses at this stage of the survey were rejected from the search.
Sources surviving this stage of the selection process were then mapped at a resolution of 2 mas with the VLBA (Very Long Baseline Array). Browne et al. (2002) describes the candidate selection criteria and follow up procedures in greater detail.
In this paper we describe the follow up observations of one of these candidates, CLASS B0445+123, which lead us to the conclusion that it is a two-image gravitational lens system.
2 Radio Observations
CLASS B0445+123 was first imaged with the VLA in 1995 during the second phase of CLASS and follow-up observations were carried out with both the VLA, MERLIN and the VLBA. The data were calibrated using AIPS (Astronomical Image Processing System, distributed by the U.S. National Radio Astronomy Observatory) and then mapped and self-calibrated in DIFMAP (Shepherd 1997). A summary of all the observations made of B0445+123 is given in Table 1 and the flux densities of both components for each observation are listed in Table 2.
| Component | RA | Dec | S5 | S5 | S8.4 | S8.4 | S15 |
|---|---|---|---|---|---|---|---|
| (J2000) | (J2000) | (MERLIN) | (VLBA) | (V95) | (V99) | (V99) | |
| A | 04 48 21.990 | +12 27 55.409 | 25.0 | 16.6 | 27.1 | 24.5 | 32.0 |
| B | 04 48 22.070 | +12 27 56.018 | 4.2 | 2.7 | 3.7 | 4.4 | 4.3 |
 |
 |
 |
 |
2.1 VLA
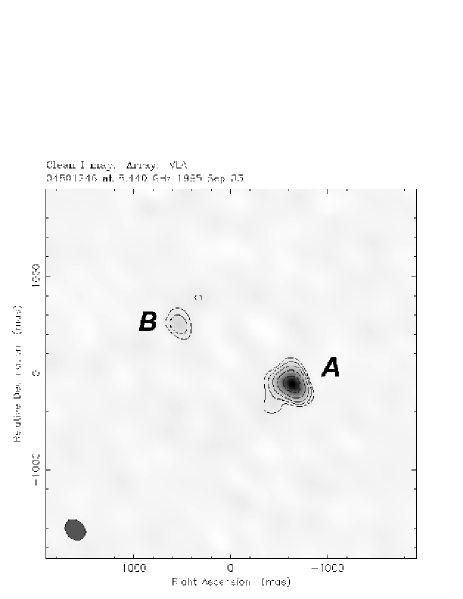
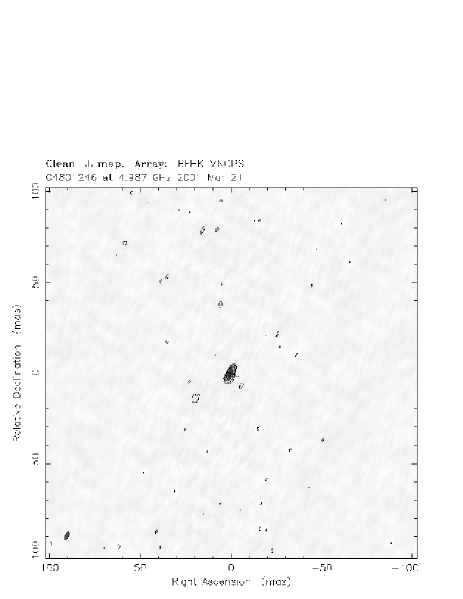
B0445+123 was observed with the VLA in its largest, “A” configuration on 03 September 1995. Myers et al. (2002) describe the VLA observations and the processing carried out on the CLASS data in greater detail. The original VLA image (Figure 1, left) shows two distinct components with a separation of 134 and a flux density ratio of 7.3:1. The brighter and fainter components are given the designations A and B respectively, according to the usual convention, and they have a combined flux density at 8.4 GHz of 30.8 mJy. Component A appears slightly extended towards the south-east.
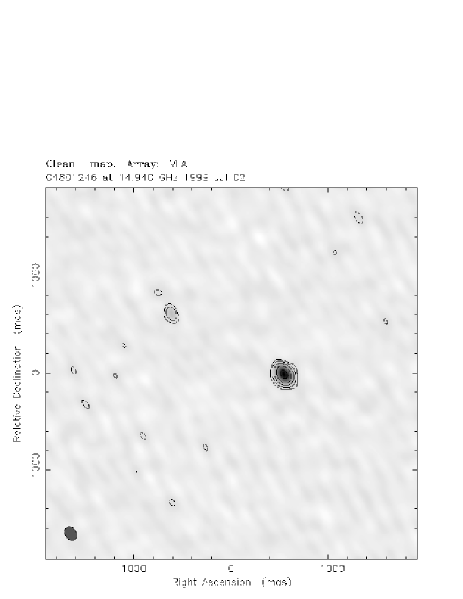
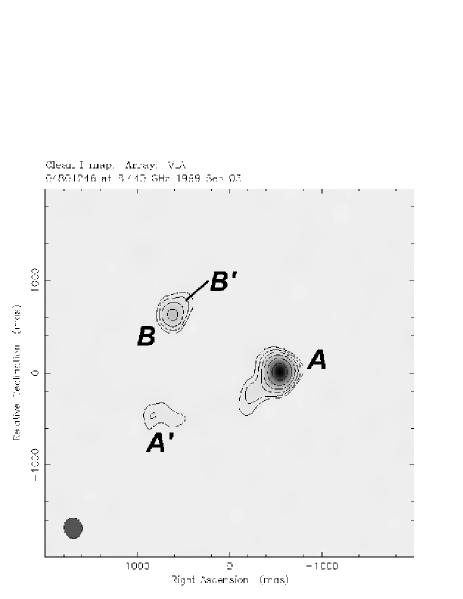
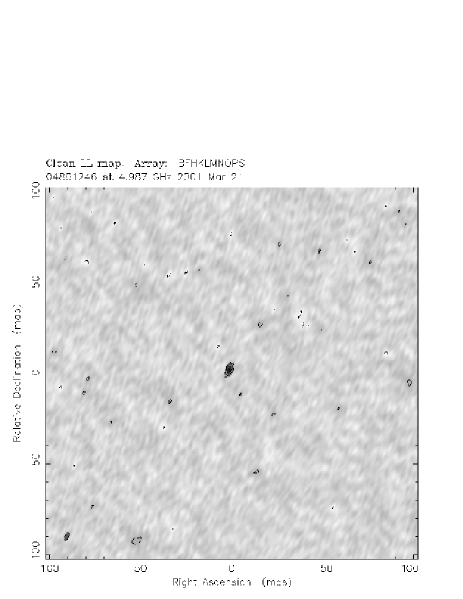
Further observations were made in 1999 at 15 and 8.4 GHz (Figure 2, top left and top right respectively). Deep observations at 8.4 GHz show a clear extension to the south-east of component A, including a weaker component A′, and signs of a corresponding elongation (B′) of component B to the north-west.
2.2 MERLIN
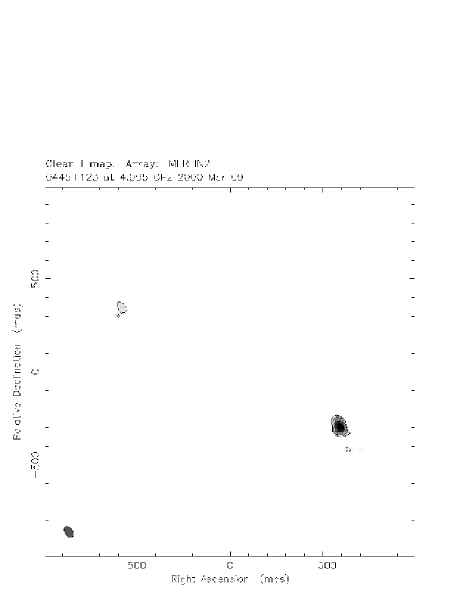
Snapshot observations of B0445+123 were made on 09 March 2000 with MERLIN at a frequency of 5 GHz and a resolution of 50 mas. The data were phase calibrated using the source B0441+106 with a switching cycle of three minutes on source to two minutes on the calibrator. Figure 1, top right, shows the MERLIN map after self-calibration in DIFMAP. The two components seen in the VLA images were detected.
2.3 VLBA
The two components of B0445+123 were imaged individually at 5 GHz with the VLBA at a resolution of 2 mas on 21 March 2001. Figure 2, bottom left and bottom right, show the VLBA maps of components A and B respectively. The observations show no structure or extension to either component and give a separation of 1340 mas. The 5 GHz flux densities of the components measured with the VLBA are considerably lower than that measured with MERLIN. This could be because either the source has low surface brightness emission which is not detected in the high resolution VLBA observations, or because the source is variable. More observations of B0445+123 are necessary in order to determine which is the case.
3 Optical Observations
The APM (Automated Plate Measuring machine, Irwin et al. 1994) catalogue obtained from Palomar Observatory Sky Survey 1 shows no associated optical components at the position of B0445+123 indicating that any counterpart must have a blue magnitude of 21 (the limiting magnitude detected by the APM).
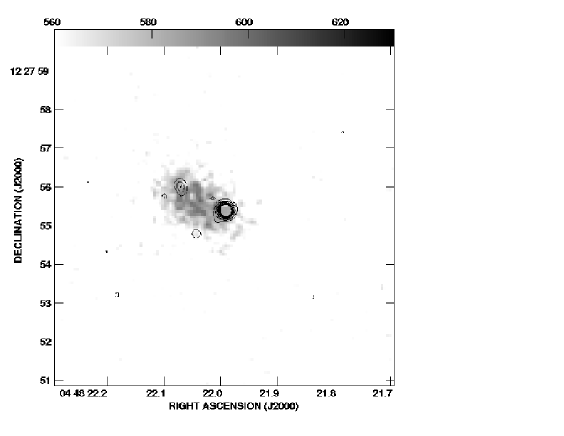
An optical image in R-band was obtained with the WHT (William Herschel Telescope) on La Palma during service observations. The observing conditions were photometric and the seeing was 1.0 arcsec. The observations show a fuzzy blob approximately 17 in diameter at the position of the radio components and extended in the same orientation. Figure 3 shows the WHT image of B0445+123 with contours from the original 8.4 GHz VLA observations overlayed. Astrometric calibration was performed in GAIA111Part of the Starlink Project which is run by CCLRC on behalf of PPARC. using the seven objects in the field also detected on the APM. The random astrometric error is 03 comparable to the 05 offset from the radio reference frame. By comparison with Landolt standard star 93-407 (Landolt 1992) the object was found to have an R-band magnitude of .
An optical spectrum was obtained with the 10-m Keck Telescope and the LRIS spectrograph on 17 November 2001. Strong continuum emission was present, with a redshift of 0.557 resulting from detections of Ca H,K and Mgb lines but there are no obvious emission lines which might indicate a redshift for a lensed object (McKean et al. 2002, in preparation).
4 Discussion: is CLASS B0445+123 a lens system?
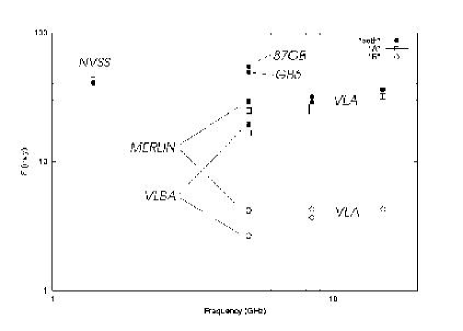
The radio spectra for the components (Figure 4) confirm that both have similar spectral indices as required by the lensing hypothesis. The presence of two or more components separated by 1 arcsec, each compact on milliarcsecond scales and with near identical radio spectra (Figure 4) has so far proven to be a 100% reliable indicator of gravitational lensing within CLASS (Browne et al. 2002). Only one system with two components with milliarcsecond-scale structure is thought to be a binary quasar - CLASS B0827+525 (Koopmans et al. 2000).
The fact that the optical object seen in the WHT image is extended in the same orientation as the radio components and is larger than the separation of the two radio components suggests that some emission from both a lensing galaxy and at least one image is being detected. This is also consistent with the lensing hypothesis. If the object were a binary quasar, optical emission would be expected to be centred on one or other (or both) of the radio point sources.
From the above arguments, we conclude that CLASS B0445+123 is highly likely to be a gravitationally lensed system. On this assumption, we now try to produce a plausible lens model for the structure seen in the 8.4 GHz radio map (Fig. 2).
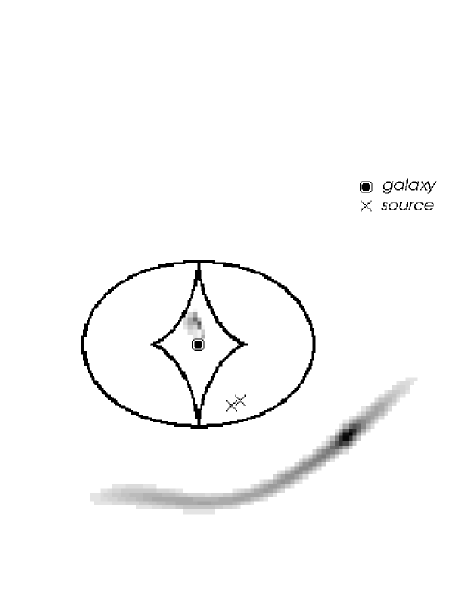
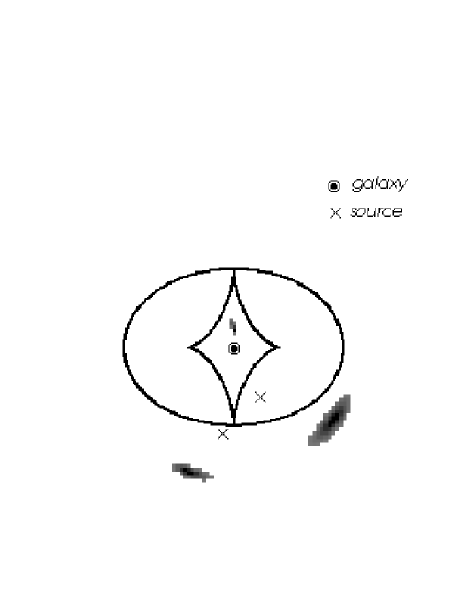
Figure 5 shows two possible simple mass models for B0445+123. Each one shows the positions of the lensing galaxy and the background sources with the caustics and image positions overlaid. In both models the background source has two components, a compact core and jet. They differ in that in the first both core and jet lie within the outer caustic and thus both are doubly imaged, while in the second, only the core is doubly imaged. To first order, both models reproduce the structure seen in the 8.4-GHz follow-up maps (see Figure 2). The fact that the first model can reproduce the slight extension to the north-west of component B suggests that this is the more likely of the two.
 |
 |
Although preliminary lens models of the system can reproduce the radio structure, we emphasize that, because of the dearth of observational constraints, we are only using the modelling to show that the lens hypothesis is plausible. However, with deep MERLIN observations at L-band we would expect to see much more of the extended substructure in the images. This, together with a high resolution optical image to tie down the relative astrometry of the lens and the images, would mean that B0445+123 has the potential to be an interesting system for determination of an accurate lens model and in which to search for the effects of the sub-structure in the lens predicted by CDM galaxy formation scenarios (e.g. Metcalf, 2002).
ACKNOWLEDGMENTS
MERLIN is run by the University of Manchester as a National Facility on behalf of PPARC. The WHT is operated on the island of La Palma by the Isaac Newton Group in the Spanish Observatorio del Roque de los Muchachos of the Instituto de Astrofísica de Canarias The observations made with the WHT were carried out as part of the ING Service Programme. The VLA and the VLBA are operated by the National Radio Astronomy Observatory which is a facility of the National Science Foundation operated under cooperative agreement by Associated Universities, Inc. We thank the W.M. Keck foundation for the generous grant that made the W.M. Keck Observatory possible. MA acknowledges support from the summer student programme at Jodrell Bank Observatory, University of Manchester. JPM, MN, PMP and TY thank PPARC for support in the form of postgraduate studentships.
REFERENCES
Browne I.W.A. et al., 2002, MNRAS, submitted
Condon J.J. et al., 1998, AJ, 115, 1693
Gregory P.C., Condon J.J., 1991, ApJS, 75, 1011
Gregory P.C. et al., 1996, ApJS, 97, 347
Irwin M.J., Maddox S.J., McMahon R.G., 1994, Spectrum (Newsletter of the
Royal Greenwich Observatory), 2, 14
Koopmans L.V.E. et al., 2000, A&A, 361, 815
Landolt A.U., 1992, AJ, 104, 340
McKean J. et al., 2002, in preparation
Metcalf R.B., 2002, astro-ph/0203012
Myers S.T. et al., 2002, MNRAS, submitted
Shepherd M.C., 1997, Astronomical Data Analysis Software and Systems VI, ASP Conference Series, Vol. 125, p 77.