Observations of the neutral gas and dust in the radio galaxy 3C 305
Abstract
We present MERLIN and Hubble Space Telescope (HST) observations of the central region of the nearby radio galaxy 3C 305 and use them to study the gas and dust in this object. The MERLIN observations are of neutral hydrogen (Hi ) absorption against the strong non-thermal 20cm continuum seen towards the central 4 kpc of 3C 305. Our 02 (160 pc) resolution observations show that the Hi absorption is highly localised against the south-western radio-emission with column densities 1.91021 cm-2. The absorption is broad (full width at half maximum, FWHM, of 14526 km s-1) and red-shifted by 130 km s-1 relative to the systemic velocity. The HST images in multiple optical and infrared filters (430 nm, 702 nm, [Oiii] 500.7 nm, [Feii] 1.64m and -band polarization) are presented. Evidence is seen for coincidence of the [Feii] emission with the knot at the end of the radio jet, which is evidence for the presence of shocks.
We compare the optical and radio images in order to investigate the relationship between the dust and neutral gas distributions. An unresolved (007) nucleus is detected in and and its properties are consistent with a quasar reddened by . We propose that the absorption arises in a region of neutral gas and dust. Its structure is complex but is broadly consistent with an inclined disc of gas and dust encircling, but not covering, the active galactic nucleus. A comparison of the neutral gas observations and previous emission-line observations suggests that both the neutral and ionised gas are undergoing galactic rotation towards the observer in the north-east and away from the observer in the south-west. We propose that the outflow giving rise to the radio emission has a component towards the observer in the north-east and away from the observer in the south-west. Unfortunately as we do not detect radio emission from the compact nucleus we cannot set limits to neutral hydrogen absorption from a circumnuclear obscuring torus.
keywords:
– interstellar medium: radio lines:galaxies - galaxies:individual:3C 305 - galaxies:nuclei - galaxies:interstellar medium1 Introduction
The formation and evolution of active galaxies is an interesting and unsolved question. It is not yet obvious why a small fraction of galaxies have a degree of central activity many times larger than that of normal galaxies, or why a still smaller fraction produce radio jets. Nor is it fully understood why active galaxies harbouring the most powerful radio sources appear to be almost exclusively elliptical galaxies. Much work has been done investigating the possibility that active galaxies form as a result of mergers (Toomre & Toomre 1972, Hutchings et al. 1984, Canalizo & Stockton 2001); the evidence for this includes disturbed morphologies, including features suggestive of tidal tails. More recently, Hubble Space Telescope (HST) imaging of a large sample of 3CR galaxies (de Koff et al. 2000) has revealed that a large number of nearby radio-loud active galaxies contain prominent dust lanes, suggestive of the capture of interstellar medium by the accreting galaxy.
The study of the physical properties of the dust and gas in relativistic plasmas at the centres of active galaxies is of great interest. The dust distribution can be studied using optical and infra-red imaging. The atomic gas can be studied using the 21-cm line of neutral hydrogen. As well as giving clues to formation of active galaxies, dust and gas may obscure the direct view to the active galactic nuclei (AGN) and thus affect our ability to view the central optical continuum and broad-emission-line region. Unfortunately, emission lines from atomic hydrogen can only be seen by integrating over large areas — typically tens of arcseconds — because of its low (K) brightness temperature and the current sensitivities of decimeter arrays. However, provided the neutral gas is in front of a strong source of radio continuum, absorption studies can be used to study the atomic hydrogen on subarcsecond scales. Parameters such as the transverse velocity gradients and structure of the neutral gas can then contribute to an understanding of the dynamics of the nuclear regions of active galaxies.
3C 305 is a low-redshift radio galaxy with several unusual properties. The galaxy has some of the characteristics of a spiral galaxy with a thin dust lane crossing the nuclear region and was classified by Sandage (1966) as an Sa(pec). The radio structure is an order of magnitude smaller than is usual for powerful, steep spectrum sources and reveals twin central radio jets feeding two radio lobes, with extended weak emission from perpendicular arms (Lonsdale & Morison 1980, Heckman et al. 1982). The radio source is confined within and perhaps by the galactic disc. Two investigations by Heckman et al. (1982) and Jackson et al. (1995) have revealed a strong association between the radio structure and the optical emission line region. There is strong evidence (Jackson et al. 1995; Martel et al. 1999) that much of the optical view of the source is affected by dust obscuration.
Heckman et al. (1982) suggested that the galaxy may be the result of a merger which triggered nuclear activity. The remnants of the merger debris are interacting with the radio jet to produce the striking radio morphology. There is also evidence for two tidal tails extending from the galaxy (Heckman et al 1986), which may have led to Sandage’s original classification of the galaxy as Sa(pec), and for unusual stellar kinematics. Heckman et al. (1982) found a low stellar velocity dispersion (170km s-1), relatively high stellar rotation velocity (a mean 140km s-1 for 0.2-0.5) about the minor axis (PA 7∘) which was of solid-body form to 5kpc and a flat rotation curve further out. They also found a “rotation” amplitude of over 200km s-1 for the [Oiii] gas and concluded that the stellar velocity is only just over 50% of the gas velocity. Finally, they identified the twisting of the optical isophotes with distance from the nucleus, and the presence of a dust lane, as strong evidence for a merger origin of the galaxy. Peculiar kinematics fit naturally into this picture and would be expected if a companion is gradually being absorbed into the main body of the 3C 305 host galaxy. Furthermore, both ultra-luminous infrared galaxies (ULIRGs, Sanders et al. 1988) and quasars (Heckman et al. 1986) are suspected to be frequent consequences of mergers, with a possible evolutionary sequence (see e.g. Barnes & Hernquist 1992) connecting mergers to ULIRGs and thence to quasar activity on a timescale of a few hundred million years. 3C 305, however, has a 60m flux of 0.2 Jy, about 2% of that of a typical ULIRG at its redshift. Any merger must therefore have taken place some time ago or else have produced relatively little of the obscured star formation which accounts for the far-infrared flux of a typical ULIRG.
More recently, Baum et al. (1988) have also observed the extended optical emission-line gas and Draper et al. (1993) have studied the optical polarization, which is probably dichroic in origin and associated with the same foreground screen that obscures the optical view of the nucleus. Jackson et al. (1995) used HST images of the emission-line gas to quantify the radio-optical association and to constrain models of the interaction of radio jets with the interstellar medium (ISM).
The relatively low redshift (z=0.0417) of 3C 305 makes it an ideal candidate to study the neutral gas at 02-resolution using MERLIN, and to study the dust and emission lines at approximately the same resolution using the HST in the optical and infrared. In this paper we present new images from both instruments. The aims are to investigate whether or not the active nucleus can be detected in the infrared and measure the extinction in front of it; to study the interaction of the radio jet and emission-line gas and the contribution of the former to the excitation of the line emission; and to use the estimates of dust and gas columns we derive to constrain the geometry of the system. Throughout this paper we will assume H0 = 75 km s-1 Mpc-1 which implies a distance of 167 Mpc and hence 1 arcsecond is equivalent to 810 pc in 3C 305.
2 Observations
2.1 MERLIN 21cm observations
The 21-cm radio observations were made in June 1997, using the MERLIN array, including the 76-m Lovell telescope, resulting in a maximum baseline length of 217 km. Two 8-MHz bands, with opposite circular polarizations were observed with 64 correlator channels per polarization, resulting in a channel bandwidth of 125 kHz (26.3 km s-1). The central frequency in channel 32 corresponds to a heliocentric optical velocity of 12 825 km s-1 (z=0.0417).
3C 305 was observed over a period of 14 hours, interspersed with observations of a phase calibrator, 1442+637, and a bandpass calibrator, 0552+398 was observed for 1 hour. The absolute flux density scale was determined from an observation of 3C 286, which was assumed to have a flux density of 15.0 Jy (Baars et al. 1977). Initial editing and calibration was carried out using standard MERLIN programs.
Further editing was undertaken and phase and bandpass calibration were applied within AIPS111Astronomical Image Processing System, distributed by the U.S. National Radio Astronomy Observatory. Individual telescopes were weighted according to their gains and 1442+637 was found to be suitable for both phase and bandpass calibration. The continuum image was formed by compressing channels 3 to 61 followed by 4 passes of self-calibration. The uv data were Fourier transformed using uniform weighting and deconvolved from the beam of the telescope using a CLEAN-based algorithm (Högbom 1974).
A naturally weighted spectral line cube was formed by subtracting 24 absorption free channels (channels 6 to 13, 17 to 28 and 58 to 61) from the uv data. The uv data were then Fourier transformed and deconvolved from the beam. The cleaned continuum was added back to the continuum-subtracted cube and spectra at specific coordinates were obtained.
2.2 HST observations
3C 305 was observed with the HST’s Near-Infrared Camera/Multi-Object Spectrograph (NICMOS) with a variety of filters on 1998 July 16 and July 19. Wide-band images were obtained at 1.6m with the F160W filter (roughly corresponding to Cousins -band), and at 2.2m with the POL0L, POL60L and POL120L filters; polarization information was therefore obtained at the latter wavelength. Narrow-band images were obtained with the F170M filter, which covers the redshifted infra-red [Feii] line at 1.644m, and continuum was subtracted from these images using data taken with the F180M filter.
Other data, all observed after the COSTAR installation which solved the HST spherical aberration problem, were extracted from the HST archive. These data included optical observations from the Wide Field & Planetary Camera 2 (WFPC2), taken with the F702W filter on 1994 September 04, and including both continuum and H/[Nii] emission. A Faint Object Camera (FOC) image at 430 nm from 1997 January 12 was also extracted. Table 1 contains complete details of the observations including exposure times; figure 1 shows the contaminating lines which are present in each continuum filter.

| Instrument | Filter | Date | Exp. | Proposal |
| time /s | number | |||
| FOC | F430W | 1997 Jan 12 | 297 | 6304* |
| WFPC2 | F533N ([Oiii] ) | 1995 Oct 13 | 600 | 5957* |
| WFPC2 | F702W | 1994 Sep 04 | 560 | 6254* |
| NICMOS | F160W | 1998 Jul 16 | 1088 | 7853 |
| NICMOS | F172N ([Feii] ) | 1998 Jul 16 | 3328 | 7853 |
| NICMOS | F180N | 1998 Jul 16 | 3328 | 7853 |
| NICMOS | POL0L 2m | 1998 Jul 16 | 1088 | 7853 |
| NICMOS | POL120L 2m | 1998 Jul 16 | 1088 | 7853 |
| NICMOS | POL240L 2m | 1998 Jul 16 | 1088 | 7853 |
The reduction of optical data followed standard STScI pipeline procedures including application of flatfields and distortion correction. The reduction of the polarization images to Stokes Q and U images was performed using polarimetry routines described by Sparks & Axon (1999). Photometry was achieved using the photflam keywords in the file headers of the HST images.
NICMOS images are affected by a “pedestal” or unpredictable bias, which may be different in the four quadrants of the image. We used the unpedestal program of R. van der Marel to minimise this effect (Bushouse, Dickinson & van der Marel 2000). Before running unpedestal we temporarily masked out the bright galaxy cores, which could affect the results, and fitted a single bias for each field or a separate bias for each quadrant, depending on which showed the least evidence for jumps in the background at the quadrant boundaries. Accurate offsets between individual images, needed for making the final mosaic, were obtained by fitting the galaxy peak; and the nominal background was set to the mean of two standard regions well away from the galaxy centre. Although galaxy light is present and hence will be subtracted when the mosaic is constructed, the oversubtraction should be identical in each image. These parameters were fed to the Space Telescope Science Institute program calnicb to make the final mosaic; the background was re-determined and corrected using regions at the edge of the mosaic. A small background gradient remains after these corrections, but does not affect the results.
2.3 Astrometry
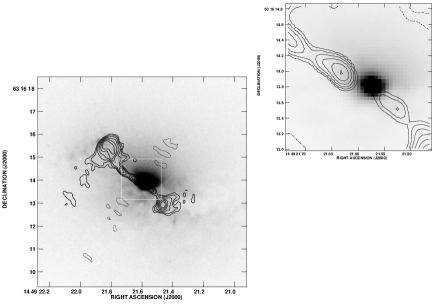
An archival HST WFPC2 F702W filter continuum image of 3C 305 is shown in Fig. 2. The HST astrometry was tied to the International Coordinate Reference Frame (ICRF) as follows. R. Argyle and L. Morrison determined the position of four stars in the WFPC2 field by re-measuring a 1981 Herstmonceux astrographic plate (Argyle & Clements 1990), using the Royal Greenwich Observatory PDS machine; these positions are listed in Table 2. Fourteen stars on the plate were observed by them in 1997 with the Carlsberg Automatic Meridian Circle (CAMC); these measurements are directly tied to HIPPARCOS positions, and hence allowed them to put the WFPC2 stars onto the ICRF.
The standard header on the WFPC2 image was updated with the latest calibration using the Space Telescope Data Analysis System task uchcoord, and the four star positions were measured with the task metric, which accounts for the geometric distortion of the image. A non-linear least-squares fit was made to find the transformation required to align the two coordinate systems; we found that the reduced was not significantly lowered by allowing for a rotation and change of scale (best fit values for these differed by 01 and 0.05% from nominal), so we simply applied the best-fit shift (04).
The rms residual between astrographic and corrected WFPC2 positions was 012 in each coordinate, somewhat larger than the expected uncertainties (the scatter may be dominated by proper motion of the reference stars between 1981 and 1994). The final registration should therefore be accurate to about 01 and is shown as an overlay in Fig. 2.
| Star | RA (J2000) | Dec (J2000) |
|---|---|---|
| 1 | 14 49 16.9280.005 | +63 17 06.310.06 |
| 2 | 14 49 14.9850.006 | +63 15 54.340.05 |
| 3 | 14 49 17.8970.007 | +63 15 29.730.07 |
| 4 | 14 49 28.8730.017 | +63 15 39.430.07 |
Once an optical image had been aligned to the radio frame, the remaining optical images were then aligned with each other using a star which appeared about 12′′ WNW of the optical centre and which appears in all the optical HST frames. The infra-red frames contained no suitable reference star. The IR images were aligned with each other using the peak brightness. The IR-optical alignment was performed by aligning the peak of the [Feii] emission to the northeast of the core with the optical emission line peak. This also aligned the -band local maximum, corresponding to Pa emission in the northeast lobe, with the H emission contaminating the optical 702-nm image. The resultant infra-red nuclear position is close to the optical position (formally 63 mas E and 26 mas S of the optical component, although this is close to the error [about 1 pixel, or 45 mas] within which the images could be lined up). The 430-nm image also did not contain the reference star, and so was lined up with the emission-line maximum in the northeast lobe. All images have been rebinned to the Planetary Camera pixel scale of 00455 for further analysis.
3 Results
3.1 MERLIN observations of the 20-cm continuum emission
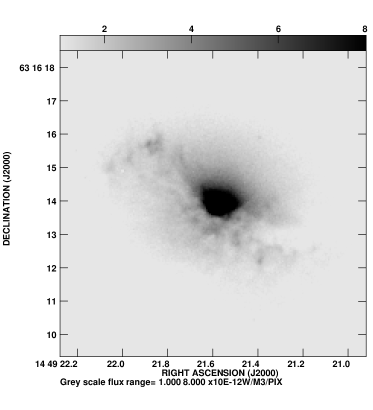
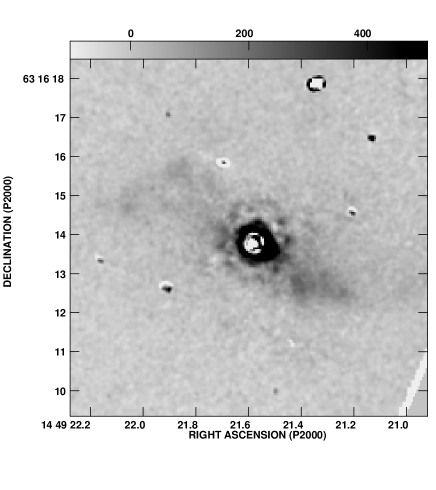
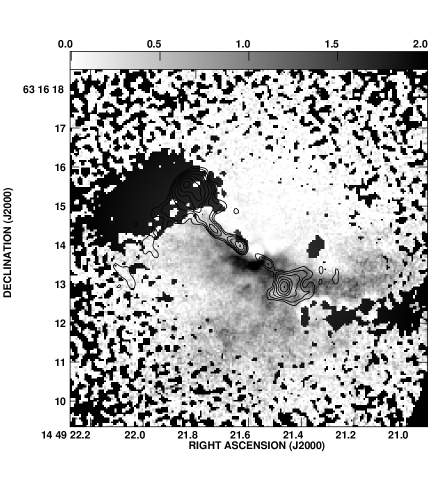
The 1.4-GHz continuum image of 3C 305, derived from the line-free channels, is shown in Fig. 3. The image has been derived from uniformly weighted data and has an angular resolution of 019014 and a noise level of 0.10 mJy beam-1. Note that the extended emission, especially from the northeast and southwest arms, is affected by a lack of MERLIN short-baseline spacings.The image reveals the structure of the radio continuum emission with two jets forming radio lobes separated by 36 in PA 54∘. Two low brightness arms extend perpendicular to the orientation of the jets. In Table 3 we give a summary of the 1.4-GHz flux densities of the continuum components.
The alignment of the radio and optical images (Fig. 2) is at first sight rather surprising, as it places the radio peak about 045 away from the optical peak, nearly four times the astrometric error, in PA from the brightest optical/infra-red point. However, the central radio component does not have a flat spectrum and is therefore unlikely to be the radio core; it is likely that we are seeing a knot at the base of the jet, with a peak flux density of 13 mJy beam-1. The radio core is undetected and must therefore have a flux of 1 mJy. On the other hand, the astrometry places the northern termination of the radio jet almost directly on top of a region of strong [Oiii] emission, which is a physically plausible result. Without the CAMC data, Jackson et al. (1995) aligned the radio and optical maxima directly, resulting in the head of the radio jet falling about 05 short of the optical emission line regions.
| Component | S1.4GHz | Area | Peak | R.A. (J2000) | Dec. (J2000) |
|---|---|---|---|---|---|
| (mJy) | (arcsec2) | (mJy beam-1) | 14h49m | 63∘16′ | |
| NE Arm | 99.7 | 3.197 | 6.4 | 21s.860 | 14′′.93 |
| NE Lobe | 601.9 | 1.338 | 114.0 | 21s.832 | 15′′.56 |
| NE Jet B | 38.4 | 0.295 | 13.0 | 21s.753 | 14′′.61 |
| NE Jet A | 52.7 | 0.306 | 36.4 | 21s.634 | 13′′.97 |
| SW Jet | 9.4 | 0.288 | 4.4 | 21s.528 | 13′′.52 |
| SW Lobe | 188.0 | 0.860 | 80.2 | 21s.462 | 12′′.93 |
| SW Arm | 31.7 | 1.369 | 4.1 | 21s.396 | 12′′.79 |
3.2 MERLIN observations of the neutral hydrogen absorption
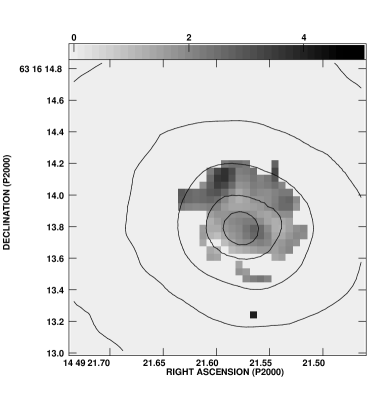
The 51251263 spectral line cube was derived using natural weighting and has a resolution of 0.27 0.18 arcsec2 and an RMS noise, , of 0.51 mJy beam-1 over absorption-free channels of the cube. As shown in Figures 3 and 4, neutral hydrogen absorption is only detected towards the south-western (SW) radio emission. From Gaussian fitting to the absorption spectra we measured the centroid velocity (optical heliocentric convention) and half power width (FWHM) of the absorbing gas. The opacity and column densities were obtained directly from the spectra (we assumed a spin temperature of 100K in calculating the column density).
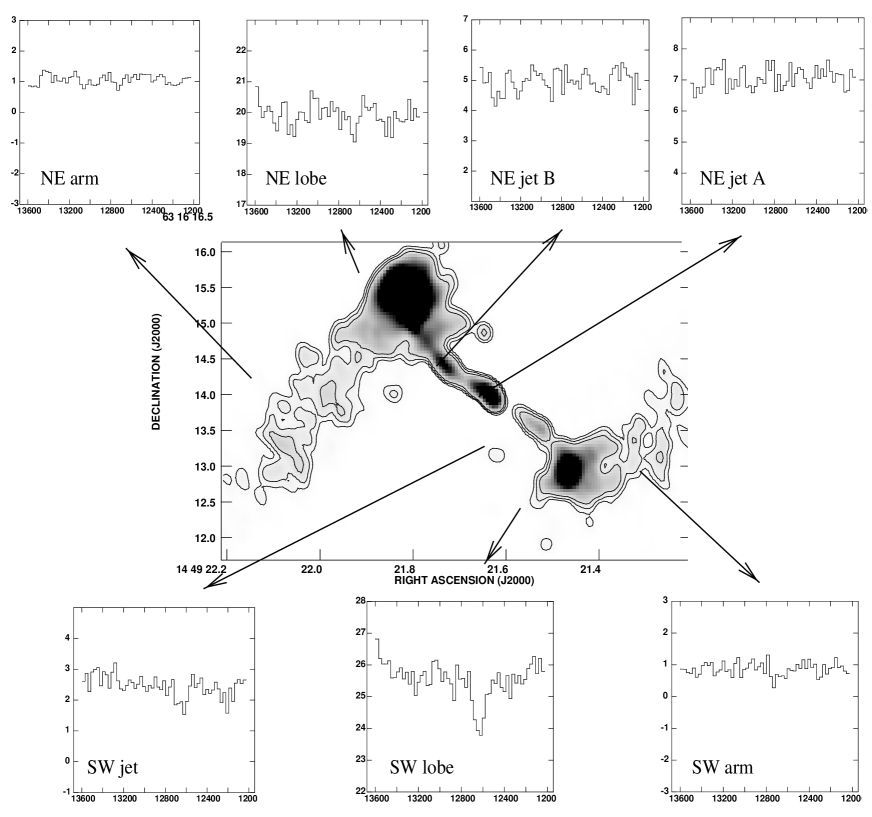
The non-detection of absorption towards the northeastern jet components A and B puts constraints on the column densities of Hi in front of these features. Limits for the opacity and column densities were calculated from the RMS noise in the spectra and an expected line width of 150 km s-1. Spectra in the direction of the bright northeast lobe are limited in dynamic range at the 1% level due to baseline uncertainties. The absorption results are summarised in Table 4.
| Component | Vc | V | NH 1021 | |
|---|---|---|---|---|
| (km s | (km s-1) | (km s | ( atom cm-2) | |
| Ne Arm | 12.3 | 2.2 | ||
| NE Lobe | 0.7 | 0.1 | ||
| NE Jet B | 6.0 | 1.1 | ||
| NE Jet A | 2.1 | 0.4 | ||
| SW Jet | 1266026 | 13026 | 7024 | 12.84.4 |
| SW Lobe | 1264026 | 14526 | 114 | 1.90.7 |
| SW Arm | 19.9 | 3.6 |
3.3 HST observations
 |
 |
 |
 |
 |
 |
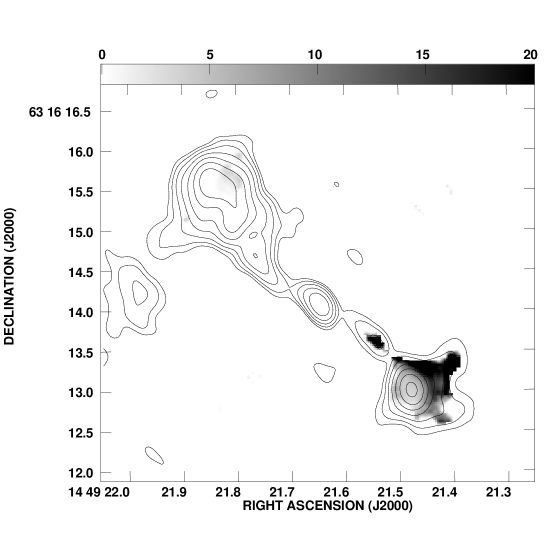
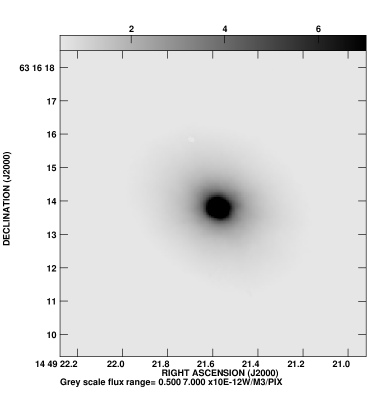
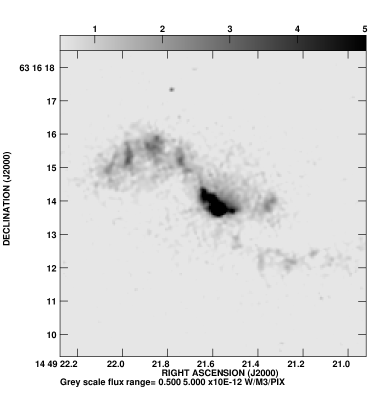
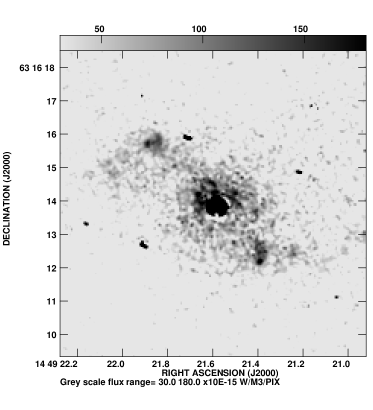
In Fig. 5 we show all the optical images of 3C 305 as greyscale plots. Immediately obvious from these images is the contrast between the extreme smoothness of the infra-red images, dominated by the old galaxy component, and the irregular structures seen in the blue continuum and line images. Emission in the images of the [Feii] and [Oiii] lines extends along the radio axis. At the end of the northeastern radio jet, emission in both lines is seen. In the case of [Oiii] the emission extends some distance beyond the head of the jet in a southeasterly direction. The [Oiii] emission is fainter on the counterjet (southwest) side, but turns northward after the end of the radio jet; the overall effect is of a ’Z’shape in the [Oiii] emission. The [Feii] emission is relatively much brighter at the ends of the jet, and fainter in the regions away from the main jet axis.
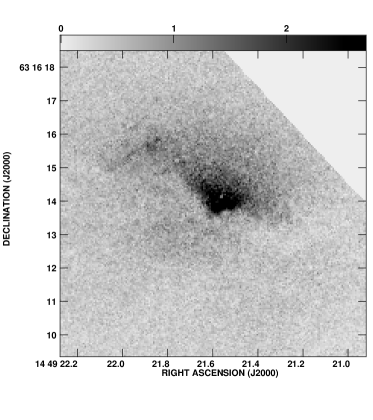
Faint extended emission is detectable in the -band images which were originally used to collect polarization information. We interpret this as Pa at rest wavelength 1.879m, as it is not seen in the continuum -band image. A smoothed version of the -band image has been subtracted to reveal the underlying line emission (Fig. 6).
The dust lane on the southern side (Heckman et al. 1982, Jackson et al. 1995) is clearly visible in the colour images, and is particularly prominent and sharp-edged in the 430-nm image. Patchy dust obscuration is obviously present throughout the central and southern regions of the nuclear source.
The polarization images (bottom right of Fig. 5, and Fig. 7) show very similar structure to that seen by Draper et al. (1993). The peak polarization is about 2% and is concentrated to the north of the optical core, on the side unaffected by the dust lane.
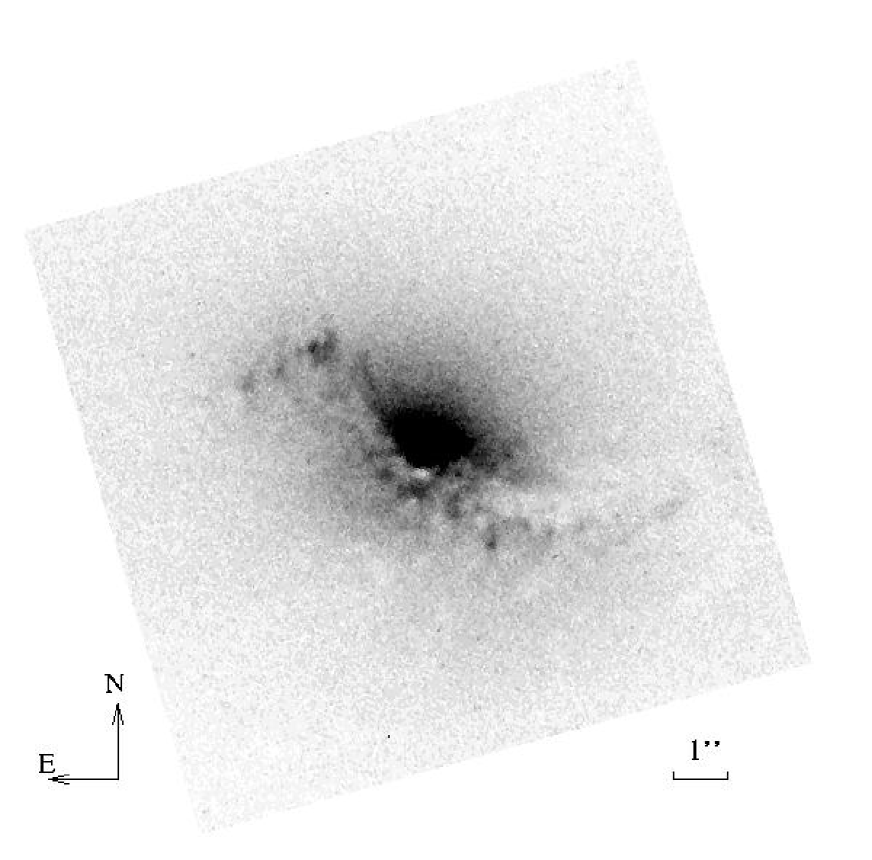
Unsharp masking was applied to the F702W image by subtraction of a 0.5 arcsec Gaussian smoothed image at 50% intensity. This process removes low spatial frequency variations in the image and enables more detail to be seen. The unsharp masked image is shown in Fig. 8 and reveals a complex nuclear dust lane.
4 Discussion
4.1 Detection of an unresolved nucleus
In the optical part of the spectrum, the central galaxy profile appears smooth. Chiaberge, Capetti & Celotti (1999) attempted to detect a compact optical core in the 702-nm HST image, by fitting a smooth profile to regions 023 from the centre, extrapolating the fit to the central regions and testing for any remaining central component of width 008. They found none, as did Hardcastle & Worrall (2000) using the same image. We have extracted the 702-nm image from the HST archive and subtracted TinyTim point-spread functions (Krist 1995) from it until an unphysical “hole” is clearly detected in the intensity distribution. This results in a limit of W m-2nm-1 () for the optical -band magnitude of any central unresolved object.
Chiaberge et al., however, did find optical point sources in a number of other low power, Fanaroff & Riley type 1 (FR I, Fanaroff & Riley 1974) radio galaxies. In other low-power radio galaxies such as Centaurus A (Schreier et al. 1998) as well as higher-power FR II galaxies such as Cygnus A (Tadhunter et al. 2000) nuclear infra-red point sources have now been detected at HST resolution.
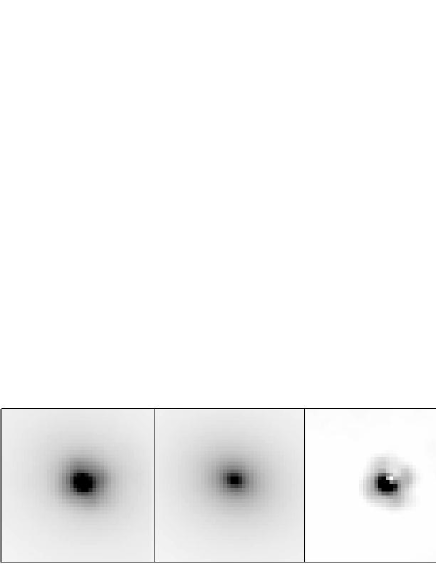
In both the and -band NICMOS images we see evidence for an unresolved nuclear source on scales of 50 pc. Both images have been fitted by a cusped central galaxy profile, a dependence of brightness with radius which has been successfully applied by Faber et al. (1997) to HST images of a wide range of early-type galaxies,
where and are constants. We have ignored the central 05 of the images when performing this fit. A downhill simplex fit has been used for simultaneous fitting of all parameters (e.g. Press et al. 1992) and the results are given in Table 5. A central condensation, in addition to the galaxy fit, is then seen in both images which has the characteristic form of the NICMOS point spread function (Fig. 9). We have normalised the photometry to the large-aperture results of Impey (1983) who measured the -band and -band flux densities through large (82 and 123) apertures. This central image has a -magnitude of about 16.31.0 and an magnitude of 14.70.3. Extrapolating from the -band result using a typical quasar colour of gives . This is typical of luminosities required to photoionize extended nebulosities in nearby objects, although we argue in section 4.5 that jet-driven shocks may also play a major role in exciting the gas.
| Parameter | -band | -band |
|---|---|---|
| Ellipticity | 0.85 | 0.81 |
| Position angle of major axis | 67 | 66 |
| Break radius, (mas) | 470 | 190 |
| 0.44 | 1.96 | |
| 1.68 | 1.23 | |
| 0.53 | 0.30 |
The natural inference from these observations is that we are indeed detecting the central AGN in 3C 305 in the infrared. A similar conclusion has been reached in ground-based images of a sample of 3CR radio galaxies by Simpson, Ward & Wall (2000) who detected excess flux in 5 out of 10 sets of infrared images. Simpson et al.’s observations were ground-based, and their analysis relied on separation of the central nuclear light by fitting a de Vaucouleurs profile together with an unresolved component. Here we are able to resolve down to 007 and determine the parameters of the nucleus directly.
The infrared colour of the nucleus of 3C 305 is roughly comparable to the typical found by Simpson et al. However, with the -band limit we can derive an estimate for the reddening. We assume that the hidden nucleus is a quasar, and furthermore assume a typical optical-IR spectral energy distribution represented by a power-law, . Using the - and -band results, we find for =0.5 that the central reddening magnitudes. This is a relatively modest limit beside those derived from infrared emission-line (Ward et al. 1991) and X-ray (Ueno et al. 1994) observations of objects such as Cygnus A. However, the -band continuum flux may be coming from a relatively large area and be subject to less obscuration than the central part of the nuclear region. Further deep observations in the red optical and near-IR would establish the point-source spectral energy distribution and hence the obscuration to the nuclear component more definitively.
The astrometry we carried out (section 2.3) shows that the brightest part of the radio image is not coincident with the optical/infrared nucleus discussed above. Hence this radio component is most likely a knot in the jet, certainly not a radio nucleus, and hence we shall refer to this as NE jet A. The optical nucleus (Figure 2), appears to be situated in the gap between this component and the SE jet and hence has a radio flux density less than 1 mJy. This could be a consequence of either synchrotron self absorption, or free-free absorption by nuclear ionised gas with an emission measure of pc cm-6. It could also be a consequence of relativistic beaming; if the radio plasma is outflowing with a Lorentz of about 5, then Doppler deboosting of intrinsic flux takes place if the outflow is further than about 60∘ to the line of sight. Such an angle would still maintain the observed factor of a few in relative boosting of the flux of the northeastern jet relative to the southwestern jet, if the NE jet was the approaching radio jet.
Clearly Hi absorption cannot be measured in the direction of the nucleus, and hence no limits can be set to atomic hydrogen column densities associated with a dusty torus on scales of 1–10 pc.
4.2 The structure of the neutral gas and dust
We can use the HST observations to determine the amount of dust reddening present and the MERLIN Hi absorption observations to determine the neutral gas column in front of the radio source. If these are compatible, assuming standard dust-to-gas ratios, it means that the dust as well as the gas must lie in front of the radio source; hence we can make deductions about the overall geometry of the radio source. We consider both components in turn.
4.2.1 Dust
A distinct dust lane extends over the central region of 3C 305, offset 04 to the SE of the nucleus (see Fig. 8). The dust lane splits into two distinct structures, about 06 wide, extending 15 to the northeast of the nucleus. The dust lane is most prominent to the southwest of the nucleus and extends 45 to the southwest of the nucleus before bending sharply.
The apparent cone-like shape of the optical nucleus perpendicular to the radio axis is explained by the obscuration of the emission in the southwest of the source by the dust lane. Dust obscuration is probably also responsible for the apparent highly localised (0.25 arcsec2) regions of emission to the S and SW of the nucleus. Over the central 2 arcsec, the structure appears to be consistent with an inclined disc of dust encircling the active galactic nucleus at an inclination of 45∘.
In order to quantify the amount of dust present, we have generated a map of extinction using the 1.6-m image together with the 702-nm image. When these images are divided, the northern segment shows smooth undisturbed contours, and these have been assumed to represent the unobscured emission of the galaxy. This has been fitted with an elliptically symmetric function, divided out, and the extinction map in magnitudes has been formed by taking the logarithm and multiplying by 2.5. Assuming that the extinction E(BV), a reddening map of can be derived if we assume Galactic properties for the dust; the result is shown in Fig. 10. The typical is about 1.5 magnitudes across much of the source, implying a gas column of about 3.4cm-2 assuming Galactic gas-to-dust ratios. In particular, this is the predicted gas column against the SW radio lobe.
It should be noted, however, that the derived E(BV) for the dust is a lower limit. If the dust column were not all situated in front of the majority of the galaxy emission, much larger values of E(BV), and hence larger gas columns, would be needed. The comparison of the dust prediction with direct HI measurements can therefore be used directly to constrain the geometry in this case.
4.2.2 Gas
We have detected neutral hydrogen absorption against the southwestern jet and lobe which confirms the presence of neutral gas in front of these radio structures (see Fig. 3). The absorption is localised to the southwest side only, which we attribute to gas associated with a peculiar shaped dust lane (see Fig. 10). The fact that absorption is seen against the southwestern jet agrees with the plausible assumption that the northeastern radio jet has a component of its velocity towards us and appears brighter than the SW jet due to Doppler boosting.
The average column density of the neutral hydrogen against the southwestern lobe is high, NH = (1.9 0.7)1021 cm-2 and is similar to column densities found against the central regions of the radio galaxy 3C 293( 1.7 1021 cm-2 - Beswick et al 2002). This agrees within a factor of 2 with the column density derived above (section 4.2.1) using optical reddening. Given the assumptions of both methods, such as a spin temperature of 100K in the radio method and a galactic dust to gas ratio in the optical method, there is reasonable agreement in the column density estimates. This is consistent with the atomic hydrogen being associated with optical dust lane and that the dust lane is in front of the southwestern radio lobe. The dust lane extends over an area of 3.2 arcsec2 out to 4.5 arcsec southwest of the nucleus. Assuming an average column density over this region of 1.9 1021 cm-2, the total mass of neutral hydrogen in the dust lane is 3 107 M⊙.
Our results help to explain the observations of Draper et al. (1993) and Jackson et al. (1995). Draper et al. investigated the polarization structure of 3C 305 and concluded that the lack of coincidence between the polarised regions and the emission line regions or radio jet axis was due to obscuration within the host galaxy. Jackson et al. found the southern side of the nucleus was slightly redder in colour which they also interpreted as a consequence of obscuration.
4.3 Kinematics of the Neutral Gas and Dust
The centroid velocity of the absorption line (1264026 km s-1) is red-shifted by 130 km s-1 relative to the systemic velocity of (1251060) km s-1 (Heckman et al. 1982). Optical spectroscopy by Heckman et al. (1982) obtained velocities for the [Oiii] emission along PA 57∘ with a velocity resolution of 130 km s-1.
There is a clear agreement between the emission-line velocity and the neutral hydrogen velocity implying that the kinematics of the two structures are linked. The neutral hydrogen absorption is localised on scales of 2 arcsec as can be seen in Fig. 3. The velocities of the absorbing gas are shown in Fig 4. The velocity of the absorbing components varies over the region by 75 km s-1 arcsec-1. From Fig. 10 of Heckman et al. (1982), the velocity gradient of the emission line gas along PA 57∘ over the central 6.5 arcsec is 80 km s-1 arcsec-1.
The kinematics of the neutral and ionised gas are inconsistent with the stellar dynamics which represent only 55% of the rotation velocity of the ionised gas as found by Heckman et al. (1985). This is consistent with Heckman’s original (1982) suggestion that the neutral gas is disturbed by the radio jets.
4.4 Geometry of 3C 305
From our neutral hydrogen absorption observations we can infer that the SW radio structure lies behind the nuclear dust lane. However no absorption is detected against the stronger northeast lobe despite the presence of dust lanes. We interpet this as evidence that the northeast lobe is in front of the neutral gas. Thus we suggest that the radio emission is towards the observer in the northeast and away from the observer in the southwest.
The kinematics of the neutral gas and dust appear to be closely linked with the dynamics of the ionised gas (Heckman et al. 1982). Considering the apparent disc-like structure of the dust lane in the central few arcsec, we suggest that both the neutral and ionised gas are undergoing circular motion around the centre of the galaxy.
4.5 Emission lines and interactions of the radio jet
The mechanism by which emission lines in active galaxies are excited is complex and not well understood. A possible source of ionization is the emission of hard-UV and X-ray photons from the central AGN. Such a nucleus may well be present in 3C 305 although as we have argued above the obscuration may prevent us from seeing the nucleus directly.
The other possibility is that shocks induced by the radio jet’s passage through the intergalactic medium photoionize the gas (Sutherland, Bicknell & Dopita 1993). The primary physical mechanism in this case is still photoionization, but in this case carried out by the high-energy photons produced in the shock. Because of the relative similarity of the two processes, it is not easy to distinguish which is actually responsible for the observed line emission. One diagnostic may be the infra-red [Feii] line, which is known to be produced abundantly in fast shocks associated, for example, with supernova remnants (Moorwood & Oliva 1988). Forbes & Ward (1993) suggested that shocks may also be responsible for [Feii] emission, the strength of which is correlated with radio core flux densities in Seyfert galaxies.
Simpson et al. (1996) have investigated the production of [Feii] in detail and present diagnostic diagrams involving the ratios of [Feii] /Pa and [Oi] /H. They find more scatter between [Feii] and radio fluxes than Forbes & Ward and suggest in particular that normal AGN photoionization can account for the observed ratios of [Feii] /Pa in their sample.
In 3C 305 we have an opportunity to study this in detail. The reason is that in this object there is a close association of the northeastern termination of a radio jet with a strong region of line emission. Such a structure would be expected to produce line ratios corresponding to shock excitation.
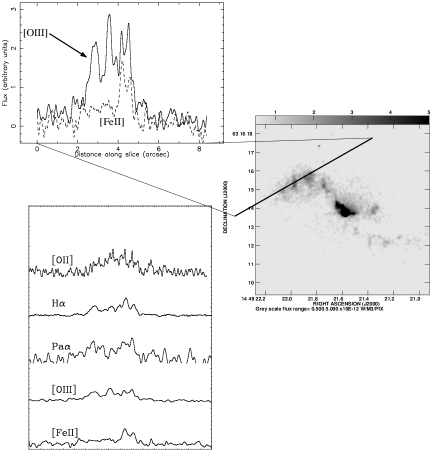
In Fig. 11 we show a slice through the northeast section of the emission line region. It is apparent that the profiles of [Feii] and [Oiii] are different; there is a clear peak of [Feii] around the point where the jet terminates, and [Oiii] is more evenly distributed throughout the emission line region. This strongly suggests that we are here seeing an increase in [Feii] flux due to shock ionization around an interaction region.
The H/[Feii] flux ratio in this region is about 17. Assuming case B values for the hydrogen line emission, and converting from our [Feii] m fluxes to the 1.257-m line used by Simpson et al., we obtain a ratio [Feii] 1.257μm/Pa of just over 1. Adopting Heckman et al.’s (1982) value of 0.13 for the radio [Oi] /H puts the strong emission-line region in 3C 305 approximately in the region of Simpson et al.’s diagnostic diagram where standard Seyfert emission lines lie. This implies in turn that standard Seyferts may have some contribution to their line emission from jet-induced shocks, although this argument does not of course prove that this is the case.
5 Conclusion
The major results of this paper are the discovery of a pointlike infrared nucleus; the identification of the nuclear position which is not coincident with the bright central radio component; neutral hydrogen gas rotation velocities of 130kms-1 relative to systemic velocity, aligned with, and sharing a common velocity gradient with, the emission line gas; the comparison of dust and gas columns which shows that most of the dust associated with the emission line gas is in front of the southwestern part of the radio source (and hence that the southwestern radio jet is almost certainly the receding jet); and the discovery of peaks of [Feii] 1.64m emission coincident with radio hotspots, consistent with the presence of jet-induced shocks.
There is no evidence from the new infrared picture that 3C 305 contains a double nucleus as in the case of the merging system Mkn 463 (Hutchings & Neff 1989), and the infrared isophotes are quite smooth indicating a relatively undisturbed old stellar population, such as might be expected yr from the start of a merger process. The point infrared nucleus is consistent with a central QSO which may have formed during the course of the merger.
6 Acknowledgements
We thank Simon Garrington and Tom Muxlow for assistance with the observations and Ian Browne for useful comments. We are very grateful to R. Argyle and L. Morrison for their work in fixing the astrometry of the 3C 305 field.
This research was based on observations with the Hubble Space Telescope, obtained at the Space Telescope Science Institute, which is operated by Associated Universities for Research in Astronomy, Inc., under NASA contract NAS5-26555; and with MERLIN, which is operated as a National Facility by the University of Manchester on behalf of the UK Particle Physics & Astronomy Research Council.
References
- [] Argyle R. W., & Clements E. D., 1990. Observatory, 110, 93.
- [] Baars J.W.M., Genzel R., Pauliny-Toth I.I.K., Witzel A., 1977, A&A 61, 99
- [] Barnes J.E., Hernquist L., 1992, ARA&A, 30, 705
- [] Baum S.A., Heckman T.M., Bridle A., van Breugel W.J.M., Miley G.K., 1988, ApJS, 68, 643
- [] Beswick R., Pedlar A., Holloway A., 2002, MNRAS, 329, 620
- [] Bushouse H., Dickinson M., van der Marel P., 2000, in Astronomical Data Analysis Software and Systems IX, ASP Conf. Proc. 216, eds N. Manset et al., Astronomical Society of the Pacific, p. 531
- [] Canalizo G., Stockton A., 2001, ApJ, 555, 719
- [] Chiaberge M., Capetti A., Celotti, A., 1999, A&A, 349, 77
- [] Draper P.W., Scarrott S.M., Tadhunter C.N., 1993, MNRAS, 262, 1029
- [] Faber S.M., et al., 1997, AJ, 114, 1771
- [] Fanaroff B.L., Riley J.M., 1974, MNRAS, 167, 31P
- [] Forbes D.A., Ward M.J., 1993, ApJ, 416, 150
- [] Hardcastle, M.J., Worrall, D.M., 2000, MNRAS, 314, 359
- [1] Heckman T.M., Miley G.K., Balick B., van Breugel W.J.M., Butcher H.R., 1982, ApJ, 262, 529
- [] Haschick A.D., & Baan W.B., 1985, ApJ, 289, 574
- [] Heckman T.M., Miley G.K., Balick B., van Breugel W.J.M., Butcher H.R., 1982, ApJ, 262, 529
- [] Heckman T.M., Illingworth G.D., Miley G.K., van Breugel W.J.M., 1985, ApJ, 299, 41
- [] Heckman T.M., Smith E.P., Baum S.A., van Breugel W.J.M., Miley G.K., Illingworth G.D., Bothun G.D., Balick B., 1986, ApJ, 311, 526
- [] Högbom J.A., 1974 A&AS, 15, 47
- [] Hutchings J.B., Crampton D., Campbell B., Duncan D., Glendenning B. 1984, ApJS, 55, 319
- [] Hutchings, J.B., Neff, S.A., 1989, AJ, 97, 1306
- [] Impey C, 1983, MNRAS, 202, 397
- [] Jackson N., Sparks W.B., Miley G.K., Macchetto F., 1995, A&A, 296, 339
- [] Krist, J., 1995. Astronomical Data Analysis Software and Systems IV, ASP Conference Series, Vol. 77, eds. R.A. Shaw, H.E. Payne, and J.J.E. Hayes, 349.
- [] de Koff S., et al., 2000, ApJS, 129, 33
- [] Lonsdale C.J., & Morison I., 1980, Nature, 288, 66
- [] Martel A.R., et al., 1999, ApJS, 122, 81
- [] Moorwood A., Oliva E., 1988, A&A, 203, 278
- [] Press W.H., Flannery B.P., Teukolsky S.A., Vetterling W.T., 1986, Numerical Recipes: the art of scientific computing. Cambridge University Press.
- [] Sanders D.B., Soifer B.T., Elias J.H., Madore B.F., Matthews K., Neugebauer G., Scoville, N., 1988, ApJ, 325, 74
- [] Sandage A 1966, ApJ, 145, 1
- [] Schreier E., et al., 1998, ApJ, 499, L143
- [] Simpson C., Forbes D.A., Baker A.C., Ward M.J., 1996, MNRAS, 283, 777
- [] Simpson C., Ward M., Wall J.V., 2000, MNRAS, 319, 963
- [] Sparks, W.B., Axon, D.J., 1999, PASP, 111, 1298
- [] Sutherland R.S., Bicknell G.V., Dopita M.A., 1993, ApJ, 414, 510
- [] Tadhunter C.N., et al., 1999, ApJ, 512, L91
- [] Toomre A., Toomre J., 1972, ApJ, 178, 623
- [] Ueno S., Koyama K., Minoru N., Shigeo Y., Ward M.J., 1994, ApJ, 431, L1
- [] Ward M.J., Blanco P.R., Wilson A.S., Nishida M., 1991, ApJ, 382, 115