A radio catalog of Galactic HII regions for applications from decimeter to millimeter wavelengths
By collecting the information from
24 previously published lists and catalogs,
we produce a comprehensive catalog (Master Catalog)
of 1442 Galactic HII regions.
For each object, we quote the original fluxes and diameters
as well as the available information on
radio line velocities, line widths and line temperatures
and the errors on these quantitities.
References to the original works are also reported.
By exploiting all these data we produce
a Synthetic Catalog of fluxes and diameters
(with corresponding errors)
at 2.7 GHz. This choice is motivated by the
extensive, although not complete, information available
at this frequency,
widely spread among many different catalogs,
and by its relevance for both detailed studies
on Galactic HII regions and
the extrapolation up to millimetric wavelengths.
The catalog can be used for detailed studies of Galactic
HII regions and, by extrapolation, for investigations of HII regions
up to millimetric wavelengths. In particular,
we discuss the
study of the effects of microwave emission from HII regions on the new
generation of Cosmic Microwave Background (CMB) experiments.
We present
simulations of the detection of HII regions in the Planck high
resolution CMB survey, and briefly analize some of the typical
applications of our catalog to the evaluation of CMB
anisotropy experiments such as calibration, beam reconstruction and
straylight effects.
The Master Catalog and the Synthetic Catalog
are available via ftp at: cdsarc.u-strasbg.fr.
This work is related to Planck-LFI activities.
Key Words.:
HII Regions – Catalogs – cosmic microwave background1 Introduction
HII regions are very important radio
sources within our Galaxy. They
not only provide information about the early stages of stellar formation
but represent also a unique tool to investigate
the Galactic spiral structure. Moreover, their radio emission,
not attenuated by dust extinction, is
powerful enough to enable us to probe distant parts
of the Galactic plane.
Despite their astrophysical relevance, there is no currently available
comprehensive catalog of these objects.
A few optical catalogs
(Sharpless 1959; Marsálková 1974; Fich Blitz 1982)
do exist but they are severely limited by the
dust obscuration effects mentioned above.
At radio wavelengths,
the most comprehensive catalog of diffuse brightness nebulae
is the -HII Catalog at 2.7 GHz (Witebsky 1978a, 1978b).
It includes
909 objects and has provided a reliable tool for estimating the
contribution
of HII regions to Galactic free-free in the analysis of the
data.
More recently, a list of 760
objects with angular diameter less than
has been compiled by Kuchar Clark 1997 from the Green Bank (Condon et al. 1989)
and Parkes-MIT-NRAO (Condon et al. 1993; Tasker et al. 1994) radio surveys at 4.85 GHz.
These catalogs can now be combined and updated
with other recently published data.
A strong motivation supporting this work is
its relevance to
cosmic microwave background (CMB) studies.
Since the successful results of the satellite (Smoot et al. 1992),
increasing efforts have been devoted to investigating
the cosmological information contained in
the CMB anisotropies.
Recent balloon experiments such as
BOOMERANG (de Bernardis et al. 2000) and MAXIMA-1
(Hanany et al. 2000) as well as ground interferometer
experiments as DASI (Leitch et al. 2002), CBI (Mason et al. 2001)
and VSA (Scott et al. 2002)
have achieved remarkable results but, at
the same time, have shown the necessity to improve our knowledge
of all the relevant astrophysical foregrounds
which may affect the recovery of the CMB angular power spectrum
and, ultimately, of the cosmological parameters.
In particular, the free-free emission is the least known among
the Galactic foregrounds.
However, much of the
free-free emission at low Galactic latitudes is produced by individual
bright HII regions.
Because of their strong emission, they may represent
a potential source of contamination
for the new generation of nearly full-sky coverage CMB anisotropy
space missions at high sensitivity and resolution.
These sources are also good candidates for receiver and antenna
pattern calibration.
By collecting the information from
24 previously published lists and catalogs,
we present in this paper a comprehensive catalog (Master Catalog)
of 1442 Galactic HII regions.
For each object, we quote the original fluxes and diameters
as well as the available information on
radio recombination line velocities, line widths and line
temperatures
and the errors on all these quantitities.
By exploiting these data we produce
a Synthetic Catalog of fluxes and diameters
(with corresponding errors)
at 2.7 GHz, motivated by the
extensive although not complete information available
at this frequency,
widely spread among the different catalogs,
and by its relevance for both detailed studies
on Galactic HII regions and
the extrapolation up to millimetric wavelengths.
We discuss also some possible applications
of this Synthetic Catalog to CMB studies.
The paper is organized as follows. Sect. 2 presents the stages
of the Master Catalog compilation (e.g., the
selection criteria for the reference papers and the removal
of non-thermal sources) and briefly summarizes
the content of the final compilation,
while an accurate and full description
of the catalog content is given in Appendix I.
Sect. 3 describes the production of the Synthetic Catalog at 2.7 GHz.
Sect. 4 concerns the completeness and flux limit of the
catalog and the spatial distribution of the listed sources.
Perspectives of possible applications of this Synthetic
Catalog to CMB studies are presented in Sect. 5.
Finally, we draw our main conclusions in Sect. 6.
2 The Master Catalog compilation
In this section we discuss the data processing which was applied to convert the information from the various reference catalogs into a uniform format for easy intercomparison in a Master Catalog.
2.1 Selection of the original catalogs
The Master Catalog was compiled from the 24 radio catalogs shown in Table 1. We follow the classification of HII regions by Lockman et al. 1996 and only include catalogs of diffuse and compact HII regions. Surveys of ultra-compact (UCHII) and extremely extended objects (EHE) will be considered in a forthcoming extension of the present list: they are bright in the infrared (UCHII) and in the optical (EHE) but relatively weak at radio frequencies.
The reason for following this route is driven
by the general goals of the work. Planned
and on-going CMB experiments
typically have angular resolutions ranging from a few arcmin
up to tens of arcmin in order to exploit the wealth
of cosmological information encoded
in the CMB anisotropies.
Therefore, diffuse and compact HII regions
– with a typical angular extension of a few arcmin – are the
most important to be taken into account if we want to investigate
the free-free emission as a contaminant of the CMB.
We have therefore considered
single-dish medium-resolution observations, typically
with beamwidths of a few arcmin, rather than
interferometer or synthesis telescope surveys
(Becker et al. 1994; Taylor et al. 1996)
which usually achieve a resolution of a few arcsec.
Also, single-dish low-resolution observations
(Westerhout 1958; Wilson Bolton 1960),
whose typical angular resolution is ,
have not been included in the sample of selected
references in order to avoid problems arising
from double-counting of the sources.
Likewise we have not considered surveys simply oriented to the study of the
morphology and spectral behaviour of the diffuse Galactic radiation at centimetric
wavelengths
(Reich et al. 1984;
Reich et al. 1990; Fürst et al. 1990a; Fürst et al 1990b;
Duncan et al. 1995).
Number of sources after subtraction of nonthermal objects. Notes: (a) the list of sources is retrieved by the intersection with the radio recombination line survey by Lockman et al. 1989; (b) early Parkes survey at 2.7 GHz; (c) Effelberg 100-m survey at 2.7 GHz; (d) Cygnus X; (e) nonuniform sky coverage; (f) Green Bank and Parkes-MIT-NRAO surveys cover almost the whole sky: HII regions have been identified from either optical or radio recombination line surveys along the disk.
| Reference | (GHz) | HPBW (′) | |||
|---|---|---|---|---|---|
| Altenhoff et al. 1970 | 1.4/2.7/5 | 10 | 325 | ||
| Altenhoff et al. 1979(a) | 5 | 2.6 | 265 | ||
| Beard 1966(b) | 2.7 | 7.4 | 13 | ||
| Beard Kerr 1969(b) | 2.7 | 7.4 | 34 | ||
| Beard et al. 1969(b) | 2.7 | 7.4 | 72 | ||
| Berlin et al. 1985 | 3.9 | 0.818.3 | 45 | ||
| Caswell Haynes 1987 | 5 | 4.2 | 308 | ||
| Day et al. 1969(b) | 2.7 | 8.2 | 109 | ||
| Day et al. 1970(b) | 2.7 | 8.2 | 48 | ||
| Downes et al. 1980 | 5 | 2.6 | 169 | ||
| Felli Churchwell 1972 | 1.4 | 10 | 80 | ||
| Frst et al. 1987(c) | 2.7 | 4.27 | 7 | ||
| Goss Day 1970(b) | 2.7 | 8 | 85 | ||
| Kuchar Clark 1997 | 4.8 | 3.1/4.2 | 760 | ||
| Mezger Henderson 1967 | 5 | 6.3 | 17 | ||
| Reich et al. 1986(c) | 2.7 | 4.27 | 5 | ||
| Reifenstein et al. 1970 | 5 | 6.5 | 105 | ||
| Thomas Day 1969a(b) | 2.7 | 8.2 | 39 | ||
| Thomas Day 1969b(b) | 2.7 | 8.2 | 29 | ||
| Wendker 1970(d) | 2.7 | 11 | 77 | ||
| Wilson et al. 1970 | 5 | 4 | 132 | ||
| Wink et al. 1982 | 5/15/86 | 2.6/1/1.3 | 112 | ||
| Wink et al. 1983 | 14.7 | 1 | 84 |
2.2 Identification and removal of SNRs
The selected catalogs may contain in principle also some Galactic sources, different from HII regions, that we need to exclude from our Master Catalog compilation. Therefore, supernova remnants (SNRs) of each selected catalog have been identified by comparing the coordinates of the catalog sources with those of the catalog of Galactic supernova remnants by Green 2000. The identification has been performed taking into account the average position uncertainty of the selected catalogs of HII regions and of the Green Catalog (both ).
2.3 Quoted flux densities and angular diameters
We provide the flux densities integrated over each source, ,
and the source angular diameter, .
In a few references (Wink et al. 1982 at
86 GHz; Wink et al. 1983) the flux density
is given only as a peak value.
We correct this to a true
value by assuming that
the source has a Gaussian profile and using the observed
diameter (see Rohlfs 1990).
The source angular diameter
is given in terms of observed diameter in a few references (Altenhoff et al.
1979, Downes et al 1980; Wink et al. 1983).
We derive a true diameter again assuming a Gaussian
source profile. For source dimensions
significantly smaller than the beamwidth, the references
give upper limit diameters.
The Master Catalogs includes
these derived flux densities and diameters for
completeness.
2.4 Other relevant data
In addition to the basic data on flux density and diameter, for
each source there are available further relevant data which
make the catalog more useful.
We include the notes from
Kuchar Clark 1997 on the environment of each source, indicating
whether the source is complex or if it has a strong source nearby.
Again, following Kuchar Clark 1997 we give radio
counterparts in other catalogs other than those referred to in Sect. 2.1.
Optical counterparts of the unobscured sources are obtained
from the identification given in the Catalog by Mársalková 1974.
We include available radio recombination line
data because they provide important information on
kinematics, distances and electron density for each HII region.
The data are given by Downes et al. 1980, Caswell Haynes 1987,
Kuchar Clark 1997, Reifenstein et al. 1970, Wilson et al. 1970,
Wink et al. 1982 and Wink et al. 1983 in the source
catalogs listed in Sect. 2.1 and are complemented by the
recombination line data of Lockman 1989.
2.5 The Master Catalog
All sources observed
at least by one of the surveys of Table 1
and recognized as Galactic HII regions
were included in the
Master Catalog. 1442 sources are listed.
All relevant information from each of the reference catalogs is
retained. Data for individual HII regions are available
from the references at 8 frequencies (1.4, 2.7, 3.9, 4.8, 5., 14.7, 15
and 86 GHz). This large data base is presented in a readily accessible
form as 11 sub-catalogs:
sub-catalog 1 coordinates (epoch 2000) and remarks
sub-catalog 2 / 3 flux density (Jy) / 1– () error
sub-catalog 4 / 5 diameter (arcmin) / 1– () error
sub-catalog 6 / 7 line velocity (km/sec) / 1– error (km/sec)
sub-catalog 8 / 9 line width (km/sec) / 1– error (km/sec)
sub-catalog 10 / 11 line temperature (K) / 1– error (K).
The sub-catalogs give, for each source, an identification
number along with the position in Galactic and celestial coordinates.
Apart from sub-catalog 1, each sub-catalog has 37 columns. The
columns are in order of increasing frequency of observation; at
each frequency the columns are in alphabetical order of the references
in Table 1. We note that for sub-catalog 6-11 (the radio
recombination line data) the observations may refer to frequencies other than
those in the main continuum catalog
(in this case, the line frequency is reported).
Appendix I gives a detailed
description of the content of each sub-catalog.
3 The Synthetic Catalog at 2.7 GHz
The final task in bringing together the wide-spread radio
data on HII regions is to construct a readily accessible
catalog summarizing the basic information on each of the
1442 sources covered in the comprehensive data base of the
Master Catalog. This Synthetic Catalog gives the best
available data on flux density, angular diameter and, where
available, the line velocity.
2.7 GHz was chosen as the base frequency for the Synthetic
Catalog; it lies in the middle of the frequency range of
those catalogs containing most of the data, namely 1.4, 2.7 and 5 GHz.
Since there is not complete source coverage
at any one frequency, we derive the flux density at 2.7 GHz from the
observed frequencies for all the sources. We
now describe how best-estimate values of the flux density,
diameter and velocity with corresponding error
estimates are derived from the Master Catalog.
3.1 Flux density estimates at 2.7 GHz
We estimate the flux density at 2.7 GHz in four different ways:
-
1.
we use the flux density measures at 2.7 GHz when these are available;
-
2.
if there are no flux density measures at 2.7 GHz and there are available measures at only one other frequency, we extrapolate these values to 2.7 GHz with the theoretical spectral index () which is typical of thermal bremsstrahlung emission in a thin plasma;
-
3.
if there are flux density measures only at frequencies 14.7 GHz, we first select the lowest among the given frequencies – averaging over 14.7 and 15 GHz when both are available – and then extrapolate to 2.7 GHz with ;
-
4.
if there are only flux density measures at frequencies other than 2.7 GHz and at least one measure at GHz, we follow these lines: we exclude the values at 3.9, 14.7, 15 and 86 GHz, we take the weighted average between 4.8 and 5 GHz if both measures are available, we interpolate the remaining values to 2.7 GHz (or extrapolate with if only one frequency measure is left).
We consider the data at 3.9, 14.7, 15 and 86 GHz less
reliable for the following reasons: the 3.9 GHz measure
may be significantly affected by the
ellipticity of the antenna pattern; at 14.7 and 15 GHz the
observing resolution is much higher than the typical reference
catalogs resolution; at 86 GHz, in addition to the higher
resolution, dust emission may contribute largely to the
observed flux. Moreover, we prefer to interpolate between 1.4 and 5 GHz
rather than extrapolate to 2.7 GHz directly from only one
of these two frequencies because we have no information
on the frequency location of the free-free knee.
In cases when multiple observations are available at the
same frequency, a weighted
mean flux density is computed, using the errors discussed below.


For the majority of the
sources in the reference
catalogs, flux density errors are quoted and these are used in
deriving the flux density and its error in the Synthetic Catalog.
In the catalogs where no errors are given, an estimate of the error
is made by comparing the flux from a catalog without errors with
the flux from a catalog (or some catalogs) giving errors.
In particular, we compute the relative (%) dispersion,
,
and try to fit the resulting distribution
in the plane with
a constant, , a linear, ,
and a quadratic, ,
dependence of on .
In these equations the fluxes are in Jy.
Before fitting the
distribution, we remove the relatively small number of points
with a dispersion .
Although we have considered also fits with
a constant, linear, and quadratic
dependence of on ,
we prefer to use
the distributions recovered from the fit carried out
with linear variables, since they
give, as expected, typical values of larger than
those obtained in the case of logarithmic variables and
so giving more conservative error estimates. Fig. 1 shows the results
of the procedure we have described.
An example of the estimates of errors is given by the early Parkes
2.7 GHz catalogs. We compare the list of Parkes sources
to the reference catalogs at the same frequency – 2.7 GHz –
(namely, Altenhoff et al. 1970,
Frst et al. 1987, Reich et al. 1986, Wendker 1970),
in order to retrieve the subset of Parkes sources whose flux
has been quoted with an estimated error. In particular, the comparison
retrieves 105 sources in common with the Altenhoff et al. 1970 catalog.
The scatter in the flux density differences, quite well fitted by the law
, is comparable to the errors of 10–30 % of the
Altenhoff et al. catalog alone.
Similar comparisons have been carried out for the Mezger
Henderson 1967 data and for Wink et al. 1983 data.
However, as for the Mezger Henderson data, the comparison
with other single catalogs does not provide a significant
statistical subset of sources. Therefore, we estimate the error
by considering simultaneously the sources from the Mezger Henderson
catalog and from all the other catalogs at 5 GHz (which leads to
consider altogether 38 common sources).
For the Wink et al. 1983 catalog, we derive an error estimate
from the comparison with the Wink et al. 1982 catalog for
which we have 21 common sources.
After having estimated the errors on the flux density measures for all catalogs,
we compute the errors on the flux densities of the Synthetic Catalog at 2.7 GHz.
When an extrapolation with
a spectral index from a measure at a single frequency different
from 2.7 GHz is applied, we use the standard error propagation rules.
No error on is included in the error propagation,
for simplicity.
Table 3 summarizes the errors quoted in the original catalogs and those
estimated in this work.
3.2 Angular diameter
We discuss here the assignment of an angular diameter with its associated error for every source in the Synthetic Catalog. The published diameter data are not as comprehensive as the flux density data described in Sect. 3.1; nevertheless we will assign a value of the diameter and an error for each source. For 42 % of the sources (derived from the Parkes catalogs and those of Mezger Henderson 1967, Wendker 1970, Wink et al. 1982, Wink et al. 1983, Berlin et al. 1985) there are no listed diameter errors. For 14 % of the sources no diameter is given; for these we derive an indicative diameter.
We assign a diameter for sources in the Synthetic Catalog as follows:
-
1.
when 2.7 GHz diameters are given, we use these values (possibly their weighted average);
-
2.
if there is at least one diameter measure at 5 GHz or at 4.8 GHz, we neglect possible measurements at other frequencies and use this value or, alternatively, the weighted average of the diameter measures at 4.8 and 5 GHz when available, using the errors discussed below;
-
3.
if diameter data are given only at frequencies other than GHz, we use the weighted average of the available frequencies, after previous exclusion of the measures at GHz, using the errors discussed below;
-
4.
if no diameter data is given at frequencies lower than GHz, we use the available measure at 14.7 GHz or at 15 GHz or, alternatively, their weighted average when both values are provided using the errors discussed below (we remember that no diameter data are available at 86 GHz).
Values at 14.7 and 15 GHz are preferably excluded because of the
much higher resolution at these frequencies than the
typical reference catalog resolution.
In each case, when multiple
observations are available at the same frequency, a weighted mean
is computed, using the errors discussed below.
Finally, we consider the assignment of a diameter to the
14 % of HII regions in the Synthetic Catalog which have
no quoted diameter in the reference catalogs.
It is possible to derive a first-order indicative
diameter by noting that the flux density and the diameter of HII regions are
weakly correlated, as shown in Fig 2 which includes
all the sources at 2.7 GHz with measured diameters.
The best fit to the data gives
as indicative diameter with a typical error
of a factor of 2–3. Each source with an indicative diameter is
annotated in the Synthetic Catalog; such diameter data clearly should not
be used in astrophysical analyses of the catalog.

Following the same strategy as in Sect. 3.1, where a catalog has no quoted diameter errors we estimate an overall error for that catalog by comparing the observed diameters of that catalog with another catalog having an adequate number of sources in common. However, with respect to the flux density case, we can now relax the strict requirement of comparing only different datasets at the same frequency. As shown in Fig. 3, there is no significant frequency dependence in the measured diameters at 2.7 GHz (the Parkes survey) and at 5 GHz (Altenhoff et al. 1970, Mezger Henderson 1967 and Reifenstein et al. 1970). On the other hand, provided that an adequate number of sources in common is retrieved, we prefer to consider in the comparison surveys at the same frequency and with similar angular resolution. Therefore, let () be the source diameter measure in the catalog without quoted errors (with quoted errors). We compute the relative (%) dispersion of the diameter measures, , and try to fit the resulting distribution in the plane again with a constant, linear, and quadratic, dependence of on (or of on ; in this case the fit error estimates are again less conservative) and after removing the points with a dispersion . In these equations the angular diameters are in arcmin.

Fig 4 shows the results of the error estimates.
In particular, we consider the comparison between the following
datasets (the first one is that for which we are estimating the errors):
Altenhoff et al. 1970a vs. Reifenstein et al. 1970 (48 common
sources);
Altenhoff et al. 1970b vs. Kuchar Clark 1997 (63 common sources);
Caswell Haynes 1987 vs. Wilson et al. 1970 (79 common sources);
early Parkes 2.7 GHz Survey vs. Reifenstein et al. 1970 (31 common sources);
Felli Churchwell 1972 vs. Kuchar Clark 1997 (21 common sources);
Wendker 1970 vs. Reifenstein et al. 1970 (8 common sources);
Wink et al. 1983 vs. Downes 1980 (59 common sources); Wink et
al. 1982 vs. Altenhoff et al. 1979 (53 common sources).
As for the Altenhoff et al. 1970 catalog, the data have been
split because the diameters have been
measured in two different ways: either they were taken from a survey
of Galactic sources made at 5 GHz with the 140-ft
antenna - beamwidth
(W.J. Altenhoff, P.G. Mezger and J. Schraml, private communication) -
or they were measured directly from contour maps.
We will annotate the set of sources for which
the size was measured in the 5 GHz survey Altenhoff et al. 1970a
and the remaining sources Altenhoff et al. 1970b.
For the Berlin et al. 1985 catalog, since none of the comparisons
with other catalogs retrieves
a significant number of common sources, we derive the error from the
mean of the dispersions given by each comparison.
Table 3 summarizes the estimated and quoted errors used
in calculating the diameters in the Synthetic Catalog.


3.3 Content of the Synthetic Catalog
The Synthetic Catalog summarizes the known radio frequency information on 1442 Galactic HII regions. It contains the position, flux density, diameter data for each HII region, supplemented by velocity data where available. To those HII region with no published diameter data, an indicative diameter is given (marked by ) on the basis of the flux-size correlation in Fig 2. For sake of clarity, the first ten lines of the Synthetic Catalog are reported in Table 2. The line velocity value that we quote in Col. 9 is the weighted average of the available data (see Sect. 2.4 for details). Although the original measures can be, for the same source, at different frequencies, the weighted average of these data is a meaningful quantity and provides a useful first-sight kinematic indication. Since the line velocity is an effect of the Galactic rotation motion, it does not strongly depend on the frequency of observation.
- Col. 1: source-numbering (records from 1 to 1442)
- Col. 2-3: galactic coordinates, l and b
- Col. 3-4: celestial coordinates (epoch 2000)
- Col. 5-6: derived 2.7 GHz flux density and 1– error (Jy)
- Col. 7-8: derived angular diameter and 1– error (arcmin)
- Col. 9-10: velocity relative to the LSR and 1– error (km/sec)
- Col. 11: notes on individual sources (see Sect. 2.4 and Appendix I for details)
| N | RA | DEC | S | Notes | |||||||
|---|---|---|---|---|---|---|---|---|---|---|---|
| 1 | 0.1 | 0.0 | 17 45 51.3 | -28 51 08 | 230.0 | 24.1 | 5.9 | 0.5 | -27.4 | 4.0 | W24 |
| 2 | 0.2 | -0.1 | 17 46 29.0 | -28 49 07 | 209.4 | 10.5 | 10.7 | 0.5 | 24.5 | 3.5 | |
| 3 | 0.2 | -0.0 | 17 46 05.6 | -28 46 00 | 177.6 | 38.1 | 9.2 | 0.5 | -12.7 | 3.5 | W24 |
| 4 | 0.3 | -0.5 | 17 48 17.0 | -28 56 25 | 2.5 | 0.7 | 2.7 | 1.7 | 20.0 | 4.9 | C,S |
| 5 | 0.4 | -0.8 | 17 49 41.7 | -29 00 33 | 8.0 | 2.6 | 7.0 | 2.3 | 20.0 | 4.9 | C,S |
| 6 | 0.4 | -0.5 | 17 48 31.1 | -28 51 17 | 4.1 | 1.0 | 3.9 | 1.8 | 24.0 | 4.9 | C,S |
| 7 | 0.5 | -0.7 | 17 49 32.2 | -28 52 19 | 2.9 | 0.9 | 2.3 | 1.4 | 17.5 | 4.9 | C |
| 8 | 0.5 | -0.1 | 17 47 11.6 | -28 33 44 | 28.3 | 4.0 | 3.3 | 1.4 | 45.8 | 5.0 | S,X |
| 9 | 0.5 | 0.0 | 17 46 48.2 | -28 30 37 | 40.3 | 8.6 | 4.8 | 0.3 | 47.1 | 2.0 | |
| 10 | 0.6 | -0.9 | 17 50 33.3 | -28 53 19 | 2.5 | 0.8 | 2.4 | 1.3 | 15.0 | 4.9 | S,S21,RCW142 |
4 Statistical properties of the Synthetic Catalog
The Synthetic Catalog combines the observational data from 24 catalogs with various flux density limits and different angular resolutions. The Kuchar Clark 1997 catalog, for example, reaches to a sensitivity of 30 mJy but is not sensitive to sources with diameters greater than 10′ due to its beamswitching strategy.

Other surveys (e.g. Altenhoff et al., 1970) are sensitive to a wide range of angular scales but include only sources stronger than 1 Jy. We now consider the properties of the sources listed in the Synthetic Catalog in the light of these selection criteria.
4.1 Completeness and flux density limit
A useful way of investigating the completeness of a catalog is to plot the integral count N() as a function of flux density . Fig 5 shows the integral count for the 1442 sources included in the Synthetic Catalog and for the five contributing catalogs containing more than 200 HII regions. It is evident that the Synthetic Catalog is losing sources fainter than 1 Jy. The data in the Synthetic Catalog for Jy are mainly contributed by the Kuchar Clark 1997 catalog. Some 50 % of the sources at 1 Jy are contributed by this catalog, with a higher fraction at lower flux densities.


The absence of sources at lower flux densities is largely the consequence of
source confusion along the Galactic plane.
For example, in the region l
there are 1200 Synthetic Catalog sources within the Galactic plane
(b);
in a 10′ beam (or a 10′ diameter source) there is one HII region per
15 beam area which represents a significant confusion level.
It is clearly difficult to resolve into individual sources the structure
seen in the central regions of the Galaxy. The majority, , of the weaker ( 1 Jy)
sources catalogued by Kuchar Clark are in the less complex regions of
the Galaxy such as the anticentre region (quadrants 2 and 3) – 73 sources – and
Galactic latitudes greater than
1∘ (b) in quadrants 1 and 4 – 19 sources –.
4.2 Spatial distribution
The Galactic latitude and longitude distribution of the HII regions in the Synthetic
Catalog are shown in Fig 6. A striking feature is the narrow
distribution in Galactic latitude where the full width at half power is
0.95∘ when averaged over all longitudes; the mean Galactic latitude
is b=0.05∘. This narrow distribution will reflect the distribution
of the O and B stars responsible for the ionization.
The main concentration in longitude is at 60∘ where the line
of sight cuts the spiral arms internal to the local arm in which the Sun lies.
There are also discernable peaks at 80∘ associated with the local
arm; the peak at 80∘ is the Cygnus X region where Wendker 1970
identified 77 HII regions in his survey. There is a clear deficit of sources
in the anticentre region of the Galaxy (=90∘–270∘). Although there is
a less complete coverage in this sector of the Galactic plane as indicated
in Table 1, the large deficit of sources is real. The optical study of
the distribution of HII regions in the outer Galaxy by Fich
Blitz 1984 indicate that they are limited to R 20 Kpc.
5 Applications of the Synthetic Catalog
An extensive data base of radio observations of HII regions has been distilled into the Synthetic Catalog of 1442 objects at a frequency of 2.7 GHz. We consider some uses of this catalog and the associated Master Catalog for studies of individual HII regions over a range of frequencies and for CMB studies.
5.1 Detectability of HII regions
The sensitivity of a particular instrument in Kelvin to an HII region of a given flux density expressed in Jansky depends upon the observing frequency , the beamwidth (FWHM), the sensitivity per second of integration and the observing time (the rms noise decreases with observing time as ). The rms noise in Jansky per second of integration, , is related to the rms antenna temperature in Kelvin per second of integration, , by:
and the same relation holds between the source signal expressed in terms of flux density or of antenna temperature. Here the source is assumed to be point-like and observed at the centre of a Gaussian, symmetric beam. Eq. (1) can be then used to determine the S/N for a point source of a given flux density. In cases when a source with a diameter comparable or bigger than the FWHM of the observing beam is considered, a correcting factor to Eq. (1) is required to compute the S/N. In particular, the S/N is 40 to 90 the value computed with Eq. (1) when a source with a diameter times the beamwidth or the beamwidth, respectively, is considered. The S/N represents an easy way to compare the signal produced by Galactic HII regions with the sensitivity of a typical CMB anisotropy experiment. Therefore, we apply the above treatment to the high resolution satellite experiment Planck by ESA 111http://planck.esa.nl, scheduled for launch in 2007. Planck will observe the entire sky with a sensitivity at the end of the mission of about 10 K per resolution element. The beamwidths vary between and from 30 to 857 GHz respectively. For numerical estimates, we consider here the channels at 30 and 100 GHz which have a nominal FWHM of 33.6’ and 10’. For comparison, we make the same calculation for -DMR for which, at 31.5 and 90 GHz the rms temperature was 150 and 100 K and the beamwidth was 7∘ (Boggess et al. 1992).
| Reference | flux error | size error |
|---|---|---|
| Altenhoff et al. 1970a | 10/30 | 6.5–0.4 () |
| Altenhoff et al. 1970b | 10/30 | 33.9+2.5 () |
| Altenhoff et al. 1979 | 5 | 10 |
| Beard 1966 | 33.5–0.1S () | 300 () |
| Beard Kerr 1969 | 33.5–0.1S () | 37–0.3 () |
| Beard et al. 1969 | 33.5–0.1S () | 37–0.3 () |
| Berlin et al. 1985 | 10 | 72.5 () |
| Caswell Haynes 1987 | 10 | 22.1+2.8 () |
| Day et al. 1969 | 33.5–0.1S () | 300 () |
| Day et al. 1970 | 33.5–0.1S () | 300 () |
| Downes et al. 1980 | 5 | 10 |
| Felli Churchwell 1972 | 15/35 | 77.4 () |
| Frst et al. 1987 | 10 | 300 () |
| Goss Day 1970 | 33.5–0.1S () | 37–0.3 () |
| Kuchar Clark 1997 | 10/20 | 16/25 |
| Mezger Henderson 1967 | 23.3() | 20/50 |
| Reich et al. 1986 | 10 | 300 () |
| Reifenstein et al. 1970 | 15 | 3 |
| Thomas Day 1969a | 33.5–0.1S () | 300 () |
| Thomas Day 1969b | 33.5–0.1S () | 300 () |
| Wendker 1970 | 6 | –73.6+17.6–0.5 |
| Wilson et al. 1970 | 15 | 5 |
| Wink et al. 1982 | 5/15 | 73.5–52.1+11.1 () |
| Wink et al. 1983 | 30.3–1.9S+0.1 S2 () | 85.8–38.1+5.2 () |
The S/N for all the HII regions in the Synthetic Catalog have been calculated as discussed above; the flux densities were estimated at each frequency from 2.7 GHz values assuming a flux density proportional to . Fig. 7 shows the number of sources per bin of S/N (the distribution function) and number of sources greater than a certain S/N (cumulative distribution function) for both Planck and -DMR at 30 and 100 GHz.


From Fig. 7 it is clear that the vast majority of sources in the Synthetic Catalog produces a signal which highly exceeds the detection threshold of the instrument. Therefore, not only all the Synthetic Catalog HII regions will be detected but also of these sources will have a S/N 100 (while the weakest sources, with S 10 mJy, will be seen with a S/N 3). As a consequence, Planck high sensitivity and high resolution should allow to significantly entend the existing HII regions data base. It is important to emphasize that none of the individual HII regions would have been seen by -DMR whose flux sensitivity according to Eq. (1) is less than Planck at 30 GHz and less at 100 GHz.
5.2 Radio/millimeter studies of HII regions
The ionizing radiation from the central O/B stars produces the HII region which
emits through the free-free mechanism from radio to submillimetric wavelenghts;
the surrounding dust is also heated by radiation originally derived from the
central stars and as a consequence radiates at submillimeter and IR
wavelenghts. The flux density of the radiation from these
two components was found to be equal in the
wavelenght range 1-3 mm (100 to 300 GHz) by Kurtz et al. 1994 for a selection of compact
HII regions. However, many interesting questions remain to be
resolved in the physical relationship between the HII region
and the radiation-heated dust cloud in which it is embedded. The Synthetic
Catalog provides a rich source of HII regions for further
study. Fig. 7 shows that many hundreds of HII regions will be detectable
at high sensitivity and with adequate resolution over the frequency range
30 to 857 GHz by Planck. Thus, this may represent a good chance
for a comparative study of the far-IR and radio continuum
morphology of Galactic HII regions.
Moreover, source identification in IR experiments
such as DENIS (Epchetein et al., 1994) and 2MASS (Kleinmann, 1992)
can benefit from the crosscheck with the Synthetic Catalog. In fact,
for these kind of experiments a major problem is the association
of an observed source with a bright IR Galactic object like an
HII region or an ultracompact HII region rather than with an
external Galaxy.
5.3 Use of the Synthetic Catalog in CMB studies
We will consider in this subsection several applications
of the Synthetic Catalog in CMB studies. The first use we discuss
is the
production of maps of the integrated free-free emission as seen with the
angular resolution of an instrument such as Planck at each
observing frequency. Free-free emission dominates the Galactic plane
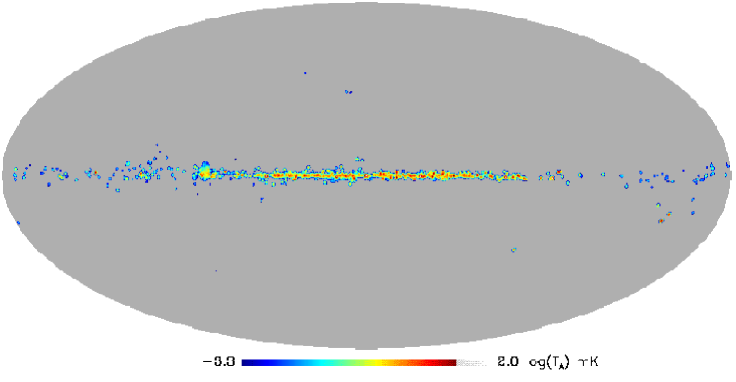
signal at least over the range 30 to 100 GHz. Fig. 8 shows the Galactic
plane emission resulting from HII regions as seen by Planck at
30 GHz where the beamwidth is 33.6’.
To make the map in Fig. 8, we have implemented a code which simulates
the contribution of each source in the Synthetic Catalog at a given angular resolution
by assuming a symmetric Gaussian profile for the source
brightness distribution
and numerically convolves, in real space,
the relevant part of the map – obtained after considering
the contribution from all the sources in the catalog –
with another symmetric Gaussian profile having the instrument FWHM.
The final map is generated in HEALPix
(Hierarchical Equal Area and IsoLatitude Pixelization
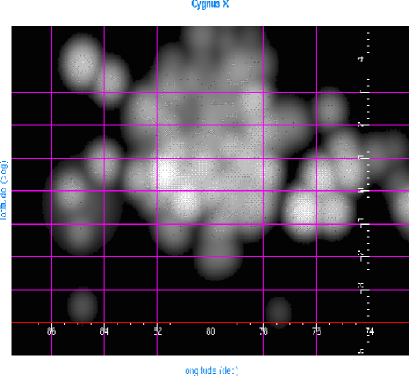
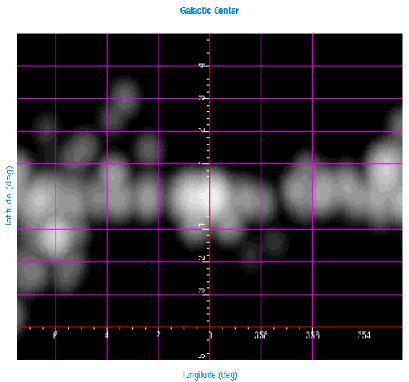
of the Sphere, by Gòrski et al. 1998). Fig. 9 shows the strong Galactic
centre and Cygnus X regions. Antenna temperature as high
as 50 mK are seen.
Moreover, HII regions, as delineated in Fig. 8, can in principle represent
a significant contribution – comparable to that produced by synchrotron and
dust emission – to one of the most critical
spurious effects in CMB surveys,
the so-called straylight contamination through their integrated signal in the sidelobes
(Burigana et al. 2001) which needs to be properly evaluated.
The optical design of Planck and similar
mapping instruments must be optimized
to minimize this effect. In any case, the residual straylight
should be taken into account in the data analysis.
HII regions also have a part to play in CMB imaging experiments
as suitable calibrators and as probes of the pointing and
beamshape. HII regions are non-variable and have quite a well-known
spectrum which makes them valuable calibrators along with planets
and the CMB dipole (Bersanelli et al. 1997). In addition, for space missions, they provide
auxiliary data for inflight beam reconstruction and
pointing by complementing the information from planet transits
(Burigana et al. 2002) and from the interplay between amplitudes
and phases of CMB signal with the instrumental noise (Chiang et al. 2002).
In particular, the Chiang et al. method, although not
requiring the use of bright sources, allows the
reconstruction of the beam ellipticity only
in the beam central regions while the Burigana et al. technique allows the complete
reconstruction of the beam shape down to a level of -25 dB but makes
use of non-variable, bright, compact sources. However, despite being originally
conceived for planets, the Burigana et al. method
can be easily extended to other classes of sources which also
enable to increase the number of transits over the space mission lifetime.
The Synthetic Catalog contains 36 HII regions which have a flux density
30 Jy at 30 GHz and a diameter than 5’. Accurate flux densities
ad positions can be determined from ground-based aperture synthetis
observations.
Finally, we point out that the angular extension of
a typical Galactic HII region represents an intermediate
case between point sources and diffuse foregrounds for which
component separation tools have been specifically designed
(see, e.g., Maino et al. 2001, and references therein). The fluctuations produced by such
extended sources and the capability of existing component
separation methods to handle with them will have to be furtherly
investigated in the next years.

6 Conclusions
We have collected radio data of Galactic HII regions
from 24 published works and built a self-consistent
database of 1442 sources. This work has resulted in the
construction of what we have called Master Catalog which
consists in 11 different sub-catalogs storing the
original information from the source references. In particular,
the sub-catalogs list flux densities and diameters as well
as radio line velocities, line widths and line
temperatures; errors are given on these
quantities.
From this large data set observed at a range of frequencies and
beamwidths, we have produced a readibily accessible Synthetic Catalog
giving the flux density, diameter and velocity (where available)
at 2.7 GHz, the frequency where most data are given. Errors on these
observed parameters are derived using the procedures discussed in
Sect. 3.
It should be emphasized that the Catalog is a compilation of published radio
data on HII regions; it is not a complete survey down to the
faintest flux density level listed. We argue in Sect. 4 that it is probably
complete to a flux density of 1 Jy. Nevertheless, the Catalog
provides an up to date finding list for the brightest HII regions
available for further study at microwave and submillimeter wavelenghts. The
Synthetic Catalog is also particularly relevant to future
high sensitivity CMB mapping projects such as Planck. We have
shown in Sect. 5 that the HII region Galactic distribution can contribute
to the straylight radiation, while individual compact bright HII regions
have a role as calibrators and as pointing and beamshape indicators.
The Master Catalog and the Synthetic Catalog are available via
ftp at: cdsarc.u-strasbg.fr.
Color figures can be obtained via e-mail request to
paladini@sissa.it.
Acknowledgements.
We wish to thank C. Witebsky for providing us with the -HII compilation and T.A. Kuchar and F.O. Clark for making their radio and IRAS data available prior to publication. We are also grateful to the CATS group for a constructive support to this work and to G. De Zotti and H.J. Wendker for useful discussions and suggestions. We thank L. Cambrecy for valuable comments to our work. R. Paladini acknowledges financial support from a N.A.T.O. International Exchange Scientific Programme grant and from a Marie Curie Training Site fellowship. We gratefully acknowledge K.M. Górski and all the people involved in the realization of the tools of HEALPix pixelisation.Appendix I: the Master Catalog
The Master Catalog contains the original data taken
from the source references of Table 1. Due
to the extensive amount of information, we have
divided for convenience the Master Catalog into
11 sub-catalogs. We give hereafter the description
of the structure of each of these compilations while,
for a general overview about the content of the sub-catalogs, we
refer the reader to Sec. 2.5.
As mentioned in the main text (Sect. 2.5), each sub-catalog
(except for Sub-catalog 1)
has 37 columns and 1442 entries corresponding to the
total number of sources. The columns are in order of
increasing frequency of observation and, at each
frequency, the columns are in alphabetical order of the references
in Table 1. In all sub-catalogs, a null entry corresponds to
no information available from the source reference.
Sub-catalog 1 lists only source coordinates, notes about the
environment and radio/optical couterparts. For its content
specificy, it presents a peculiar structure
with respect to the other sub-catalogs. In details:
- Col. 1: source-numbering (records from 1 to 1442)
- Col. 2-3: Galactic coordinates, l and b
- Col. 4-6: celestial coordinates: RA - J2000
- Col. 7-9: celestial coordinate: DEC - J2000
- Col. 10: general remarks - C= complex field, S= strong
source nearby, X=strong source nearby ( 10 Jy), radio or
optical counterpart. This flags follow the definitions given
by Kuchar
Clark 1997 according to which a source is in a complex field
when there are two or more
sources within either (i.e, four source
radii) or , whatever is
larger 222In Kuchar Clark’s paper, fluxes and
angular sizes are measured directly
from the survey images., or with a strong and/or much
stronger source nearby.
As for the counterpart in other wavebands, for the case of
the radio identifications: Ke refers to Kesteven 1968; NRAO
to Pauliny-Toth 1966; W to Westerhout 1958; 3C to Third
Cambridge Catalog (Bennett 1962) and 4C to Fourth Cambridge
Catalog (Gower et al. 1967 - Pilkington et al. 1965).
For the optical identifications, the Mársalková Catalog
1974 has been
consulted. In this case: BBW refers to Bok-Bester-Wade
1955; DWB to Dickel-Wendker-Bieritz
1969; Ge (a) to Georgelin-Georgelin 1970a; Ge (b) to
Georgelin-Georgelin 1970b;
Ge (c) to Georgelin-Georgelin 1970c; G to Gum 1955; H to
Hoffleit 1953;
RCW to Rodgers-Campbell-Whiteoak 1960; S to Sharpless
1959. Moreover, M stands
for Messier Catalog; NGC for Dreyers’New General Catalog and
IC for the Index Catalog.
Sub-catalog 2 to sub-catalog 11 have the following
structure:
- Col. 1: source-numbering (records from 1 to 1442)
- Col. 2-3: Galactic coordinates, l and b
- Col. 4-6: celestial coordinates: RA - J2000
- Col. 7-9: celestial coordinate: DEC - J2000
- Col. 10-11: 1.4 GHz - Altenhoff et al. (1970),
Felli Churchwell (1972)
- Col. 12-23: 2.7 GHz - Altenhoff et al. 1970,
Beard 1966, Beard Kerr
1969, Beard et al. 1969, Day et al. 1969, Day et al.
1970, Frst et al. 1987,
Goss Day 1970, Reich et al. 1986, Thomas Day
1969a, Thomas Day 1969b,
Wendker 1970
- Col. 24: 3.9 GHz - Berlin et al. 1985
- Col. 25-26: 4.8 GHz - Kuchar Clark 1997
- Col. 27-34: 5 GHz - Altenhoff et al. 1970,
Altenhoff et al. 1979, Caswell
Haynes 1987, Downes et al. 1980, Mezger Henderson 1967, Reifenstein et al. 1970,
Wilson et al. 1970, Wink et al. 1982
- Col. 35: 14.7 GHz - Wink et al. 1983
- Col. 36: 15 GHz - Wink et al. 1982
- Col. 37: 86 GHz - Wink et al. 1982.
Note on sub-catalog 2 and sub-catalog 4: these sub-catalogs,
including data on flux and angular diameters, always list
values corrected for the instrument beam. Their complementary sub-catalogs
are sub-catalog 3 and 5 quoting relative (%) errors.
Note on sub-catalog 6 to 11: these sub-catalogs list line velocity data.
Observations may refer
to frequencies other than those for the continuum data. In
particular:
- Col. 25-26: Kuchar Clark quote continuum data at 4.85 GHz and
line data from Reifenstein et al. 1970
and from Wilson et al. 1970 at 5 GHz (H109)
and from Lockman 1989 at 10 GHz (H85, H87 and H88)
- Col. 28: Altenhoff et al. 1979
quotes continuum data at 5 GHz while line data
are taken from Lockman 1989 at 10 GHz (H85, H87 and H88)
- Col. 29-33: Caswell Haynes 1987, Downes et al. 1980, Mezger
Henderson 1967, Reifenstein
et al. 1970, Wilson et al. 1970 quote both
continuum and line data at 5 GHz (H109, H110)
- Col. 34-36-37: Wink et al. 1982 quotes continuum data
at 5/15/86 GHz and line data at 8.9/14.7 GHz
(H90 and H76).
References
- (1) Altenhoff, W. J., Downes, D., Goad, L., Maxwell, A. Rinehart, R., 1970, AAS, 1, 319
- (2) Altenhoff, W. J., Downes, D., Pauls, T. Schraml, J. 1979, AAS, 35, 23
- (3) Beard, M. 1966, Aust. J. Phys., 19, 141
- (4) Beard, M. Kerr, F. J. 1969, Aust. J. Phys., 22, 121
- (5) Beard, M., Thomas, B. Mac. A. Day, G. A. 1969, Aust. J. Phys. Ap. Suppl., 11, 27
- (6) Becker, R. H., White, R. L., Helfand, D. J. Zoonematkermani, S., 1994, ApJS, 91, 347
- (7) Bennett, A., S., 1962, Mem. R. Astr. Soc., 68, 163
- (8) Berlin, A. B., Gol’nev, V. Y., Lipovka, N. M., Nizhel’skij, N. A. Spangenberg, E. E. 1985, AZh, 62, 229
- (9) de Bernardis, P., Ade, P. A. R., Bock, J. J. et al., 2000, Nature, 404, 955
- (10) Bersanelli, M., Muciaccia, P.F., Natoli, P., Vittorio, N. Mandolesi, N., 1997, A&AS, 121, 393
- (11) Boggess, N. W., Mather, J. C., Weiss, R. et al., 1992, ApJ, 297,420
- (12) Bok, B. J., Bester, M. J., Wade, C. M., 1955, Daedalus, Harvard Reprint, 416, 1
- (13) Burigana, C., Natoli, P., Vittorio, N., Mandolesi, N. Bersanelli, M., Exp. Astron., 2002, 12/2, 87
- (14) Burigana, C., Maino, D., Gòrski, K.M. et al., 2001, A&A, 373, 345
- (15) Caswell, J. L. Haynes, R. F. 1987, AA, 171, 261
- (16) Chiang, L.-Y., Christensen, P.R., Jorgensen, H.E. et al., 2002, A&A, 392, 369
- (17) Condon, J. J., Broderick, J. J. Seielstad, G. A., 1989, AJ, 97, 1064
- (18) Condon, J. J., Griffith, M. R. Wright, A. E., 1993, AJ, 106, 1095
- (19) Day, G. A., Thomas, B. Mac. A. Goss, W. M. 1969, Aust. J. Phys. Ap. Suppl., 11, 11
- (20) Day, G. A., Warne, W. G. Cooke, D. J. 1970, Aust. J. Phys. Ap. Suppl., 13, 11
- (21) Dickel, H. R., Wendker, H. Beiritz, J. H., 1969, AA, 1, 270
- (22) Downes, D., Wilson, T. L., Bieging, L. Wink, J. 1980, AAS, 40, 379
- (23) Duncan, A. R., Stewart, R. T., Haynes, R. F. Jones, K. L., 1995, MNRAS, 277, 36
- (24) Epchtein, N. et al., 1994, Astr. Sp. Sci., 217, 3
- (25) Felli, M. Churchwell, E., 1972, AAS, 5, 369
- (26) Fich, M. Blitz, L. 1982, ApJS, 49, 183
- (27) Fich, M. Blitz, L. 1984, ApJ, 279, 125
- (28) Frst, E., Handa, T., Reich, W., Reich, P. Sofue, Y., 1987, AAS, 69, 403
- (29) Frst, E., Reich, W., Reich, P. Reif, K. 1990a, AAS, 85, 691
- (30) Frst, E., Reich, W., Reich, P. Reif, K. 1990b, AAS, 85, 805
- (31) Georgelin, Y. P. Georgelin, Y. M., 1970a, AA, 6, 349
- (32) Georgelin, Y. P. Georgelin, Y. M., 1970b, AA, 7, 133
- (33) Georgelin, Y. P. Georgelin, Y. M., 1970c, AAS, 3, 1
- (34) Górski K.M., Hivon E. Wandelt B.D., 1998, Proceedings of the MPA/ESO Conference on Evolution of Large-Scale Structure: from Recombination to Garching, ed. Banday A.J., Sheth R.K., Da Costa L., 37, astro-ph/9812350
- (35) Goss, W. M. Day, G. A. 1970, Aust. J. Phys. Ap. Suppl., 13, 3
- (36) Gower, J. F. R., Scott, P. F. Wills, D., 1967, Mem. R. astr. Soc., 71, 49
- (37) Green, D. A. 2000, A Catalog of Galactic Supernova Remnants (2000 August version), Mullard Radio Astronomy Observatory, Cavendish Laboratory, Cambridge, United Kingdom
- (38) Gum, C. S., 1955, Memoirs RAS, 67, 155
- (39) Hanany, S., Ade, P., Balbi, A. et al., 2000, ApJ, 545, 5
- (40) Hoffleit, D., 1953, Ann. Harv. Coll. Observ., 119, 37
- (41) Israel, F. P. Van der Kruit, P. C. 1974, AA, 32, 363
- (42) Kesteven, M. J. L., 1968, Austr. J. Phys., 21, 369
- (43) Kleinmann, S. G., 1992, Robotic Telecopes in the 1990s, Asp Cof. Ser., 203
- (44) Kraus, J. D., 1966, Radio Astronomy, McGraw-Hill, New York
- (45) Kuchar, T. A. Clark, F. O. 1997, ApJ, 488, 224
- (46) Kurtz, S., Churchwell, E. Wood, D. O. S., 1994, ApJS, 91, 659
- (47) Leitch, E. M., Pryke, C., Halverson, N. W. et al., 2002, ApJ, 568, 28L
- (48) Lockman, F. J. 1989, ApJS, 71, 469
- (49) Lockman, F. J., Pisano, D. J. Howard, G. J. 1996, ApJ, 472, 173
- (50) Maino, D., Farusi, A., Baccigalupi, C. et al., 2002, MNRAS, 334, 53
- (51) Màrsalkovà, P. 1974, ASS, 27, 3
- (52) Mason, B., CBI collaboration, 2001, AAS, 199, 3402S
- (53) Mezger, P. G. Henderson, A. P. 1967, ApJ, 147, 471
- (54) Pauliny-Toth, I. I. K., Wade, C. M. Heeschen, D. S., 1966, ApJS, 13, 65
- (55) Pilkington, J. D. H. Scott, P. F., 1965, Mem. R. astr. Soc., 69, 183
- (56) Reich, W., Frst, E., Haslam, C. G. T., Steffen, P. Reif, K., 1984, AAS, 58, 179
- (57) Reich, W., Frst, E., Reich, P., Sofue, Y. Handa, T., 1986, AA, 155, 185
- (58) Reich, W., Frst, E., Reich, P. Reif, K., 1990, AAS, 85, 633
- (59) Reifenstein, E. C., Wilson, T. L., Burke, B. F., Mezger, P. G. Altenhoff, W. J., 1970, AA, 4, 357
- (60) Rodgers, A. W., Campbell, C. T. Whiteoak, J. B., 1960, MNRAS, 121, 103
- (61) Rohlfs, K., 1990, Tools of Radio Astronomy, Ed. Springer Verlag, Berlin
- (62) Scott, P. F., VSA collaboration, astro-ph/0205380
- (63) Sharpless, S. 1959, ApJS, 4, 257S
- (64) Smoot, G. F., Bennett, C. L., Kogut, A. et al., 1992, ApJ, 396L, 1S
- (65) Tasker, N. J., Condon, J. J., Wright, A. E. et al., 1994, AJ, 107, 2115
- (66) Taylor, A. R., Goss, W. M., Coleman, P. H., Van Leeuwen, J. Wallace, B. J., 1996, ApJS, 107, 329
- (67) Thomas, B. Day, G. 1969a, Aust. J. Phys. Ap. Suppl., 11, 3
- (68) Thomas, B. Day, G. 1969b, Aust. J. Phys. Ap. Suppl., 11, 19
- (69) Wendker, H. J. 1970, AA, 4, 378
- (70) Westerhout, G., 1958, B.A.N, 14, 215
- (71) Wilson, R. W. Bolton, J. G. 1960, P.A.S.P., 72, 331
- (72) Wilson, T. L., Mezger, P. G., Gardner F. F., Milne, D. K., 1970, AA, 6, 364
- (73) Wink, J. E., Altenhoff, W. J. Mezger, P. G. 1982, AA, 108, 227
- (74) Wink, J. E., Wilson, T. L. Bieging, J. H. 1983, AA, 127, 211
- (75) Witebsky, C., 1978a, NOTE 5006, Internal Report
- (76) Witebsky, C., 1978b, NOTE 5013, Internal Report