Uncertainties of Synthetic Integrated Colors as Age Indicators
Abstract
We investigate the uncertainties in the synthetic integrated colors of simple stellar populations, currently the most popular method of estimating the ages of unresolved stellar systems. Three types of uncertainties studied here originate from the stellar models, the population synthesis techniques, and from the stellar spectral libraries. Despite some skepticism, synthetic colors appear to be reliable age indicators as long as they are used for select age ranges. Rest-frame optical colors are good age indicators at ages 2 – 7 Gyr, mainly due to the clear redward evolution of hydrogen-burning stars (main-sequence stars and red giants). At ages sufficiently large to produce hot horizontal-branch stars, the UV-to-optical colors may provide an alternative means for measuring ages. This implies that one can use integrated colors as age indicators for globular clusters in nearby external galaxies and perhaps even for high redshift galaxies that are passively evolving. Such studies may provide important tests of various galaxy formation scenarios.
1 Introduction
Age determination of various stellar populations enhances our understanding not only on the evolution of stars and galaxies but also on cosmology. Population synthesis has been a very popular tool to do just this. For decades, however, the ages of stellar populations inferred by population synthesis studies based on the stellar evolution theory have been a factor of two larger than the age of the universe suggested by standard Big Bang cosmology models. This is often called “the age paradox”. This has made the efforts to understand the evolution of galaxies and cosmology by means of measuring their ages appear hopeless.
At last, the stellar evolution theory and cosmology seem to agree upon the age of the universe. Various improvements in input physics have caused significant changes in stellar models. As a result, the latest isochrone studies — currently the most reliable age dating technique — now yield approximately 20% smaller ages for Galactic globular clusters than previously derived (see Yi et al. 2001). At the same time, observational cosmologists found a strong evidence of anti-gravity force operating in the universe, which indicates a substantially larger age for the universe than predicted by the classic, matter-dominating flat universe model (Schmidt et al. 1998; Perlmutter et al. 1999). Although such an agreement does not validate either approach by any means, it may imply that both of these fields have matured enough that the predictions from stellar astrophysics can be compared with observational data with good reliability and perhaps can even be used to test cosmological models. Such predictions are basically temperatures, luminosities, and lifetimes at each evolutionary stage, in addition to the overall evolutionary pattern. These predictions are being tested in numerous studies mostly by isochrone users, and the agreement between models and observed data achieved so far seems quite encouraging (see Yi et al. 2001).
The isochrone-fitting technique currently cannot reach a target object beyond the distance to the Magellanic Clouds, however, because such distant populations are not spatially resolved. Thus, astronomers instead construct synthetic models for integrated properties based on the predictions from stellar astrophysics and use them to measure the ages of unresolved populations. Such efforts are made not only on simple systems, such as star clusters, but also on complex galaxy systems. For their capability to reach far in time and space and for being easy for application, synthetic colors are more popular than ever before. However, without assessing their reliability (or uncertainty) first, the level of significance of the analyses is hard to quantify. For example, despite the apparent success of the latest isochrone fits, stellar astrophysicists still believe that there are many important pieces of information that are missing in the stellar model construction process. Some of these uncertainties may have significant impacts on the population analyses that are based on synthetic colors. Yi et al. (2001) recently showed that their population synthesis models based on the latest isochrones yielded consistent ages on Galactic globular clusters to their isochrone-based ages (see their Figure 18). It is the goal of this paper to investigate the impacts of such uncertainties on such age derivations for various populations.
In this paper, we investigate three different categories of uncertainties. In §2, we demonstrate the effects of various input parameters and assumptions that are still poorly understood. First, the uncertainties in the stellar models. These are basically the problems related to the solar calibration, including the current approximation schemes for convection and the uniform scaling assumption for the chemical compositions. Second are the uncertainties in the synthetic model construction. Most notable of these are initial mass function (IMF) and mass loss. Last, but not least, are the uncertainties in the stellar spectral library. In §3, we translate such uncertainties into the uncertainties in the age estimations based on synthetic colors.
It was Charlot, Worthey, & Bressan (1996) that first performed a comprehensive investigation on the uncertainties of the synthetic models. They studied the uncertainties that come from using different sets of stellar models and stellar spectral libraries. In a way, our study is in the same spirit. The major difference is that we investigate the effect of each individual physical assumption separately. We then estimate the uncertainties in the final age estimates stemming from each source of uncertainty. This study is only for “simple” (single age and metallicity) stellar populations, and there are further sources of uncertainties in modeling composite populations, e.g., from star formation history and galactic chemical evolution. Through this study, we hope to provide both synthetic model builders and users with some guidelines as to what levels of certainties and limits they should expect from the models they deal with.
2 Uncertainties in Input Physics
2.1 Uncertainties in the Stellar Models
The most fundamental problem in building stellar models is that there is no strong physical justification for “the solar calibration”. There still are several important pieces of input physics that need to be understood further in order for us to achieve realistic stellar models. Most significant of all are convection and chemical evolution. Without knowing the underlying physics in such complex mechanisms, we try to find a solution that works for the sun. First, we assume that we know the luminosity, radius, and the age of the sun. This is already risky, because the solar luminosity measurements may be uncertain by as much as 1%. Next, we try to match the solar observables with models by fiddling with poorly-constrained input parameters, such as convection efficiency and chemical compositions. As a result of this step, we have a set of input parameters that works for the sun. We then apply it to all stars that have completely different physical and chemical properties. The danger of the solar calibration is well known to stellar astrophysicists. In fact, the sun may not even be a typical star. In this section, we investigate the sensitivity of synthetic population models to uncertainties in the current convection treatments and in the heavy element mixture. All models shown in this section are based on the assumption of a Salpeter IMF index (2.35), a mass loss efficiency and a dispersion , and the Lejeune et al.’s revised Kurucz spectral library (see §2.2 and 2.3).
2.1.1 Mixing Length Approximation (MLA)
Standard stellar models are still based on the half-a-century-old Mixing Length Approximation (MLA) for describing the convective energy transport. Within the framework of MLA, we assume a fixed value of the ratio of mixing length to pressure scale height, (also known as “the mixing length parameter”, ) that directs convection in the same manner in all different environments. The mixing length parameter primarily governs the stellar radius, and we find this value from the solar calibration. Obviously, there is a problem in this approach.
MLA is not a forward physical description, but a parameterisation. Thus, even if it can be justified in sun-like stars, it may break down in environments that are different from that of the sun. Such environments may include not only chemically-different stars but also different evolutionary stages of the same star. Although there are efforts to find more realistic descriptions of convection than MLA (e.g., Nordlund & Dravins 1990; Canuto 1990; Kim et al. 1996; Freytag, Ludwig, & Steffen 1966), there has not yet been a release of a comprehensive set of stellar models based on a more mature convection prescription. Therefore, it is important to understand the acceptable range of the mixing length parameter within the framework of MLA and its impact on the reliability of synthetic population models.
Figure 1 shows the effects of the mixing length parameter to the shape of isochrones at two ages. A larger value of causes a more efficient energy transport and thus the stellar models to appear hotter (bluer). The larger value (1.74) is currently the favoured value of the Yale-Yonsei collaboration (Yi et al. 2001) for matching the solar properties. Currently, the uncertainties in other input parameters (e.g., metal-to-hydrogen ratio measured in the sun, and solar helium abundance) prevent an accurate determination of . However, all latest calibrations are clustered around – 2.0 (e.g., Girardi et al. 2000; Vandenberg et al. 2000). Thus, our investigation with two values (1.74 and 1.5) well-represent a mean and one extreme case.
The effects of , which is not sensitive to age, naturally translates into uncertainties in the spectral energy distribution, as shown in Figure 2. The fluxes are normalized to the -band flux of our standard model, i.e., that of =1.74. The synthetic spectral energy distribution with a larger value of appears hotter. Figure 3 shows the color evolution of a sample population of a typical metallicity of Galactic globular clusters, i.e., [Fe/H]=1.3. The is defined as
| (1) |
where and are defined by averaging the flux within the ranges 1250 1850 Å and and 5055 5945 Å, respectively.
The difference in optical and near-infrared colors () seems insignificant at first sight. However, the color evolution with time is so small that even such small uncertainties in synthetic colors can translate into substantial uncertainties in the age estimate. For example, when is used, the uncertainty in the mixing length parameter alone can cause up to a 25% uncertainty in the age estimate.
It should also be noted that for low metallicities and for the age range shown here, U Bis not a good age indicator at all, because it does not behave linearly with decreasing main-sequence (MS) turn-off (MSTO) temperature (i.e., increasing age) under such conditions.
2.1.2 Convective Core Overshoot
Another important source of uncertainty in convection is the amount of convective core overshoot (hereafter, OS). Convective core overshoot, the importance of which was first pointed out by Shaviv & Salpeter (1973), is the inertia-induced penetrative motion of convective cells, reaching beyond the convective core as defined by the classic Schwarzschild criterion. Stars develop convective cores if their masses are larger than approximately 1 – 2 , typical for the MSTO stars in 1 – 5 Gyr-old populations, depending on their chemical compositions. Since the advent of the OPAL opacities, various studies have suggested a modest amount of OS; that is, OS , where is pressure scale height (see references in Yi et al. 2001). Thus, we have adopted OS=0.2 in our standard models. OS has many effects on stellar evolution. Among the most notable are its effects on the shape of the MSTO and on the ratio of lifetimes spent in the core hydrogen burning stage (i.e., the MS phase) and in the shell hydrogen burning stage (the red giant branch: RGB). The impacts of such effects on the isochrone and on the integrated spectrum have been discussed by Yi et al. (2000).
OS is by definition effective only for the stars massive enough to develop a convective core, so its effects are visible only in young populations. Figures 4 – 6 show that the effects are clearly visible in 1 Gyr models. But they quickly disappear already at 2 Gyr as soon as MSTO stars begin to have a radiative core. Accurate borders depend on the metallicity in question, as listed in Table 2 of Yi et al. (2001). Young populations with the effects of OS display bluer spectra. The effects of OS may appear negligible but are important in the age estimation of such young populations. In particular, Yi et al. (2000) demonstrated that precise age derivations for high- galaxies, which is a powerful method for constraining the galaxy formation epoch (Dunlop et al. 1996), are heavily subject to this uncertainty.
2.1.3 Chemical Composition
The chemical composition has many important impacts on stellar evolution. The first is on the nuclear energy generation. For example, the CNO cycle uses CNO elements as catalysts, and thus their higher abundance causes a more effective energy generation if the right conditions are met. Another effect is on the opacity. Atoms with many possible transitions (most notably Fe) are particularly important, because a small increase in their abundance can raise opacity significantly. Increase in opacity obviously causes the spectrum to appear redder, but it also governs the energy transport and energy generation.
The effects of helium abundance are not to be ignored, either. In the stellar cores in most evolutionary stages, helium abundance is the key factor in opacity and determines the internal temperature profile, which controls energy generation rates. For this reason, helium abundance primarily determines the pace of stellar evolution. However, this effect is strong only at metallicities above solar. Since this study is more focused on low metallicities (approximately solar and below solar), the uncertainty caused by the helium abundance is not explored in this paper.
Despite these potential complexities, the concept of metallicity often seems to be adopted too naively. Metallicity is generally given only in or in [Fe/H], but departures in some elements from this mean quantity (usually solar) cause important changes in stellar evolution. Most notable is perhaps the -element enhancement, which is ubiquitous in metal-poor stars and perhaps in super-metal-rich environments as well.
It is a common misconception that -enhancement changes the stellar evolution in a very mysterious way. Figure 7 shows two isochrones with and without -enhancement but for the same total . We are basically comparing two models of the same total metallicity in total metal abundance but of different -element abundances. In other words, the -enhanced models have higher abundances in -elements but lower abundances in other heavy elements. This figure shows no detectable difference. This implies that -enhanced models can be mimicked by more metal-rich standard (non--enhanced) models after an appropriate scaling, such as the one suggested by Salaris, Chieffi, & Straniero (1993). So, when we compare two metal-poor models with the same total metal abundance, -enhancement does not cause a significant difference in stellar evolution models. Naturally, little difference is expected in the color evolution models and in the age estimates based on them, either. The effect of -enhancement is somewhat more conspicuous when metallicity is equal or higher than a solar value; -enhanced stellar models are somewhat bluer. But, the magnitude of the difference is still small.
2.2 Uncertainties in the Synthetic Model Construction
The synthetic population models shown in the previous section are all based on popular choices of the input parameters used in the population synthesis; that is, the Salpeter initial mass function, and the mass loss parameters that reproduce the horizontal-branch (HB) morphology of Galactic globular clusters. However, whether such choices are valid in all populations is debatable. In this section, we investigate the contribution of the population synthesis input parameters to the uncertainty of synthetic colors. All models shown in this section are based on the assumption of =1.74, OS=0.2, and [/Fe]=0 (see §2.1).
2.2.1 Initial Mass Function (IMF)
Since its first introduction by Salpeter (1955), the Salpeter IMF has been the most popular ingredient in galaxy population synthesis studies. However, whether the same slope derived from the local population would be valid for describing different populations formed in different environments is debatable. Besides, the departure of the IMF from the power law below approximately a solar mass is no longer beyond any doubt (e.g., Miller & Scalo 1979; Kroupa, Tout, & Gilmore 1990). A single power-law with one slope is not an accurate representation of the true IMF, and it may lead to seriously inaccurate synthetic models. Thus, we investigate the effects of IMF by choosing three significantly different IMF slopes in the context of the power law: 1.35, 2.35 (Salpeter), and 3.35.
The low-mass departure is not a serious issue in the integrated luminosity evolution of a population, because such low-mass stars are in the faint, MS stage during the most of the age range that we are interested in. For the age range that we are studying in this paper — i.e., 1 through 15 Gyr (or, a MSTO mass range of 2 – 0.9), the Salpeter slope (2.35) appears to be a good approximation (Sagar, Munari, & de Boer 2001). Thus, the range of slope we have chosen seems sufficiently large to represent the uncertainty of the IMF slope.
Figure 8 shows the effect of the IMF slope to the integrated spectra. The comparison is shown for two ages (3 and 10 Gyr). Two dotted lines are the models for the smaller IMF slope. Younger models are normalized to the -band flux of their older (10 Gyr) model. Two old models with different IMF slopes are on top of another, being indistinguishable. The difference in luminosity evolution is notable. When the IMF slope is uncertain by 1.0, as shown here, the luminosity evolution model is uncertain by 0.5 mag between the two epochs of 3 Gyr and 10 Gyr of ages; figuratively speaking, between redshift 1 and 0 (assuming a -dominated flat universe). This difference in the luminosity evolution, 0.5 mag, is approximately half of the luminosity evolution observed in elliptical galaxies that are often believed to have been passively evolving. Thus, it is extremely important to learn about the true IMF in order to interpret the observed luminosity evolution correctly. If the true IMF slopes for old populations (formed at high redshifts) were different from that of the local field stellar sample (such as the Salpeter slope), such simplistic approaches in interpreting luminosity evolution data are bound to be misleading.
The impact of the IMF slope also appears in the color evolution, although less severely. Figure 9 shows this. Synthetic models become redder as a smaller IMF slope is used, because a smaller slope means a larger number density of more massive MS stars, which evolve faster to become red giants.
2.2.2 Mass Loss Efficiency
Another key area of uncertainty is the treatment of mass loss on the giant branch, which predominantly governs the temperatures of post-giant branch stars. Post-giant branch stars account for 30% of the total light in the -band at a 2 Gyr age, and 40% in the near UV at 12 Gyr; and, thus, outdated values for mass loss lead to serious errors in the flux distribution.
Whether the Reimers (1975) empirical formula is valid for the mass loss in all stars is debated (see references in Willson 2000). Most of the empirical mass loss measurements are conducted on high-mass (above solar) asymptotic giant branch stars, and it may not accurately describe the mass loss that takes place on the RGB of low-mass stars. Yet, it is still the most popular prescription in population synthesis studies. Reimers’ empirical formula is as follows:
| (2) |
where is the luminosity, is the surface gravity, and is the radius.
Even when we assume that Reimers’ formula provides a good approximation, its fitting parameter is still somewhat uncertain. Renzini (1981), among others, noted that one can determine in low-mass stars by comparing the mean mass of the red giants with that of HB stars in globular clusters. The mean mass of red giants can be relatively well-derived from the MSTO isochrone fitting, while that of HB stars can also be determined through pulsation analysis or synthetic HB construction, albeit with a somewhat lower precision. Renzini (1981) found of 0.3 based on the information available then, while the more recent work of Yi et al. (1997; 1999) found a factor of two larger efficiency favoured. It is, however, very difficult to compare one value to another because it depends not only on the stellar evolutionary tracks that were used to compute the mass loss but also on the ages assumed for the globular clusters in question. Thus, the actual values of the efficiency parameter or of the mass loss derived from different studies may be slightly different from one study to another. However, they must be able to reproduce the observed HB morphology using the mass loss efficiency they have chosen. Yi et al. (1999)’s choice of focused on the data of Galactic globular clusters of typical metallicity, i.e., [Fe/H]=1.3. However, Yi et al. (1997) also remarked about a possible positive correlation between the mass loss efficiency and metallicity, which is consistent with the theoretical suggestion of Willson (2000). It seems that an accurate computation of mass loss as a function of stellar mass (time) and of metallicity is still a difficult task.
The mass loss efficiency is appears to be uncertain at least by a factor of two to three — approximately in the range of 0.3 through 1.0. However, this uncertainty is mostly due to its ill-understood sensitively to metallicity. For a given metallicity, the synthetic color-magnitude diagram (CMD) fitting technique suggests approximately 20% uncertainty in . Therefore, we investigate the outcome by the use of three values of mass loss efficiency: 0.55, 0.65 (standard), and 0.75. Figure 10 shows the result.
When a larger value of is used, stars lose more mass on the RGB and become lower-mass, hotter, HB stars. This results in a higher UV flux. Old Galactic globular clusters in general exhibit UV spectra as seen in the model with (curve in the middle in the UV). Most clusters are bracketed by the other two models in terms of UV strength (see Yi et al. 1997). This effect becomes noticeable only after the population is old enough to develop a blue HB. We illustrate this in Figure 10 by showing models at two ages. Figure 11 shows this in color evolution. The non-monotonicity in B Vat ages 9 – 15 Gyr is due to the gradual development of a bluer HB with increasing age. The blueward turn-around at age 10 Gyr is due to the first appearance of the blue HB. The redward turn a few Gyr later is due to two effects. First, at such large ages, low-mass stars evolve very slowly and thus a smaller number of stars leave the hydrogen-burning stage to enter the HB phase. Second, some of red giants, which are already quite low in mass, lose too much mass during this long evolution on the RGB and consequently lack enough mass in the envelope to ignite the helium core flash. These stars may skip the HB phase and become faint planetary nebulae.
The color evolution beyond 13 – 14 Gyr is, however, quite uncertain because there are complex interplays between stellar evolutionary pace, the growth of core, mass loss, and the helium core flash. It should also be noted that similar effects from the HB morphology is believed to be important in spectral line index evolution as well (Lee, Yoon, & Lee 2000).
2.2.3 Mass Loss Dispersion
The dispersion in mass loss, evident from the color spread on the HB, has a similar, albeit smaller, effect, as Yi et al. (1997) demonstrated. The over-simplistic clump-star assumption for all post-giant phases is still routinely employed, inevitably resulting in inaccurate models. This dispersion, often denoted by (in ), is probably caused by the dispersion in mass loss on the RGB. It can be estimated by comparing synthetic HBs to observed ones. Various studies have adopted the single Gaussian mass function to construct synthetic HBs, and the value of the Gaussian mass dispersion has been reported to be around 0.02 with some uncertainty (Lee, Dmarque, & Zinn 1994; Catelan 2000). Except for some clusters that show a strong multi-modal color distribution on the HB (e.g., M 15), no Galactic globular cluster shows a mass dispersion considerably larger than twice of this value. Thus, we chose three values of , 0.001, 0.02, and 0.04, representing a single-peaked clump, normal, and wide mass dispersion assumptions.
Figures 12 – 13 show the results. The effects are qualitatively similar to those of , although somewhat smaller. They appear only at large ages, where a population develops an HB that is sufficiently blue.
2.3 Uncertainties in the Stellar Spectral Libraries
Another significant source of uncertainty is the quality of the spectral libraries that are used to map theoretical stars into the observational domain. For transforming theoretical quantities to colors, color transformation tables are more popular than spectral libraries. Among the most popular color transformation tables are that of Green, Demarque, & King (1987) and that of Kurucz (1979; 1992). The Green et al. table is a semi-empirical one in the sense that they modified the old Kurucz table (1979) using empirical stellar data. As a result, the Revised Yale Isochrones based on the Green et al. table matched the observed CMDs of star clusters reasonably well. More than a decade later, Kurucz made a major update on his stellar spectral library and a corresponding color transformation table (Kurucz 1992). This new, purely theoretical library is still reported to seriously mismatch the cool-star data (e.g., Morossi et al. 1993), however. An effort to construct a semi-empirical spectral library based on the latest Kurucz library was made by Lejeune and collaborators (Lejeune, Cuisinier, & Buser 1997; 1998). Yi et al. (2001) find that this Lejeune et al.-calibrated Kurucz library (hereafter, the LCBK library) is qualitatively as good as that of Green et al. in reproducing observed CMDs. The LCBK library appears to be better calibrated in high metallicities and on the RGB, while the Green et al. table performs better for low metallicities and on the MS. Consequently, Yi et al. (2001) have released their newly computed isochrones using both color transformation schemes.
If we grant that we cannot yet clearly prefer one of these libraries, we are immediately trapped by the fact that they yield substantially different color evolution models. Figures 14 and 15 show the difference in color for an approximately solar metallicity stars but for two different evolutionary stages; MS stars and red giants. Compared to the libraries are empirical stellar data (plus symbols), kindly provided by Worthey (priv. comm.). Figure 14 shows that the LCBK table is correcting the dwarf data of the Kurucz table substantially in the low-temperature regions. As a result, the corrected table is very close to that of Green et al. (GDK). In and , the GDK colors seem to match the empirical data better. The difference between the LCBK table and the GDK table seems small but large enough to stand out in the MS isochrone fitting. However, it is the comparison of low-gravity stars (e.g. red giants) that is striking. Figure 15 shows that the difference between different color calibrations is very large in certain temperature ranges. Similar differences exist in other metallicities. It should be noted that the empirical calibration is still quite poor, espeicially at super-solar metallicities because stellar sample are scarce; and for this reason, modeling super-metal-rich systems (e.g. giant elliptical galaxies) is not trivial. Figures 15 may give readers an impression that the LCBK colors match the empirical data very well. However, the truth is that the empirical temperature-color relations (shown as plus symbols) suffer from large ( mag in ) uncertainties, as shown evidently in Figure 4 of Lejeune et al. (1997). Obviously, such differences will appear in the synthetic spectra and colors as uncertainties.
Figure 16 shows a comparison of the synthetic model spectra based on two different spectral libraries; the Kurucz library and the LCBK library. The Green et al. calibration was made only on colors, but not on the spectral library, and thus it is not available for spectral synthesis. But, the difference between the LCBK library and the Kurucz library is large enough to represent the current level of uncertainty in the spectral library. The model based on the LCBK library is in general redder for a given age. This appears systematically in B Vand , as shown in Figure 17.
| Uncertainty | Range studied (standard in brackets) | Ages of large impact |
|---|---|---|
| Mixing Length Approximation | =1.5 & (1.74) | all ages |
| Convective Core Overshoot | OS=(0.2) & 0.0 | age2 Gyr |
| -enhancement | [/Fe]=(0.0) & 0.3 | none if is fixed |
| Initial Mass Function Slope | x=1.35, (2.35), & 3.35 | age4 Gyr |
| Mass Loss Efficiency | =0.55, (0.65), & 0.75 | age8 Gyr |
| Mass Loss Dispersion | =0.01, (0.02), & 0.04 | age8 Gyr |
| Spectral Library | Kurucz (1992), & Lejeune et al. (1997, 1998) | all ages |
3 Uncertainty in Synthetic Colors
The uncertainties in synthetic colors caused by the uncertainties in various input physical assumptions are shown in Figure 18 without legends. Basically, the mixing length parameter, the IMF slope and the spectral library make moderately important contributions to the uncertainty over all ages. On the other hand, convective core overshoot is important only at small ages (less than approximately 2 Gyr), while the mass loss efficiency and the mass dispersion are important only at large ages. If total metallicity is kept the same, -enhancement plays little role. This is summarised in Table 1.
The total uncertainty (standard deviation) is shown in Figure 19 as inner (smaller) error bars. In the worst scenario, if all sources of uncertainties behave in the same direction, the maximum uncertainty in colors as a function of age would appear as the outer (larger) error bars. Such a pessimistic outcome is very unlikely, however. The errors in the color at ages smaller than 10 Gyr are underestimated. This is because we are not exploring the impact of the post asymptotic giant branch (PAGB) stellar mass – the prime factor that determines the UV colors at small ages – as a source of uncertainty, which is poorly understood. At large ages, HB stars are likely to dominate the UV flux. Thus the uncertainty regarding the PAGB mass is probably negligible.
It is clear that U Bis not a good age indicator at all at least for this metallicity, as it behaves non-monotonically with respect to age. The non-monotonicity disappears in metal-rich models, but we feel that U Bis still poorly calibrated relative to other optical colors. Both B Vand seem reasonable as age indicators, but only at small ages. Once the population is older than approximately 7 – 8 Gyr, the spectral evolution in the visible bands is minimal. Besides, at somewhat larger ages, populations gradually develop a larger number of blue HB stars that counteract the redward evolution of the MSTO, causing non-monotonicity. Thus, we suggest that B Vand should not be used to derive the ages of systems older than 7 – 8 Gyr. At larger ages than that, becomes our choice.
The estimated errors of age estimates (one sigma) in the range of ages 2 – 7 Gyr, as shown in Figure 19, are typically 0.01 – 0.02 mag both in B Vand . For ages 1 – 2 Gyr, the uncertainty is dominated by the uncertainty in the overshoot parameter and can be as large as 0.1 mag. In this sense, the best results of age determination can be achieved when synthetic models are applied to 2 – 7 Gyr old populations.
4 Uncertainty in Age Estimates Derived using Synthetic Colors
The uncertainties in synthetic colors directly translate into uncertainties in age estimates. Figure 20 and Table 2 show the level of uncertainty in age estimates for two metallicities. In Figure 20-(a), we show only the metal-poor model, because the UV spectral evolution of metal-rich populations have not been calibrated sufficiently, in particular in terms of mass loss efficiency. This is because there are not enough old, metal-rich simple stellar populations that can be used to constrain mass loss efficiency at high metallicities. Even in B Vand , shown in Figure 20-(b) and (c), we do not have the same confidence in our old, metal-rich models as we do in metal-poor models for this reason.
The uncertainty is smallest at ages 2 – 5 Gyr. If a population has formed at a high redshift (say at 5), it would be this old at redshift 1 – 2. This demonstrates a clear advantage of studying redshift 1 – 2 objects. At =1, rest-frame B Vwould be approximately . Any color similar to this would work as a useful age indicator for old populations.
Most of the detectable distant populations are currently metal-rich. Synthetic colors are powerful probes of their ages, but only when they are in the age range of 2 – 5 Gyr. Thus, we call for caution in all studies that aim to derive the galaxy evolution history by means of population synthesis models. Rest-frame B Vis affected by the uncertainty in mass loss and modeling is seriously hampered by the uncertainties in the spectral library.
| Age | [Fe/H]=1.3 | [Fe/H]=0.0 | |||||
|---|---|---|---|---|---|---|---|
| (Gyr) | B V | B V | |||||
| 2 | – | 0.4 | 0.5 | 0.4 | 0.3 | ||
| 4 | – | 0.2 | 0.4 | 0.5 | 1.2 | ||
| 7 | – | 0.7 | 0.9 | 0.7 | 2.0 | ||
| 11 | 0.5 | – | – | – | – | ||
| 15 | 0.5 | – | – | – | – | ||
It is already very difficult to construct reliable, metal-rich simple stellar population models (single metallicity, coeval populations) in bands. To make the matters worse, galaxies are not simple stellar populations at all. Population analyses on galaxies therefore should be performed with much caution.
Despite our cautionary remarks, it is encouraging to find that the error bars in age estimates are so small. Our analysis suggests that the level of reliability of the current population synthesis models is likely to allow us to distinguish 13 Gyr-old populations from 8 Gyr-old ones and 8 Gyr-old one from 2 Gyr-old ones with at least 2 – 3 sigma confidence. Therefore, it is possible to use such broad band colors to determine the ages of simple stellar populations, such as globular clusters, in external galaxies. Precise measurements of the ages of globualr clusters in elliptical galaxies have been of particular interest, because they test elliptical galaxy formation scenarios, which is a key issue in modern cosmology.
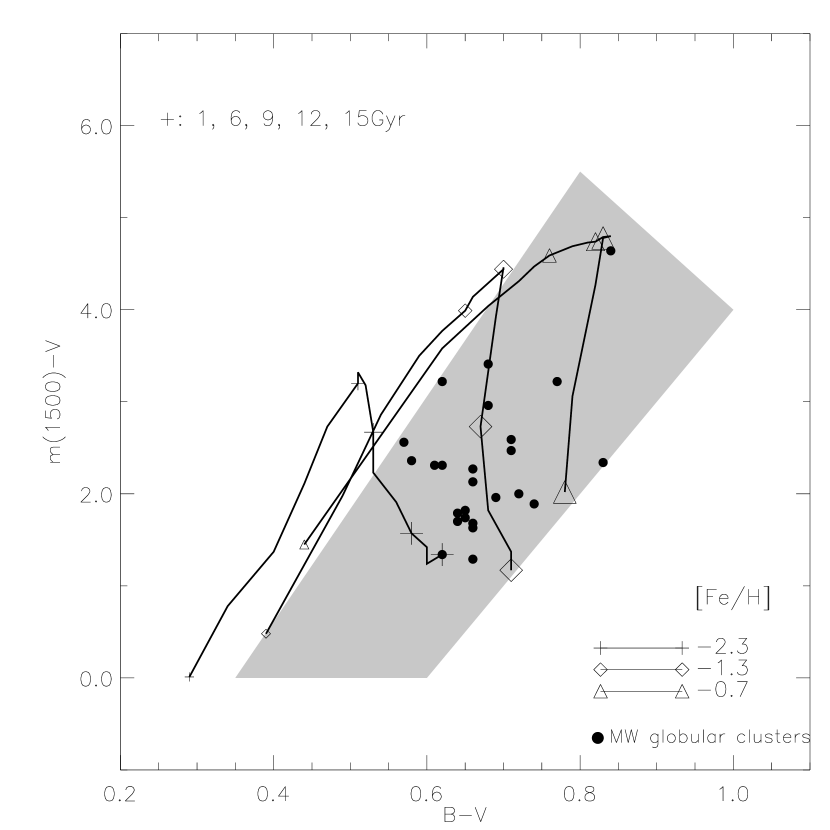
Because the UV to optical color is a good age indicator for old populations, one can apply a two-color diagram, such as the one shown in Figure 21, to observed data in order to distinguish old populations from young ones. Once again, we include only metal-poor models in this plot because we are less confident about the UV spectral evolution of metal-rich populations. If observed data are clustered only along one narrow straight sequence as shown on the left of the shaded box in Figure 21, the data would imply that the populations are all substantially younger than Milky Way. On the other hand, outliers toward the right-hand side of this diagonal sequence, i.e., in the shaded box, would be considered older populations. Overplotted are Galactic globular cluster data. The UV-to-V colors and - are from Dorman, O’Connell, & Rood (1995) and Harris (1996), respectively. All Galactic globular clusters are populating in the shaded box, which is consistent with their large ages. This and similar analyses may be useful to break the infamous age-metallicity degeneracy (Worthey 1994) and derive the ages of simple stellar populations, such as external star clusters.
5 Conclusions
Despite some skepticism, synthetic integrated colors appear to be reliable age indicators in select age ranges. Rest-frame optical colors are good age indicators at ages 2 – 7 Gyr, mainly due to the clear redward evolution of core hydrogen-burning stars. At larger ages optical colors fail to be reliable age indicators for two reasons. First, at large ages spectral evolution is very slow. Second, as MS stars become less massive with increasing age, a population develops hotter helium-burning stars, which causes non-monotonic evolution of optical colors. At sufficiently large ages, UV-to-optical colors may provide an alternative means of measuring ages. This can be applied to measure the ages of the globular clusters in nearby bright elliptical galaxies. Such studies may provide important tests against various galaxy formation scenarios.
We performed this investigation mainly on metal-poor populations, because we feel considerably less confident about input assumptions in modeling for metal-rich populations. The most serious problem in modeling metal-rich systems is the uncertainty in mass loss in low-mass, metal-rich stars. We believe that the most reliable way to constrain mass loss for such systems is to match their HBs with synthetic HB models. Thus, it is essential to collect accurate CMDs of metal-rich simple stellar populations.
The caveat of this analysis is that the estimated uncertainty in age derivation may not be realistic to populations of different metallicities and to composite populations. However, analyses similar to the one shown in Fig. 21 may be able to constrain the ages of simple stellar popuations regardless of their metallicities.
The impacts of the various uncertainties studied here have been investigated by means of the Yale stellar evolution code and the Yi’s population synthesis code. The magnitudes of such impacts could vary when different codes are used, for instance due to the use of different nemurical techniques, but probably only slightly. Thus, any disagreement between population models substantially larger than that demonstrated in this study would be difficult to justify.
Acknowledgments
I am grateful to the referee, Guy Worthey, for constructive comments, stellar color data used in Figures 14 and 15, and for an insightful suggestion regarding Figure 21. I thank Thibault Lejeune, João Fernandes, Steve Zepf, and many others who encouraged me to start this investigation. Part of this work was performed while I was at California Institute of Technology. This work was supported by the Creative Research Initiative Program of the Korean Ministry of Science & Technology (grant).
References
- (1) Canuto V. M., 1990, A&A, 227, 282
- (2) Catelan M., 2000, ApJ, 531, 826
- (3) Charlot S., Worthey G., & Bressan A., 1996, ApJ, 457, 625
- (4) Dorman, B., O’Connell, R., & Rood, R. T. 1995, ApJ, 442, 105
- (5) Dunlop J., Peacock J., Spinrad H., Dey A., Jimenez R., Stern D., & Windhorst R., 1996, Nature, 381, 481
- (6) Freytag B., Ludwig H.-G., & Steffen M., 1966, A&A, 313, 497
- (7) Girardi L., Bressan A., Bertelli G., & Chiosi, C., 2000, A&AS, 141, 371
- (8) Green E. M., Demarque P., & King C. R., 1987, The Revised Yale Isochrones and Luminosity Functions (New Haven: Yale Univ. Obs.)
- (9) Harris, W.E. 1996, AJ, 112, 1487
- (10) Kim Y.-C., Fox P. A., Sofia S., & Demargue P. 1996, ApJ, 461, 49
- (11) Kroupa P., Tout C. A., & Gilmore, G., 1990, MNRAS, 244, 76
- (12) Kurucz R., 1979, ApJS, 40, 1
- (13) Kurucz R., 1992, in The Stellar Population in Galaxies, eds. B. Barbuy & A. Renzini (Dordrecht: Reidel), 225
- (14) Lee H.-c., Yoon S.-J., & Lee Y.-W. 2000, AJ, 120, 998
- (15) Lee Y.-W., Demarque P., & Zinn R., 1994, ApJ, 423, 248
- (16) Lejeune Th., Cuisinier F., & Buser R., 1997, A&A, 125, 229
- (17) Lejeune Th., Cuisinier F., & Buser R,. 1998, A&A, 130, 65
- (18) Miller G. E., & Scalo, J. M., 1979, ApJS, 41, 513
- (19) Morossi C., Franchini M., Malagnini M. L., Kurucz R. L., & Buser R. 1993, A&A, 277, 173
- (20) Nordlund A., & Dravins D., 1990, A&A, 228, 155
- (21) Perlmutter S. et al., 1999, ApJ, 517, 565
- (22) Reimers, D. 1975, Mém. Soc. Roy. Sci. Liège, 6th Ser., 8, 369
- (23) Renzini A., 1981, in Physical Processes in Red Giants, eds. I. Iben & A. Renzini (Dordrecht: Reidel), 431
- (24) Sagar R., Munari U., & de Boer K. S. 2001, MNRAS, 327, 23
- (25) Salaris M., Chieffi A., & Straniero O., 1993, ApJ, 414, 580
- (26) Salpeter E. E. 1955, ApJ, 121, 161
- (27) Schmidt B. P. et al., 1998, ApJ, 507, 46
- (28) Shaviv G., & Salpeter E. 1973, ApJ, 184, 191
- (29) VandenBerg D. A., Swenson F. J., Rogers F. J., Iglesias C. A., & Alexander A. R., 2000, ApJS, 532, 430
- (30) Willson L.A., 2000, ARAA, 38, 573
- (31) Worthey, G. 1994, ApJS, 95, 107
- (32) Yi, S., Brown, T., Heap, S., Hubeny, I., Landsman, W., Lanz, T., & Sweigart, A. 2000, ApJ, 533, 670
- (33) Yi S., Demarque P., & Oemler A. 1997, ApJ, 486, 201
- (34) Yi S., Demarque P., Kim Y.-C., Lee Y.-W., Ree C. H., Lejeune T., & Barnes S., 2001, ApJS, 136, 417
- (35) Yi S., Lee Y.-W., Woo J.-H., Park J.-H., Demarque P., & Oemler A. 1999, ApJ, 513, 128