A SCUBA Galaxy in the Protocluster around 53W002 at
Abstract
We analyse an 850-m SCUBA map of the environment of the radio galaxy 53W002, which has been shown to reside in an over-density of Ly-detected galaxies. We identify four luminous submillimeter (submm) sources within a 2.3′ (1.2 Mpc at ) diameter area around the radio galaxy (which itself is a weak submm source). We employ a 1.4-GHz map to accurately locate the counterpart of one of these sources, SMM J17142+5016, and identify this source with a narrow-line AGN with an extended Ly halo at which is member of the structure around 53W002. Hence SMM J17142+5016 is the first spectroscopically-confirmed, submm-selected companion to a high-redshift radio galaxy. We discuss the OHS spectrum of this galaxy and in addition present five new constraints on its spectral energy distribution long-ward of 1 m, using these to estimate its bolometric luminosity as L⊙, or a star formation rate of M⊙ yr-1 if young stars provide the bulk of the luminosity. This result provides direct support for the statistical detection of over-densities of SCUBA galaxies around high-redshift radio galaxies and confirms theoretical predictions that SCUBA galaxies, as the progenitors of massive ellipticals, should be strongly clustered in the highest density regions of the distant Universe.
Subject headings:
cosmology: observations — galaxies: individual (SMM J17142+5016) — galaxies: evolution — galaxies: formation1. Introduction
The extreme luminosities exhibited by the dusty galaxy population which contributes the bulk of the extragalactic background in the far-infrared and submm has emphasized the importance of dust-obscured activity in the early evolution of massive galaxies and black holes (Blain et al. 1999a; Cowie et al. 2002). The majority of the dusty, active systems detected by SCUBA appear to lie at , their typical bolometric luminosities are –1013 L⊙ and their space densities are Mpc-3, 2–3 orders of magnitude higher than similar luminosity galaxies at , indicating strong evolution of this population (Smail, Ivison & Blain 1997; Lilly et al. 1999; Blain et al. 1999b; Cowie et al. 2002; Chapman et al. 2002b). However, little is known about the types of environment which these galaxies inhabit. Similar luminosity, dusty systems in the local Universe are typically found in low-density regions and they avoid the dense cores of rich clusters of galaxies (Tacconi et al. 2002). The situation is expected to be very different at high redshifts where, if they truly represent the progenitors of massive ellipticals, the SCUBA galaxies should be clustered around the highest density regions which will subsequently evolve into the cores of rich clusters at the present-day (Ivison et al. 2000b, I00b).
Due to the small samples available in the submm waveband observational evidence of this clustering is tentative at the present-time (Scott et al. 2002; Webb et al. 2002). Nevertheless, there are suggestions that SCUBA galaxies are strongly clustered, in particular associations of SCUBA galaxies with other classes of clustered high-redshift sources, such as Lyman-break galaxies or X-ray sources, have been serendipitously found (Chapman et al. 2001; Ledlow et al. 2002; Almaini et al. 2002). A more direct approach to tackle this question has been undertaken by I00b in a targeted survey of regions around high-redshift, powerful AGN. These are expected to preferentially inhabit high-density regions in the early Universe (e.g. West 1994), a prediction which has some observational support from the discovery of excesses of both Extremely Red Objects and Ly emitters around some high-redshift radio galaxies (e.g. Aragón-Salamanca et al. 1994; Lacy & Rawlings 1996; Pascarelle et al. 1996a; Yamada et al. 1997; Keel et al. 1999; Venemans et al. 2002). The first results from the I00b survey show a significant over-density of SCUBA galaxies around the signpost high-redshift AGN, but confirming this association with redshifts for the SCUBA sources is very demanding.
One of the fields covered in the I00b survey is that surrounding the steep-spectrum, narrow-line radio galaxy 53W002 (Windhorst et al. 1991, 1998). This region is especially interesting as it has been shown to contain an over-density of compact, Ly emission-line galaxies at (Pascarelle et al. 1996a, P96a, 1998, P98; Keel et al. 1999, K99). Nine of these emission-line galaxies have been spectroscopically confirmed as companions to the radio galaxy, with a velocity dispersion of km s-1 and a spatial extent of Mpc (K99). In this paper we report on the SCUBA observations of the 53W002 field which uncover four luminous, submm galaxies. By matching the submm source position using an astrometrically-precise 1.4-GHz map we show that one of these sources is coincident with a Ly-selected galaxy at , confirming the presence of ultraluminous, dusty galaxies in the over-dense structure around 53W002 at a look-back time of 11 Gyrs (we adopt a cosmology with , and H km s-1 Mpc-1).
We discuss new and archival observations of the 53W002 field in the next section, present our analysis and results in §3, discuss these in §4 and give our conclusions in §5.
2. Observations and Reduction
2.1. Submm Mapping
We observed a -diameter field centered on 53W002 at 450- and 850-m during 2001 March 3–6 using the SCUBA bolometer array (Holland et al. 1999) on the James Clerk Maxwell Telescope (JCMT)555The JCMT is operated by the Joint Astronomy Centre on behalf of the United Kingdom Particle Physics and Astronomy Research Council (PPARC), the Netherlands Organisation for Scientific Research, and the National Research Council of Canada.. The conditions were good and stable for the four nights when data were taken, with an 850-m opacity measured every hour of 0.12–0.23 for the first three nights, rising to 0.35 on the final night. Flux calibration used beam maps of Mars and the nightly calibration factors were consistent at the 5% level (r.m.s.) at 850 m.
To map the field, the secondary mirror followed a jiggle pattern designed to fully sample the image plane, chopping East-West by 30′′ at 7 Hz whilst the telescope nodded between the same positions every 16 s in an on–off–off–on pattern. The total exposure time was 33.3 ks. The 450- and 850-m maps were created using surf (Jenness & Lightfoot 1997). In order to extract reliable source positions and flux densities, the maps were deconvolved using the symmetric zero-flux beam (which arises from chopping and nodding) and a modified version of the clean algorithm (Högbom 1974) as described by I00b. This process produces a restored map at the native resolution of the JCMT, 14′′ FWHM, but without the negative side-lobes from the chopping of bright sources.

2.2. Radio Mapping
The radio map of the 53W002 field from the National Radio Astronomy Observatory’s (NRAO) Very Large Array (VLA),666NRAO is operated by Associated Universities Inc., under a cooperative agreement with the National Science Foundation. is dominated by the 50-mJy central radio source (Windhorst et al. 1991, 1998) and seven bright, nearby sources. The presence of these bright sources makes self-calibration of the radio data trivial, but ultimately limits the dynamic range of the map in the vicinity of the radio source.
For these observations we employed B configuration, obtaining a total of 10.8 ks of useful integration on the 53W002 field during 2001 May 14 and May 17. We scanned the amplitude/phase calibrator, 1725+455, every hour and the flux scale was tied to 0137+331. To ameliorate the effects of band-width smearing the data were taken and reduced in pseudo-continuum, spectral-line mode, using 28 3.25-MHz dual-polarization channels centered at 1.4 GHz, with data recorded every 5 s. After editing and standard calibration of the data (and their associated weights), using aips, the imagr task was used to map a field, with simultaneous imaging of 16 bright nearby sources identified from the NRAO VLA Sky Survey (NVSS, Condon et al. 1998). Using these maps, made with robust = 0 weighting of the visibilities, clean boxes were positioned around obvious sources, and imagr was re-run with 5,000 iterations of the clean algorithm (Högbom 1974). The resulting clean components were then used as a model for self calibration (in phase only). The mapping was repeated, after checks on the clean boxes, followed by a further self-calibration step to produce the final map. After correction for the primary beam response of the VLA antennas using pbcor, the resulting map has a noise level of 30 Jy beam-1, with a beam.
2.3. Optical and Near-infrared Imaging
Our analysis also exploits archival Hubble Space Telescope (HST) imaging of the 53W002 field in both the optical (WFPC2) and near-infrared (NICMOS). We retrieved re-calibrated and reduced WFPC2 imaging of the field from the HST archive at ST-ECF777Based on observations made with the Hubble Space Telescope obtained from the ESO/ST-ECF Science Archive Facility., comprising three broad-band exposures: 57.6 ks in F450W (), 27.2 ks in F606W () and 20.4 ks in F814W (), as well as a 40.5-ks exposure in the F410M medium band. The latter filter serves to isolate the Ly emission line at . More information on these data is given in P96a and P98.
The acquisition and reduction of the NICMOS imaging of this field, in the F110W () and F160W () filters, are described in detail by Keel et al. (2002, K02). A total of 2.4-ks integration was obtained in each filter on two fields around 53W002 using the NIC3 camera during the special NIC3 campaign in January 1999. These observations have a resolution of 0.2′′ FWHM and 3- point-source sensitivities of and .
While the NICMOS images have exquisite resolution, they cover only a small proportion of the SCUBA map and so we have also obtained wider-field -band imaging covering the full map. These data were taken with the INGRID near-infrared imager (Packham et al. 2002) on the 4.2-m William Herschel Telescope (WHT)888Based on observations made with the William Herschel Telescope operated on the island of La Palma by the Isaac Newton Group in the Spanish Observatorio del Roque de los Muchachos of the Instituto de Astrofisica de Canarias.. Our observations were obtained on the night of 2001 May 10 and consist of a total of 4.3 ks integration in the filter in photometric conditions and seeing. The reduction and calibration of these data uses the pipeline described in Gilbank et al. (2002).
2.4. Near-infrared Spectroscopy
Near-infrared spectroscopy of several galaxies in the field of 53W002, in particular object #18, was obtained by Motohara et al. (2001a,b). These observations used the newly commissioned OH-airglow Suppression Spectrograph (OHS; Iwamuro et al. 2001) and Cooled Infrared Spectrograph and Camera for OHS, CISCO (Motohara et al. 2002) on the 8.2-m Subaru Telescope.999Based on data collected at Subaru Telescope, which is operated by the National Astronomical Observatory of Japan. More details of the observations are given in Motohara et al. (2001b). The spectra cover the bands in two configurations, in both instances the slit was placed at a PA of 35 degrees and centered on the redder, southern component in the galaxy (Fig. 1).
The -band spectrum of #18 was obtained on the night of 1999 May 21, using OHS in the light path in front of CISCO to suppress the atmospheric OH emission. A total of 8 ks of data was acquired in seeing as a series of 1 ks exposures, with the nods along the slit between exposures. Using a -wide slit the resolution was in the middle of the -band. Atmospheric transmission corrections came from observations of SAO 30245 and wavelength calibration was obtained from the OH lines measured in observations without OHS. Checks of the instrument stability suggest that this calibration is good to Å.
The -band spectroscopy was obtained on 1999 May 3–4 with just CISCO, at the Cassegrain focus, in seeing and non-photometric conditions. The slit resulted in a resolution of at m. A total of 4.8 ks of integration in s exposures was obtained, nodding the telescope by after every 6 exposures to allow for sky subtraction. Calibration of the atmospheric transmission came from observations of SAO 30082 taken immediately before the science frames on 1999 May 4 and wavelength calibration used the sky lines.
The spectroscopic data were reduced in a standard manner, including flat-fielding, sky subtraction, correction of bad pixels and residual sky subtraction. The spectra of the SAO stars were used to correct for atmospheric extinction. As the seeing was smaller than the slit width for both observations we adopt a quarter of the slit width as our estimate of the absolute calibration error on our wavelength scale. This amounts to 22 Å in the -band spectrum and 13 Å in the -band. The spectra were flux calibrated using the broad-band photometry of the source from Yamada et al. (2001) and Motohara et al. (2001b). A aperture, aligned with the slit was used in both cases. The final spectrum covering the bands is shown in Figure 2 and an initial analysis of this spectrum is described in Motohara et al. (2001a).
3. Analysis and Results
We detect four significant sources in the 850-m SCUBA map of the 53W002 field above a 4- limit of 3.7 mJy, this represents a modest excess over the blank-field expectation of 2 sources at this flux limit.101010We also detect emission from 53W002 at lower significance, with an 850-m flux of mJy, consistent with the 3- upper limit of mJy from Hughes & Dunlop (1998). Unfortunately, the large JCMT beam means that it is impossible to reliably locate the source of this submm emission. However, by exploiting the smaller beam and better absolute astrometric precision of our VLA map we can provide a more accurate position for any submm source detected at 1.4 GHz. These positions can then be compared to our near-infrared images, with a precision of , to search for optical/near-infrared counterparts.
Only one of the submm sources is detectable at 1.4-GHz (in addition to 53W002) which we denote as SMM J17142+5016, with a nominal position from the 850-m map of 17 14 12.18 , +50 16 02.8 (J2000). This galaxy has an 850-m flux of mJy and a 3- limit on the 450-m flux of 30 mJy. It lies 1.3′′ from a Jy radio source (at 17 14 12.040 , +50 16 02.92 ) in the 1.4-GHz map. This radio source is also detected at 8.4-GHz with a flux of Jy (Fomalont et al. 2002), indicating a spectral slope of . Using the positions of other radio sources in the INGRID field we place the radio source within of an optical galaxy (nominally at 17 14 11.99, +50 16 02.1), identified as #18 in P96a. We conclude that #18 is the likely counterpart to SMM J17142+5016 and in the following discussion we identify the galaxy as SMM J17142+5016/#18.
3.1. SMM J17142+5016/#18
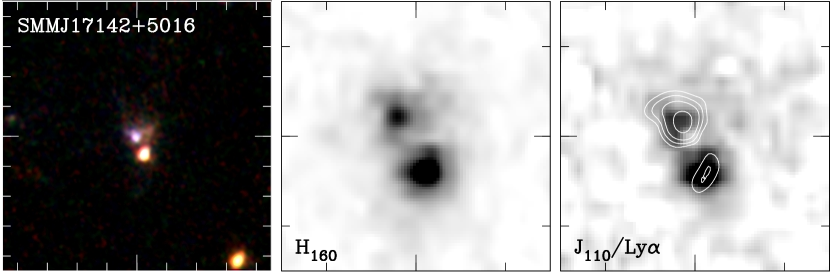
SMM J17142+5016/#18, is one of the brightest of the Ly emission-line sources detected at in a narrow-band imaging search around 53W002 (P96a; Pascarelle et al. 1996b; P98; K99; K02; Yamada et al. 2001; Motohara et al. 2001a,b). We summarize some of the relevant, published information on this galaxy here: the HST imaging of SMM J17142+5016/#18 shows that it is distinguished by its large angular size, , in contrast to the typically unresolved light profiles of the majority of the Ly emitters in this region (P96a). SMM J17142+5016/#18 consists of pair of components separated by 0.6′′ (4.7 Kpc at ), see Fig. 1. The north-eastern component has bluer colors and a more extended light profile than the southern component (whose intrinsic FWHM is only 0.25′′ in the -band, indicating a half-light radius of just 1 kpc at ). The restframe UV spectrum published by P96a shows a strong, but relatively narrow Ly line, weak Civ 1549 and possibly Nv 1239, confirming its redshift as . In conjunction with the preliminary analysis of the OHS near-infrared spectrum of this galaxy by Motohara et al. (2001a), the spectral properties are very similar to those of a Seyfert-2. Deeper, ground-based Ly imaging of this galaxy by K99 shows that it also possess a very extended Ly halo, kpc.
Spectral Properties of SMM J17142+5016/#18
| Line | Flux | Comments | |||
| (Å) | (Å) | ( W m-2) | |||
| Ly | 4124.9 | 1215.7 | 2.393 | 4.7 | K02 |
| [Oii] | 12651.5 | 3727.4 | 2.394 | ||
| H | 16487.3 | 4861.3 | 2.392 | ||
| [Oiii] | 16817.1 | 4959.0 | 2.391 | ||
| [Oiii] | 16975.6 | 5006.9 | 2.390 | ||
| H | 22260.1 | 6562.8 | 2.392 | Blended with [Nii] | |
| 22248.9 | 6562.8 | 2.390 | Deblended |
| a Systematic uncertainties in the redshifts from the wavelength calibration |
| are 0.004 for the -band spectra and 0.002 for the -band lines. |
3.2. Morphology
Turning now to the new data presented in this paper, we note that the morphology of SMM J17142+5016/#18, showing two components separated by and extended emission, is remarkably similar to that of other optically-bright SCUBA galaxies, SMM J023990136 (a narrow-line, BAL QSO at , Ivison et al. 1998), SMM J14011+0252 (a star-burst galaxy at , Ivison et al. 2000a, 2001) and Westphal-MMD11 (a submm-bright Lyman break galaxy at , Chapman et al. 2002a). All of these very luminous SCUBA galaxies also exhibit multiple components, apparent tidal features and complex emission-line structures on scales of kpc. We compare the spatial distribution of the high-surface brightness Ly emission (from the F410M image) and UV continuum (given by the -band, although this includes a small contribution from [Oii] 3727, Fig. 2) in the right-hand panel of Fig. 1. This shows that a large fraction of the Ly emission from the system arises in the northern component, even though the underlying continuum in this feature is weak. This component may therefore represent either lower-mass companion, tidal debris or scattered light from an obscured AGN. Unfortunately the precision of the relative astrometry between our radio and near-infrared images precludes us more precisely locating the source of the radio (and hence submm) emission in this system (c.f. Ivison et al. 2001).
3.3. Restframe UV/optical spectral properties
We identify a number of strong emission lines in the OHS spectrum of SMM J17142+5016/#18 in Fig. 2, including H, H, [Oii] 3727, [Oiii] 4959, 5007, the signature of [N ii] 6583 blended with H and perhaps [S ii] 6731. The emission-line properties are listed in Table 1. The redshift for SMM J7142+5016/#18 is from the H line, compared to from the peak of the Ly line (P96a). This small offset may indicate the presence of absorption in the blue wing of Ly line, which would have been missed in the low signal to noise spectrum shown in P96a. The small differences between redshifts from different lines in the JH- and -bands are within the calibration uncertainties of the observations.
The OHS spectra show that the H and [Oiii] emission is extended by 1–2′′ along the slit to the North-West from the compact, southern component. In addition the [Oiii] 5007 line shows a velocity gradient of 200–300 km s-1 across this extension. The relatively low resolution of the OHS observations means that, apart from the spatial velocity gradient, none of the emission lines are resolved, with limits of km s-1 for lines in the JH-band and km s-1 for those in the -band. As an aside, we note that the galaxy lies outside the sensitive area of the CO line searches around 53W002 and so no useful dynamical information is currently available (Scoville et al. 1997; Alloin et al. 2000).
The H+[Nii] flux measured from the OHS spectrum is W m-2. This compares to W m-2 from the narrow-band imaging of K02, further strengthening the claim of a significant, spatially extended component to this line emission, but also underlining the difficulty of extracting reliable line-ratio estimates from the different published long-slit measurements. We estimate the contribution from the blended [Nii] 6583 line to the H in the long-slit spectrum by fitting a model with two Gaussian profiles, assuming both lines have the same FWHM, to the data. We derive a line ratio of [N ii] 6583/H, similar to that seen in normal star-forming galaxies. However, the low signal to noise of the H flux measurement precludes any detailed analysis of the reddening in this system.
The broad-band colors of the SMM J17142+5016/#18 listed in K02 appear unusual, being blue short-ward of 2500Å in the restframe, , and comparatively red long-ward of this, (K02; Yamada et al. 2001). The cause of this apparent reddening of the SED is the large contribution to broad-band fluxes from red-shifted Ly and optical emission lines (Fig. 2). These contributions amount to 25% of the light in the -band (Ly), 10% of the -band flux ([Oii 3727), 45% in the -band (H, [Oiii] 4959,5007) and 30% in the -band (H, [Nii]). Correcting for this line emission we estimate the colors of the underlying continuum as: , , and . These colors are similar to those expected for a young stellar population at , although the absence of strong stellar absorption features in the restframe UV spectra (P96a; Keel priv. comm.) suggests that there is a significant AGN contribution to the UV emission.
The restframe optical emission line ratios measured from the OHS spectrum of SMM J17142+5016/#18 also suggest the presence of an AGN. Motohara et al. (2001a) discuss the flux ratios for this galaxy on diagnostic diagrams for [Oiii] 5007/H, [Oii] 3727/[Oiii] 5007 and [N ii] 6583/H. They conclude that the system has emission line ratios similar to those seen in Seyfert-2’s, although a low-metallicity star-burst is also possible.
![[Uncaptioned image]](/html/astro-ph/0210183/assets/x3.png)
Fig. 3 — A comparison of the SED of SMM J17142+5016/#18 with a range of well-studied, luminous dusty galaxies at low and high redshifts. The SED appears to very similar to SMM J09431+4700, an ultraluminous, narrow-line Seyfert-1 at (Ledlow et al. 2002), or a lower luminosity analog of SMM J023990136 (Ivison et al. 1998). The restframe optical/UV photometry of SMM J17142+5016/#18 comes from K02 and we include a 3- upper limit on the 7 m emission from the galaxy based on ISO observations (Keel, priv. comm.).
3.4. Far-infrared/radio properties
In Fig. 3 we compare the spectral energy distribution (SED) of SMM J17142+5016/#18 to well-studied SCUBA galaxies and other dusty, luminous galaxies. The galaxy’s SED is typical of ultraluminous infrared galaxies and shows strong similarities to the SCUBA-selected narrow-line Seyfert-1 SMM J09431+4700 (Ledlow et al. 2002). Taking the 850-m flux of SMM J17142+5016 and assuming a dust spectrum with K and , we estimate a dust mass of M⊙, and a bolometric luminosity of L⊙, this translates into a star formation rate for M⊙ stars of M⊙ yr-1 (Condon 1992), or M⊙ yr-1 accounting for stars with masses of M⊙ using a Salpeter IMF.
We can also estimate the star formation rate in SMM J17142+5016 from the H flux (Table 1; K02), this indicates an H luminosity of 0.3– W, suggesting a star formation rate in the range – M⊙ yr-1 (Kennicutt 1983; Barbaro & Poggianti 1997). The contribution from any AGN-powered component of the line will bring this estimate down. Nevertheless, these measurements are far in excess of the estimated star formation rate based on the UV luminosity of M⊙ yr-1 (not accounting for any AGN contribution, P96a), indicating a dust-incurred deficit in the UV luminosity which was already noted as a possible cause of the high Ly equivalent width (K02; see also Taniguchi & Shioya 2001).
The radio counterpart to SMM J17412+5016 is unresolved at both 1.4- and 8.4-GHz, which place limits on its FWHM of , or kpc at . Using the 1.4-GHz and submm fluxes we can also estimate the radio-submm spectral index, (Carilli & Yun 1999, 2000), at , which predicts based on the Carilli & Yun (2000) models. This is at odds with the spectroscopic redshift of (Table 1) and suggests that there is an additional contribution to the 1.4-GHz emission from the AGN (as also indicated by the steep radio spectrum at high frequencies). It will be important to place a precise limit on the bolometric luminosity of the AGN using the Chandra X-ray observations of this field and so constrain the relative contribution from the AGN and star formation to the dust emission from this galaxy (Bautz et al. 2000).
4. Discussion
The properties of the components of SMM J17142+5016/ #18 hint at a complex mix of AGN emission, star formation, dust obscuration and scattered radiation, which is difficult to unravel. Taking the southern component first: it is clear that this hosts an AGN, although there is also extended UV light detected from the host galaxy. Assuming the line ratios in the OHS spectrum (Fig. 2) are dominated by this component, then this source should be classified as a Seyfert-2. In contrast the north-eastern component shows weak continuum and very strong Ly emission (Fig. 1) suggesting it may be a lower-mass star-forming companion or tidal debris which is either locally ionized or illuminated by scattered light from the AGN. Support for the latter explanation comes from the apparent detection of Civ emission across this structure (K99; K02). A definitive conclusion about the nature of the north-eastern component awaits the publication of higher-quality, spatially resolved optical spectra of this structure.
Perhaps the most interesting feature of SMM J17142+5016/#18 is the extended Ly halo around this galaxy (K99; K02), which may also have been seen in H. This low-surface brightness feature is on a much larger scale than the high-surface brightness Ly emission in Fig. 1, extending out east from the galaxy at least (50 kpc). This extended Ly emission in the same direction as the extended [Oiii] 5007 line discussed earlier, with the velocity gradient then reflecting motion in the halo gas induced by a tidal interaction or a wind. The combination of strong submm emission and an extended Ly cloud is somewhat surprising, given the propensity for dust to absorb Ly photons, although it has been seen before (Chapman et al. 2001, 2002b). Taniguchi & Shioya (2001) have suggested that this phenomenon arises from an extended super-wind driven by a highly-obscured star-burst, the wind then shocks and ionizes the gas halo which surrounds the system. This model can explain several properties of these Ly halos (although other processes are also feasible, see Chapman et al. 2001 and Francis et al. 2001) and hence deserves continued investigation, in particular studying the kinematics of the extended Ly emission around SMM J17142+5016/#18 using an integral-field spectrograph on an 8-m class telescope to confirm the dynamical signatures of a super-wind.
Many of the characteristics of SMM J17142+5016/#18 are shared with other well-studied SCUBA galaxies (Ivison et al. 1998, 2000a): a disturbed morphology, an SED dominated by dust-reprocessed radiation, spectral signatures of a narrow-line AGN and extended Ly emission. The disturbed appearance of #18 sets it apart from the other (typically-compact) Ly-selected galaxies and AGN around 53W002, and suggests that, as in local ULIRGs, it is the tidal disturbance of the gas reservoir within the galaxy due to a gravitational interactions which is the root cause of the enhanced activity we see (Chapman et al. 2002a). Yamada et al. (2001) have argued that the Ly-selected galaxies around 53W002 have characteristics similar to those seen in the wider Lyman-break population, suggesting that perhaps on-going major mergers are the events which set SCUBA galaxies apart from the broader population of star-forming systems at high redshifts. However, the presence of multiple components on 5–20 kpc scales in % of the Lyman-break population (Lowenthal et al. 1997), along with the lack of significant submm emission from the majority of Lyman-break galaxies (Chapman et al. 2000), indicate that the picture is not that simple.
Although the exact trigger of the ultraluminous activity may be ambiguous, it is also true that the power source for this behavior is similarly difficult to identify. The presence of an AGN in SMM J17142+5016/#18 obviously provides the opportunity for some fraction of its far-infrared luminosity to come from AGN-heated dust but, as with ULIRGS, it is difficult to disentangle the contributions from star formation and AGN-heating to the overall SED. The existence of a large mass of dust, M⊙, suggests that massive star formation has occurred in this galaxy, while the lack of X-ray detections for the general SCUBA population (Almaini et al. 2002), along with the constraints on AGN luminosities from a few well-studied SCUBA galaxies (e.g. Frayer et al. 1998; Bautz et al. 2000) both hint that only rarely does the AGN completely dominate the bolometric output from typical, luminous submm-selected sources. Sensitive Chandra X-ray observations will help to resolve this issue for SMM J17142+5016/#18, while SIRTF mid-infrared observations will be key to disentangling the contributions from the AGN to the far-infrared emission from this galaxy. More generally, it is clear from the frequency of weak AGN in SCUBA galaxies that some of the gas from the large disturbed reservoirs in these systems does find its way onto the central black hole and given the easy availability of this fuel, the relatively modest luminosity AGNs which result may indicate that the black holes are of comparatively low mass (or suffer complex dust obscuration).
While the submm luminosity of SMM J17142+5016/#18 sets it apart from the typical Lyman break galaxy (Chapman et al. 2000), its relative brightness in the optical/near-infrared wavebands also distinguishes it from the other three submm sources in this field. All of these lack obvious counterparts to and are undetectable in our radio map, although they should be detected close to the 3- limit of our radio map if they follow the mean Carilli & Yun (2000) relation and lie at . Therefore, if these SCUBA galaxies inhabit the same structure as SMM J17142+5016/#18 they must have lower dust temperatures (this will decrease their radio/far-infrared flux ratios, making them fainter in the radio) and are also likely to be more obscured. We speculate that these characteristics could arise if these submm sources lack the AGN which is seen in SMM J17142+5016/#18. Alternatively, several (or all) of these sources could be unrelated to the structure around 53W002 and may lie at higher redshifts. Unfortunately the limits placed on the sensitivity of the radio map of this region by the presence of 53W002 means that improved radio positions for these other submm sources are unlikely to become available in the near future.
From the current census of star formation activity in the structure around 53W002 it appears that SMM J17142+5016/#18 may be the dominant contributor (at least compared to the Ly-selected population). We can thus estimate a crude lower limit to the star formation density in this region, taking the rate calculated above and assuming SMM J17142+5016/#18 is the only ultraluminous galaxy in the entire structure, which conservatively contains a volume of Mpc3 (K99), giving a star formation density of M⊙ yr-1 Mpc-3. Even allowing for a significant contribution from the AGN to the bolometric luminosity, this is still one to two orders of magnitude higher than the mean star formation density at this epoch (Smail et al. 2002). This is a higher contrast than the 2– over-density of Ly emitters in this region (several of which are also AGN, K99) and suggests that vigorous, obscured star formation may be enhanced in the protocluster environment.
Finally we note that the confirmation of a luminous SCUBA galaxy residing in a protocluster environment strengthens their associated with the formation phase of the massive ellipticals, which dominate rich clusters at the present-day. The identification of this SCUBA source adds an ultraluminous infrared galaxy to the diverse zoo of galaxies inhabiting this structure at , which now includes an ultraluminous narrow-line AGN, a powerful radio galaxy, two broad-line AGN and a large population of Ly-emitting galaxies. If these various types of activity are related through a single evolutionary cycle, then environments such as that studied here may provide the best insights into the details of their relationships.
5. Conclusions
We have identified the first, spectroscopically-confirmed SCUBA companion to a high-redshift radio galaxy. This is SMM J17142+5016/#18, which lies 330 kpc () and km s-1 offset in velocity from the steep-spectrum radio galaxy 53W002 at . The restframe optical morphology of this galaxy is strongly reminiscent of other well-studied SCUBA galaxies, showing merger/tidal features (Ivison et al. 1998, 2000a). We present an OHS near-infrared spectrum of this galaxy, which probes the restframe optical spectral properties, as well as a number of long-wavelength constraints on the form of its SED. These show that SMM J17142+5016/#18 is a radio-quiet, narrow-line AGN with a bolometric luminosity of L⊙ and an inferred star formation rate of M⊙ yr-1. The galaxy is also surrounded by an extended emission-line halo (seen in Ly and H). These halos are being uncovered in an increasing number of dusty, star-forming galaxies at high redshifts and may signify the presence of starburst-driven super-winds in these systems (Chapman et al. 2001, 2002b; Taniguchi & Shioya 2000). These intense winds and the strong radiation fields produced by this activity will have profound consequences for the evolution of any other galaxies in close proximity to the SCUBA galaxies.
References
- (1) Aragón-Salamanca A., Ellis R. S., Schwartzenberg J.-M., Bergeron J. A. 1994, ApJ, 421, 21
- (2) Alloin D., Barvainis R., Guilloteau S. 2000, ApJ, 528, L81
- (3) Almaini O., Scott S. E., Dunlop J. S., Manners J. C., Willott C. J., et al. 2002, MNRAS, submitted
- (4) Barbaro G., Poggianti B. M. 1997, A&A, 324, 490
- (5) Bautz M. W., et al. 2000, ApJ, 543, L119
- (6) Blain A. W., Kneib J.-P., Ivison R. J., Smail I., 1999a, ApJ, 512, L87
- (7) Blain A. W., Smail I., Ivison R. J., Kneib J.-P., 1999b, MNRAS, 302, 632
- (8) Carilli C. L., Yun M. S. 1999, ApJ, 513, L13
- (9) Carilli C. L., Yun M. S. 2000, ApJ, 530, 618
- (10) Chapman S. C., et al. 2000, MNRAS, 319, 318
- (11) Chapman S. C., Lewis G. F., Scott D., Richard E., et al. 2001, ApJ, 548, L17
- (12) Chapman S. C., Shapley A., Steidel C., Windhorst R. 2002a, 572, L1
- (13) Chapman S. C., Blain A. W., Ivison R. J., Smail I. 2002b, Nature, submitted
- (14) Condon J. J., 1992, ARAA, 30, 575
- (15) Condon J. J., Cotton W. D., Greisen E. W., Yin Q. F., Perly R. A., et al. 1998, AJ, 117, 361
- (16) Cowie L. L., Barger A. J., Kneib J.-P. 2002, AJ, 123, 2197
- (17) Fomalont E. B., Kellermann K. I., Partridge R. B., Windhorst R. A., Richards E. A. 2002, AJ, 123, 2402
- (18) Francis P. J., Williger G. M., Collins N. R., Palunas P., Malmuth E. M., et al. 2001, ApJ, 554, 1001
- (19) Frayer D. T., et al. 1998, ApJL, 506, L7
- (20) Gilbank D. G., Smail I., Ivison R. J., Packham C., 2002, MNRAS, in prep
- (21) Högbom J. A., 1974, A&AS, 15, 417
- (22) Holland W. S., Robson E. I., Gear W. K., Cunningham C. R., Lightfoot J. F., Jenness T., et al., 1999, MNRAS, 303, 659
- (23) Hughes D. H., Dunlop J. S., 1998, in Highly Redshifted Radio Lines, eds. Carilli C., Radford S., Menten K., Langston G., ASP Conf. Ser. 156 (ASP: San Fransisco) p. 99
- (24) Ivison R. J., Smail I., Le Borgne J.-F., Blain A. W., Kneib J.-P., Bézecourt J., Kerr T. H., Davies J. K. 1998, MNRAS, 298, 583
- (25) Ivison R. J., Smail I., Barger A., Kneib J.-P., Blain A. W., Owen F. N., Kerr T. H., Cowie L. L. 2000a, MNRAS, 315, 209
- (26) Ivison R. J., Dunlop J. S., Smail I., Dey A., Graham J. R., Liu M. C. 2000b, ApJ, 542, 271 [I00b]
- (27) Ivison R. J., Smail I., Frayer D. T., Kneib J.-P., Blain A. W. 2001, ApJL, 561, L45
- (28) Iwamuro F., Motohara K., Maihara T., Hata R., Harashima T. 2001, PASJ, 53, 355
- (29) Jenness T., Lightfoot J. F. 1997 in: Astronomical Data Analysis Software and Systems VII, eds Albrecht, R., et al. ASP Conf. Ser. 145, (San Francisco: ASP), p. 216
- (30) Keel W. C., Cohen S. H., Windhorst R. A., Waddington I. 1999, AJ, 118, 2547 [K99]
- (31) Keel W. C., Wu W., Waddington I., Windhorst R. A., Pascarelle S. M. 2002, AJ, 123, 3041 [K02]
- (32) Kennicutt R. C. Jr, 1983, ApJ, 272, 54
- (33) Lacy M. Rawlings S., 1996, MNRAS, 280, 888
- (34) Ledlow M., Smail I., Owen F. N., Keel W. C., Ivison R. J., Morrison G. E. 2002, ApJ, 577, L79
- (35) Lilly S. J., Eales S. A., Gear W., Hammer F., Le Fevre O., et al. 1999, ApJ, 518, 641
- (36) Lowenthal J. D., Koo D. C., Guzmán R., Gallego J., Phillips A. C., et al. 1997, ApJ, 481, 673
- (37) Motohara K., Yamada T., Iwamuro F., Maihara T., 2001a, in Astrophysical Ages and Timescales, eds von Hippel T., Simpson C., Manset N., ASP Conf. Ser. 245 (San Francisco: ASP), p. 634
- (38) Motohara K., Yamada T., Iwamuro F., Hata R., et al. 2001b, PASJ, 53, 459
- (39) Motohara K., Iwamuro F., Maihara T., Oya S., Tsukamoto H., et al. 2002, PASJ, 54, 315
- (40) Packham C., et al. 2002, MNRAS, submitted
- (41) Pascarelle S. M., Windhorst R. A., Driver S. P., Ostrander E. J., Keel W. C. 1996, ApJ, 456, L21 [P96a]
- (42) Pascarelle S. M., Windhorst R. A., Keel W. C., Odewahn S. C. 1996b, Nature, 383, 45
- (43) Pascarelle S. M., Windhorst R. A., Keel W. C. 1998, AJ, 116, 2659 [P98]
- (44) Scott S. E., Fox M. J., Dunlop J. S., Serjeant S., Peacock J. A., et al. 2002, MNRAS, 331, 817
- (45) Scoville N. Z., Yun M. S., Windhorst R. A., Keel W. C., Armus L. 1997, ApJ, 485, L21
- (46) Smail I., Ivison R. J., Blain A. W., 1997, ApJ, 490, L5
- (47) Smail I., Ivison R. J., Blain A. W., Kneib J.-P. 2002, MNRAS, 331, 495
- (48) Tacconi L. J., Genzel R., Lutz D., Rigopoulou D., Baker A. J., Iserlohe C., Tecza M. 2002, ApJ, in press
- (49) Taniguchi Y., Shioya Y., 2000, ApJ, 532, L13
- (50) Venemans B. P., Kurk J. D., Miley G. K., et al. 2002, ApJL, 569, L11
- (51) Webb T., et al. 2002, ApJ, submitted
- (52) West M. J. 1994, MNRAS, 268, 79
- (53) Windhorst R. A., Burstein D., Mathis D. F., Neuschaefer L. W., Bertola F., Buson L. M., et al. 1991, ApJ, 380, 362
- (54) Windhorst R. A., Keel W. C., Pascarelle S. M., 1998, ApJ, 494, L27
- (55) Yamada T., et al. 1997, ApJ, 487, L125
- (56) Yamada T., et al. 2001, PASJ, 53, 1119