What does the Unexpected Detection of Water Vapor in Arcturus’ Atmosphere Tell us?
Abstract
In this talk I presented and discussed our unexpected detection of water vapor in the disk-averaged spectrum of the K2IIIp red giant Arcturus [for details, see Ryde et al. (2002)]. Arcturus, or Boötes is, with its effective temperature of K, the hottest star yet to show water vapor features. We argue that the water vapor is photospheric and that its detection provides us with new insights into the outer parts of the photosphere. We are not able to model the vater vapor with a standard, one-component, 1D, radiative-equilibrium, LTE model photosphere, which probably means we are lacking essential physics in such models. However, we are able to model several OH lines of different excitation and the water-vapor lines satisfactorily after lowering the temperature structure of the very outer parts of the photosphere at and beyond compared to a flux-constant, hydrostatic, standard marcs model photosphere. Our new semi-empirical model is consistently calculated from the given temperature structure. I will discuss some possible reasons for a temperature decrease in the outer-most parts of the photosphere and the assumed break-down of the assumptions made in classical model-atmosphere codes. In order to understand the outer photospheres of these objects properly, we will, most likely, need 3D hydrodynamical models of red giants also taking into account full non-LTE and including time-dependent effects of, for example, acoustic wave heating sensitive to thermal instabilities.
McDonald Observatory and Department of
Astronomy
The University of Texas at Austin
RLM 15.308
Austin,
TX 78712
Department of Physics
The University of California, Davis
Davis, CA 95616
McDonald Observatory and Department of Astronomy
The
University of Texas at Austin
RLM 15.308
Austin, TX 78712
1. OBSERVATIONS
The data we analysed were obtained with the TEXES (Texas Echelon Cross-echelle Spectrograph; see Lacy et al. 2002) mounted on the NASA InfraRed Telescope Facility on Mauna Kea. TEXES is capable of recording truly unique mid-infrared spectra. We used the spectrograph in its high-resolution mode, with covering the regions 806-822 cm-1 (12.2-12.4 m) and 884-925 cm-1 (10.8-11.3 m). TEXES is actually a prototype for the EXES spectrometer, which is a PI instrument to be used on the American-German Stratospheric Observatory for Infrared Astronomy (SOFIA) which is scheduled to fly in 2004. One of the largest advantages of flying an observatory above the tropopause at an altitude of 12-14 km compared to a ground-based one, is the smaller interference of telluric water vapor which absorbes heavily in the thermal infrared. SOFIA will be flying above 99% of the telluric water vapor. EXES has a 1 meter long echelon grating and TEXES has a 90 cm grating. The detectors are Si:As pixels detectors, which are sensitive to mid-infrared light from ca. 4.5 to 28.5 microns.
2. MODELLING
We identified the unexpected absorption features in the mid-infrared spectrum of Arcturus as water vapor and OH lines by comparing with sun-spot spectra. Since there does not exist any water-vapor line-lists with wavelengths accurate enough for our high-resolution work, we constructed a new one with wavelengths from recent laboratory measurements by Polyansky et al. (1996, 1997a, & 1997b). The lines studied here are pure rotational transitions of OH of the three first vibrational levels and pure rotational transition of water within the ground vibrational state. Vibration-rotation lines of water vapor lie in the near to mid infrared region and electronic transitions in the UV.
We model our observations with the marcs model atmosphere code. These 1D hydrostatic, spherical model photospheres are computed on the assumptions of Local Thermodynamic Equilibrium (LTE), homogeneity and the conservation of the total flux (radiative plus convective; the convective flux being computed using the mixing length formulation). The radiative field used in the model generation, is calculated with absorption from atoms and molecules by opacity sampling in approximately 84 000 wavelength points over the entire, relevant wavelength range considered for the star (–). The fundamental parameters for our standard model are K, (cgs), [Fe/H], and km s-1, and use the abundances of carbon, nitrogen, and oxygen given by Decin et al. (1997). Synthetic spectra are subsequently calculated.
The overall spectral shape of a red giant as warm as Arcturus is primarily determined by continuous opacities and metals, but also by a small contribution of CO. Water vapor is, for example, not expected in the spectrum of Arcturus. This is in stark contrast to cooler giants where molecules (such as TiO, VO, H2O, OH, CO, and SiO) are totally dominant, the metals only playing a minor role. The main continuous opacity source in the optical is due to H, i.e. ionization and recombination of the H--ion. Further out in the infrared, H opacity (i.e. bremsstrahlung and absorption by an electron in the field of a neutral hydrogen atom) is most important. This opacity source grows with wavelength and dominates beyond 1.6 microns. At 1.6 m there is a minimum in the opacity, which means that the continuum at 1.6 microns is formed relatively far down in the photosphere. As we go further out in the infrared the continuum is formed successively further up in the photosphere. We therefore expect also mid-infrared lines to be formed further out than lines at, say, 1.6 microns.
3. PROCEDURE
We start off by testing our model photosphere and the stellar parameters used by calculating a synthetic spectrum of the 1.6 micron region, and confronting it with the observed, high-resolution, high-signal-to-noise spectrum found in the Arcturus Atlas (Hinkle et al. 1995). The OH first overtone lines found in this region are, as was noted above, formed at a deep level in the photosphere where the model assumptions are certainly valid. We are able to model the OH lines well and are thus confident that our parameters are correct.
Next, we turn our attention to the 12 micron region to study the pure rotational lines. The continuum is formed further out at these wavelengths and the cores of moderately strong lines could be formed in shallow layers in the atmosphere where the model assumptions may be erroneous. We find that the OH() and OH() lines can be modelled well. However, the model cannot account for the deep cores of the OH() lines. Furthermore, the model does not predict any water lines at all, which is a large fallacy.
Since we are working with high-resolution data, our lines are resolved, thus providing kinematic information. Based on this piece of information, the line widths, and the excitation temperatures of the lines, we argue that all the lines are formed within the photosphere, and not above the photosphere, for example in a circumstellar envelope (see Ryde et al. 2002).
We therefore construct a semi-empirical model-atmosphere based on our marcs model, by adjusting the temperature profile in the outer most, uncertain, layers of the model photosphere. The model now violates the condition of flux constancy imposed on marcs models. Electron and gas pressures were recalculated assuming hydrostatic equilibrium. The density and standard opacity are also consistently recalculated from this new temperature structure, as are the ionization balance, molecular equilibria, and opacities. New synthetic spectra were calculated assuming, as before, LTE for the molecular equilibrium and the line formation. The revisions to the upper boundary layer made by us were made solely with the aim of fitting observed line profiles.
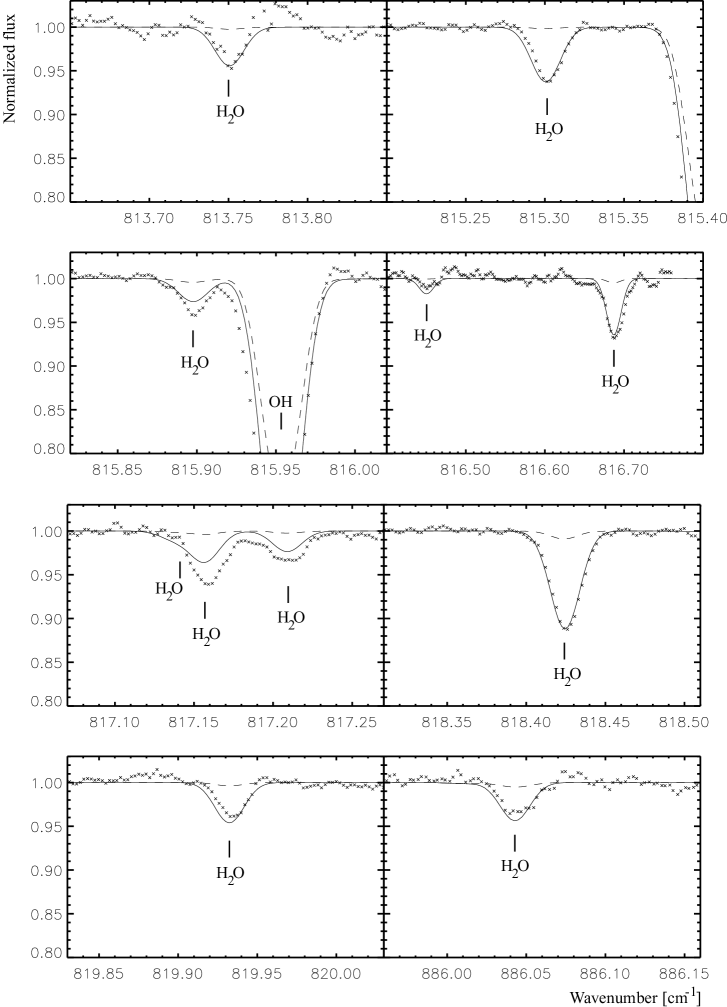
We are successful in finding a semi-empirical model that predicts the strengths of all the OH lines, the water vapor lines, and also the CO vibration-rotation, 4.6 micron lines, the cores of which are also formed far up in the photosphere. Over most of the modified region, the temperatures are a mere 300 K cooler than the original marcs model. In Figure 1 a few water vapor lines are shown together with the synthetic spectrum based on the original marcs atmosphere and the spectrum based on the semi-empirical model photosphere.
4. DISCUSSION
What could cause the detected stellar steam in the disk-averaged spectrum of this K2 giant? The outer layers of the atmosphere seem to be more complicated than the simple assumptions made in our models. What Physics are we missing? We will now discuss a few points related to this.
First, relaxation of the assumptions behind the marcs models may change the atmospheric structure. Even small alterations of the heating or cooling terms in the energy equation (for example due to dynamic processes or uncertainties and errors in the calculations of radiative cooling) may lead to changes in the temperature structure in the outer, tenuous regions of the photosphere where the heat capacity per volume is low. The assumption of LTE is one target of model builders seeking to go beyond the standard assumptions. Atomic – continuous and line – opacity was treated in non-LTE using large model atoms by Short (2002) in spherical geometry, hydrostatic equilibrium, and flux constancy. Introduction of non-LTE in place of LTE lowered the boundary temperature by an amount quite similar to our empirical cooling of the marcs model. This suggests that non-LTE effects in atoms may suffice to account for the surprising presence of H2O molecules in the photosphere.
Second, there are certainly inhomogeneities over the surface of the star. A key assumption made in construction and application of the model atmosphere is that physical conditions are everywhere the same at a given geometrical depth. Such a model is said to be ‘homogeneous’. Arcturus, with its deep convective envelope, is certain to be inhomogeneous; it is likely to exhibit surface granulation which may be crudely characterized as consisting of columns of warm rising and cool sinking gas. The continuum intensity contrast in the mid-infrared will be small. There will, however, most likely be a sharp difference in the H2O column density with the sinking column much richer in the molecules, and, as a result, the surface-averaged spectrum will show stronger H2O lines than the spectrum of the equivalent homogeneous model atmosphere. Unfortunately, inhomogeneous model atmospheres of giant stars are unavailable. Yet, the modest 300 K cooling imposed on the marcs model is surely within the range of temperature differences between rising and sinking granules.
An alternative mechanism for producing inhomogeneities is variously known as ‘a molecular catastrophe’ or ‘temperature bifurcation’. In warm stars, the CO molecular opacity influences the temperature profile predicted by a program like marcs. If the temperature of gas in the boundary layer is perturbed, there may be a runaway to one of two different solutions. Suppose the gas is cooled, more CO molecules form and increase the cooling of the boundary layer. The temperature drop leads to yet more CO molecules and to a runaway to a ‘cool’ boundary layer. Conversely, if the perturbation raises the temperature, CO molecules are dissociated, the cooling rate decreased, and the temperature rise is continued. In cool O-rich stars, where the CO number density is limited by the abundance of carbon, this sensitivity of opacity to temperature is greatly reduced, but other molecules (e.g., SiO or H2O) may act in a similar way.
Third, Arcturus certainly exhibits a chromosphere, which has been modelled by Ayres & Linsky (1975). The chromospheric temperature rise starts at approximately which is deeper down in the photosphere than the on-set of our suggested temperature decline. This bifurcated temperature structure has been found earlier for Arcturus based on CO 4.6 m data (Wiedemann et al. (1994)) and has also been discussed for the Sun (see, for example, Ayres 2002). Existence of the chromosphere around Arcturus suggests a heating mechanism active in and above the upper photosphere. Cuntz & Muchmore (1989) made a preliminary study of the effects of propagating acoustic waves including molecular line cooling. When the waves lead to weak shocks, a cool atmosphere is formed. On the other hand, strong shocks lead to a temperature inversion, approximately matching an empirical chromospheric model for Arcturus. These calculations incorporating a driving mechanism for temperature bifurcation support the idea of an inhomogeneous upper photosphere and low chromosphere.
Chromospheres are indeed dynamic, and are thought to be a wave-driven phenomenon showing spatially and temporally intermittent structures, see for example the work on the solar chromosphere by Carlsson & Stein (1995). They find that the mean temperature is low, but also that transient, high temperatures give rise to the observed enhance emission in the ultra-violet. In the 3D simulations of the solar chromosphere by Wedemeyer et al. (2002), accoustic shocks are excited by the solar convection zone and form structures with different temperatures caused by interaction of propagating wave fronts. They show that the cool phases lasts for approximately 1 minute, on average, until a new, hot wave front passes by again. Whether the timescales are long enough and the physical and chemical conditions are right for molecular formation and how molecules react to the shocks is not clear. In this context it is interesting to note that our suggested model that accounts for the water-vapor, OH, and CO features also predicts strong TiO features in the optical, which is not observed. The abundance of titanium is more than three orders of magnitude lower than that of oxygen and carbon, perhaps suggesting that TiO may not have time to form between shocks.
5. CONCLUDING REMARKS
I have discussed our unexpected discovery of absorption lines of water vapor in the disk-averaged spectrum of Arcturus (Ryde et al. 2002). Based on kinematic information, line widths and excitation temperature, we argue that the water vapor is photospheric and not circumstellar. Until now, H2O has not been expected to exist in photospheres of stars of Arcturus’ effective temperature. This is true unless the outer layers of the model photosphere do not describe these regions properly. By modifying these layers we have succeeded in finding a model which yields a synthetic spectrum matching the observations. We are, however, not claiming that this necessarily is the only and true model. Our exercise simply shows that it is possible to achieve a photospheric spectrum containing water vapor also for early K giants if the outer parts are cooled for some reason. Possible reasons for the unexpected water vapor include photospheric inhomogeneities (such as convective flows, molecular catastrophes, or even star spots) and departures from LTE in the photospheric structure or line formation in the boundary layers. 3D hydrodynamic models of Red giants do not as yet exist, but may be a crucial tool for the understanding of how water vapor can exist on the surface of a warm star such as Arcturus. We strongly encourage model makers to pursue the difficult task of modelling red giants hydrodynamically.
6. ACKNOWLEDGEMENTS
This work was supported by the Swedish Foundation for International Cooperation in Research and Higher Education, Stiftelsen Blanceflor Boncompagni-Ludovisi, née Bildt, and the Robert A. Welch Foundation of Houston, Texas. The construction of the texes spectrograph was supported by grants from the nsf, and observing with texes was supported by usra the Texas Advanced Research Program. NSO/Kitt Peak FTS data used here were produced by NSF/NOAO. We acknowledge the support of the irtf staff.
References
Ayres, T. R. 2002, ApJ, in press
Ayres, T. R. & Linsky, J. L. 1975, ApJ 201, 212
Carlsson, M. & Stein, R. F. 1995, ApJ, 440, L29
Cuntz, M. & Muchmore, D. 1989, A&A 209, 305
Decin, L., Cohen, M., Eriksson, K., et al. 1997, in A. Heras et al. (eds.), First ISO Workshop on Analytical Spectroscopy, pp 185–192, ESA SP-419
Freytag, B. 2001, in Astronomische Gesellschaft Meeting Abstracts, Vol. 18, p. 18
Hinkle, K., Wallace, L., & Livingston, W. C. 1995, in Infrared atlas of the Arcturus spectrum, 0.9-5.3 microns, San Francisco, Calif. : Astronomical Society of the Pacific
Lacy, J. H., Richter, M. J., Greathouse, T. K., Jaffe, D. T., & Zhu, Q. 2002, PASP 114, 153
Polyansky, O. L., Busler, J. R., Guo, B., Zhang, K., & Bernath, P. F. 1996, J. Mol. Spectrosc. 176, 305
Polyansky, O. L., Tennyson, J., & Bernath, P. F. 1997a, J. Mol. Spectrosc. 186, 213
Polyansky, O. L., Zobov, N. F., Viti, S., et al. 1997b, J. Mol. Spectrosc. 186, 422
Ryde, N., Lambert, D. L., Richter, M. J., & Lacy, J. H. 2002, ApJ, in press
Short, I. 2002 ApJ, submitted
Wedemeyer, S., Freytag, B., Steffen, M., et al. 2002, in prep
Wiedemann, G., Ayres, T. R., Jennings, D. E., & Saar, S. H. 1994, ApJ 423, 806