The internal structure of the lens PG1115+080: breaking degeneracies in the value of the Hubble Constant
Abstract
We combine lensing, stellar kinematic and mass-to-light ratio constraints to build a two-component (luminous plus dark) mass model of the early-type lens galaxy in PG1115+080. We find a total mass density profile steeper than , effectively with (random + systematic). The stellar mass fraction is inside the Einstein Radius (RE1.2 effective radii). The dynamical mass model breaks the degeneracies in the mass profile of the lens galaxy and allows us to obtain a value of the Hubble Constant that is no longer dominated by systematic errors: H km s-1 Mpc-1 (68% C.L.; , =0.7). The offset of PG1115+080 from the Fundamental Plane might indicate deviations from homology of the mass profile of some early-type galaxies.
keywords:
gravitational lensing — distance scale — galaxies: kinematics and dynamics — galaxies: fundamental parameters — galaxies: elliptical and lenticular, cD1 Introduction
Time delays between multiple images of gravitational lenses provide the opportunity to measure the Hubble Constant H0 (Refsdal 1964) independently of local distance scale methods which rely on uncertain calibrations (Saha et al. 2001; Freedman et al. 2001). Although the method is attractive for its reliance on general relativity alone and being a one-step global measurement, degeneracies inherent to the mass distribution of the lenses seem hard to break without external information (e.g. Koopmans 2001).
We recently showed that a combination of stellar kinematics and gravitational lensing can be used to place tight constraints on the mass distribution of early-type (E/S0) lens galaxies inside their Einstein radius (Koopmans & Treu 2002, Treu & Koopmans 2002; KT02 and TK02). In particular, it was found that the total mass density profiles of the lens galaxies in MG2016+112 and 0047–281 are very close to . Both lens systems lie on the Fundamental Plane (FP; Dressler et al. 1987; Djorgovski & Davis 1987) at their respective redshifts, and are part of the sample that we selected for the Lenses Structure and Dynamics (LSD) Survey, currently being carried out at the Keck Telescope.
PG1115+080 (=0.31; Weynman et al. 1980) is not part of the LSD Survey – which focuses mainly on relatively isolated early-type galaxies – because of the presence of a massive compact group nearby that could affect the mass distribution of the lens galaxy through interaction. However, this system is particularly interesting because time delays between the lensed quasar images () are available (Schechter et al. 1997; Barkana 1997), which can be used to measure H0. The geometry of this lens system has been modelled in detail (Schechter et al. 1997; Keeton & Kochanek 1997; Courbin et al. 1997; Saha & Williams 1997; Impey et al. 1998, hereafter I98; Williams & Saha 2000; Kochanek, Keeton & McLeod 2001; Saha & Williams 2001; Zaho & Pronk 2001), illustrating how strongly the value of H0 depends on the mass profile of the lens galaxy. Whereas mass models yield values of H050 km s-1 Mpc-1, steeper or constant M/L mass models can yield values up to 60–70 km s-1 Mpc-1.
In this Letter, we apply the methods developed for the LSD Survey to the lens E/S0 galaxy in PG1115+080 to break the mass-profile degeneracy and perform an accurate measurement of the Hubble Constant, minimising this dominant source of systematic uncertainty. Based on the lensing and kinematic constraints (i.e. the published velocity dispersion measurement by Tonry 1998), we build a mass model (§2) which we then use to determine H0 (§3). We summarise and discuss our results in §4. Throughout, we define km s-1 Mpc-1, and we assume and . The cosmography affects H0 only at a few percent level.
2 The Mass Distribution
2.1 Spectrophotometric properties of the lens
Hubble Space Telescope (HST) images of the gravitational lens system PG1115+080 are available from the HST archive. We select the images with better resolution and sampling in each of the available bands: s exposure with the Near Infrared Camera and Multi Object Spectrograph (NICMOS; GO-7496; PI: Falco) Camera 2 (NIC2) through filter F160W (I98); 10 exposures on the Planetary Camera (PC) of the Wide Field and Planetary Camera 2 (WFPC2) through filter F814W for a total exposure time of 15060 s (HST GO-6555; PI: Schechter); s exposures on the WFPC2-PC through filter F555W (HST G0-7495; PI: Falco)
The images were first reduced using a series of iraf tasks based on the drizzle package (Fruchter & Hook 2002). This process yielded maps of bad pixels, cosmic rays, saturated pixels, and pixels affected by horizontal smearing for each individual exposure. Then, we used a series of IDL scripts to subtract the QSO multiple images from each individual exposure, after masking the deviant pixels. For each exposure we used a library of subsampled synthetic Point Spread Functions (PSFs) computed with TINY TIM 6.0 (Krist & Hook 2001) covering a range of the relevant parameters, such as jitter and focus offset to simulate HST breathing. The PSF giving the smallest residuals was used to remove the QSO images from each exposure. The individual exposures were finally combined to produce an image of the lens galaxy. The lens galaxy is imaged at high signal to noise ratio in the F160W and F814W images, which we used to measure its structural parameters. The structural parameters are listed in Table 1. An almost complete ring is visible in the F160W image (see I98). Unfortunately, the signal-to-noise ratio is significantly lower in the F555W exposure and structural parameters could not be reliably measured. However, the colour F555W–F814W= can be reliably measured within a fixed aperture of radius .
Rest frame quantities were obtained as described in Treu et al. (2001b) using the F814W photometry, the F555W–F814W colour, and correcting for galactic extinction with E(B–V)=0.041 (Schlegel, Finkbeiner & Davis 1998). We use the parameters in the F814W filter because it is much closer in wavelength than F160W to the standard rest frame B and V bands, and the effects of possible colour gradients are therefore minimised.
| F160W | F814W | |
|---|---|---|
| m (mag) | ||
| SBe (mag arcsec-2) | ||
| Re (arcsec) | ||
| V | B | |
| M (mag) | ||
| SBe mag arcsec-2 |
Using the stellar velocity dispersion (Tonry 1998) of 28125 km s-1 measured inside a squared aperture, which corresponds to a central velocity dispersion km s-1 in a circular aperture of radius , we place the lens galaxy of PG1115+080 in the FP space (i.e. the space with axis , SBe, and ) and compare the position of the galaxy to the FP as defined by the largest sample of galaxies at comparable redshift, 30 E+S0 galaxies in the cluster CL1358+62 at (Kelson et al. 2000). As shown in the left panel of Fig. 1, the lens galaxy is dimmer than cluster galaxies with the same velocity dispersion and effective radius (see also Kochanek et al. 2000). The lens galaxy is dimmer even than the galaxies in the Coma Cluster (Bender et al. 1998) at variance with the observed trend that the luminosity of E/S0 galaxies at a given radius and velocity dispersion increases as a function of increasing redshift (e.g. Treu et al. 2002). In the right panel of Fig 1 we show the residuals from the FP of Coma for the lens galaxy and the galaxies in cluster CL1358+62. The lens galaxy lies on the dimmest tail of the distribution, and is offset by 4–5 times the rms from the median/average CL1358+62 value. Since nothing in the morphology or colours (e.g. the lens has B–V=, whereas the average colour of the galaxies in cluster CL1358 is B–V=0.86) of the lens galaxy seems to indicate the presence of dust or anomalous stellar populations, we will assume that the offset arises from structural differences.

As in TK02 and KT02 we use the evolution of the effective mass-to-light ratio , inferred from the local FP studies, to estimate the stellar mass to light ratio of the lens galaxy. Assuming that (see discussion in Treu et al. 2001a; Treu et al. 2002; KT02), we use the average local value M⊙/LB,⊙ (Gerhard et al. 2001 and references therein) and the average evolution observed for field E/S0 galaxies at =0.31 (Treu et al. 2002) to find M⊙/LB,⊙ for the lens galaxy. The observed evolution for cluster galaxies by van Dokkum et al. (1998) yields M⊙/LB,⊙. In the context of our hypothesis of a structural origin of the FP offset, we use the average observed values and not the evolution derived from the galaxy itself to estimate its stellar mass to light ratio (which would yield M⊙/LB,⊙).
2.2 Dynamical and lensing models
We calculate the expected stellar velocity dispersion of the lens galaxy in PG1115+080 – to compare then with the observed value, §2.1) – by modelling its mass distribution with two spherical components 111See, e.g., Saglia, Bertin & Stiavelli (1992 and Kronawitter et al. 200) for discussions on the accuracy of the spherical approximation., one for the luminous stellar matter and one for the dark-matter halo. The luminous mass density profile is described either by a Hernquist (1990; HQ) model or a by Jaffe (1983; JF) model. The dark-matter distribution is modeled with a generalised version of the Navarro, Frenk, & White (1997; NFW) density profile. CDM simulations show that the break radius () is much larger than the Einstein Radius (e.g. Bullock et al. 2001). Hence, effectively inside the Einstein radius, where is the inner slope of the dark matter halo (=1 for NFW). We further adopt an Osipkov–Merritt (OM; Osipkov 1979; Merritt 1985a,b) parametrisation of the anisotropy of the stellar velocity ellipsoid, , where and are the tangential and radial components of the stellar velocity dispersion and indicates the anisotropy radius (see KT02 for discussion). The line-of-sight velocity dispersion is determined by solving the spherical Jeans equation, correcting for the average seeing of 08, and averaging the velocity dispersion profile – weighted by the surface brightness – inside the spectroscopic aperture.
A very similar mass model is used to reproduce the lensing geometry with two minor differences: (i) the lens model allows for ellipticity of the dark-matter halo ( in all cases) whereas the luminous mass profile is spherical (consistent with the observations; §2.1; I98); (ii) the luminous mass profile is modelled with a HQ or pseudo-Jaffe profile (Keeton 2001). The latter is analytically tractable and differs only marginally from the JF profile. An additional component, accounting for the nearby massive compact group, is necessary to reproduce accurately the lensing geometry (e.g. Schechter et al 1997). We model the group as an isothermal sphere (i.e. ) or a NFW mass distribution. The break radius of the NFW profile is chosen to be 10′′, consistent with results from CDM simulations (e.g. Bullock et al. 2001) for the observed velocity dispersion of the group (330 km s-1; Tonry 1998).
2.3 Constraining the mass profile of the lens
We now use the available observations to constrain the free parameters of the models introduced in §2.2, with the overarching goal of determining accurately the mass profile and hence the value of H0. To this aim we use four sets of observables. (i) The relative astrometry of the multiple images and lens galaxy, derived from the NICMOS images using PSF fitting, isophotal fitting, and centroiding (Table 2; names are as in I98). The uncertainties include the statistical component and the systematic difference between the three techniques. Our astrometry is consistent within the errors with that obtained by I98. (ii) The observations described in §2.1, namely the effective radius, total luminosity, velocity dispersion and stellar mass-to-light ratio of the lens galaxy. (iii) The time delay between images B and C days (Barkana 1997; Schechter et al. 1997). (iv) The relative fluxes of the images with 20% errors (Table 2; see I98). The precise choice of the errors on the flux-ratios are less important, because the more precise image positions are the dominant contraints on the lens mass model.
| Object | RA | DEC | |
|---|---|---|---|
| A1 | 2.290.08 | ||
| A2 | 3.440.15 | ||
| B | 0.760.04 | ||
| C | 1.00 | ||
| G | – |
Specifically, we use these observations and the dynamical model to constrain the slope of dark matter halo () and the fraction of stellar mass within the Einstein Radius (). The relative astrometry yields the projected mass of the lens galaxy within the Einstein Radius – corrected for the projected mass contribution of the group – which is virtually independent of the mass profile of the galaxy or that of the nearby group for the two group mass profiles that we adopt (see §2.2).
We find a mass of M⊙ – corresponding to km s-1 for a singular isothermal ellipsoid – consistent with results from I98. The Einstein radius RE= corresponds to R kpc at the redshift of the lens. The half-light radius of the luminous component is set equal to the effective radius of the best fitting model (§2.1). For any given value of the anisotropy radius , we determine the likelihood of each (,) pair, by comparing the observed stellar velocity dispersion with that from the dynamical model, and assuming Gaussian error distributions. In the limit of negligible stellar mass fraction (), the “effective slope” (see TK02 or KT02) of the lens-galaxy mass profile is and (68% CL) for the isotropic () HQ and JF luminous profiles, respectively. These values are lower by 1–2% for non-isotropic models with . This suggests that a steep total mass profile is required for the lens galaxy to explain the large observed stellar velocity dispersion and is expected to increase H0 by 30–40% (Wucknitz 2002). For completeness, we note that a total mass profile with can be excluded at the 99.9%(99%) CL for both the isotropic(non-isotropic) JF and HQ models.
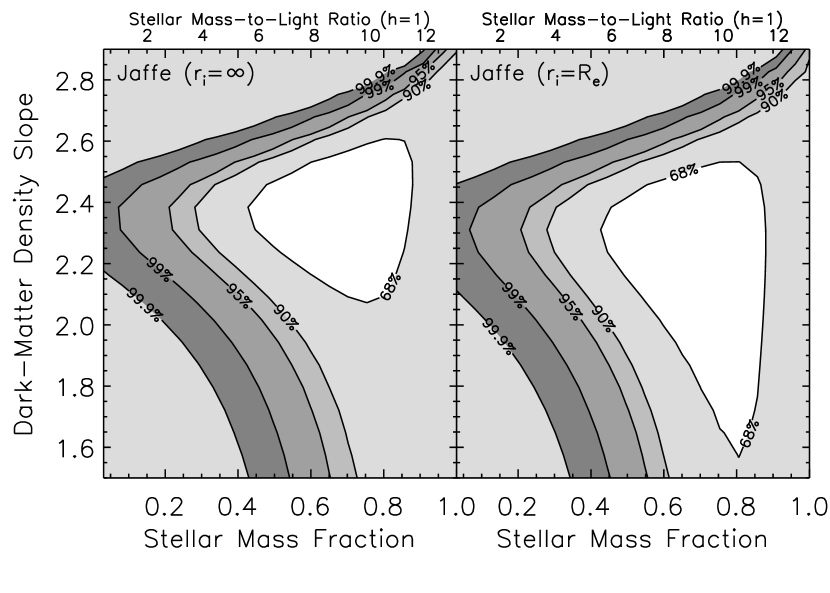
If we now include the constraints on the stellar (cluster) mass-to-light ratio (§2.1; see TK02 or KT02 for details) – which gives the stellar mass fraction inside the Einstein radius independent of H0 – we find dark-matter slopes of = (68% CL) and = for the isotropic JF (shown as an example in Fig. 2) and HQ profiles, respectively. Mildly anisotropic JF models with lead to , whereas similar HQ models give . The stellar mass fraction for a JF profile is (68% CL; compare, e.g., the results in Bertola et al. 1993 for local E/S0) inside the Einstein radius (0.05 lower for HQ profile). This fraction lowers by 0.1 when we use the field M/L evolution (§2.1).
For the HQ profile with its relatively shallow inner luminosity density profile, the dark-matter halo density dominates at lens-galaxy radii 0.5 kpc (in fact, this happens even for HQ profiles in an total mass profile). For this reason we regard this a less likely mass model, although we will continue to use it to illustrate the effect of a range of inner luminosity-density profiles on the determination of H0. A small core radius of kpc for the steeper JF models is sufficient to avoid this problem and has only negligible effect on the stellar dispersion. We also find that total mass profiles with neither a constant (negative or positive, i.e. tangentially or radially anisotropic) nor an Osipkov-Merritt model at the limit of radial instability (e.g. Nipoti, Londrillo & Ciotti 2002) can reproduce the observed stellar velocity dispersion.
3 The Hubble Constant
Having the constraints on and in hand – we can tightly constrain the lens models and determine H0 (§3), thereby including in its error budget the uncertainties on the mass profile of the lens. We use the lens-code from Keeton (2001) to model the system with the data described above. As a test, we are able to recover the results from I98 within the errors with both their astrometry and ours. The stellar mass fraction and the slope of the dark-matter halo inside the Einstein radius are set equal to those determined in the previous paragraph. This leaves as free parameters: the ellipticity, the position angle, and mass inside the Einstein Radius of the dark-matter halo; the source position; the position and mass of the nearby group. For each mass model, we find the set of free parameters that minimises the . From the resulting minimum– lens model, we determine H0 by comparing the model time-delay between images B and C with the observed time delay (§3). We stress that all constraints on the lens model are independent of H0.
| JF-ISO | HQ-ISO | JF-OM | HQ-OM | |
|---|---|---|---|---|
| group SIS | 57 | 61 | 56 | 60 |
| group NFW | 59 | 62 | 57 | 62 |
Additional constraints can be obtained by using the shape of the Einstein ring (Kochanek et al. 2001), as determined by tracing its peak surface brightness in 47 independent points. We do not use the brightness maxima or minima of the ring, which are difficult to measure accurately. We assume an error of on the ring peak-brightness positions, chosen to yield a minimum- approximately equal to the number of degrees of freedom for the lens model. In this way, we find minimum– values of 56, 55 and 55 for models where the lens galaxy is modeled as a single singular isothermal ellipsoid (I98), a single Pseudo-JF (i.e. constant M/L) profile with half-light radius equal to (i.e. ; see Keeton 2001), and our best HQ model embedded in a steep dark-matter halo (see §2.2), respectively (a singular isothermal group is assumed). Remarkably, the values are indistinguishable and the values of H0 in all three cases are found to be similar to those without the ring as an additional constraint. We therefore conclude that the Einstein ring does not allow us to distinguish between an mass model, a constant M/L pseudo-JF model with break radius , or our best dynamical mass model, nor does it improve significantly the accuracy on H0 (see also Saha & Williams 2001). Finally, we note that all our models give , consistent with Barkana (1997).
Tab. 3 lists the values of H0 obtained for a variety of mass models (HQ to JF luminous mass profiles, isothermal to NFW group mass profiles, isotropic to non-isotropic stellar mass distributions), all consistent with the available observations (see §2.3). This relatively large set of models leads to a tight range of H0=56–62 km s-1 Mpc-1.
To compute the random errors we include the contributions from uncertainty in the images and lens positions, in the time-delay, in the image flux-ratios, in the slope of the dark-matter halo and in the fraction of stellar mass inside the Einstein radius. The errors from the lens model and dynamical model are determined separately, assuming they are independent. In all cases the errors on H0 due to the lens models significantly dominate those due to the dynamical models. In particular, the uncertainties on the galaxy position and time-delay dominate the error budget on H0. We combine the random errors from the lensing and dynamical models and list the 68% CL limits in Tab. 3. Because we re-optimize until , the error-ranges include the effects of any parameter degeneracies (i.e. internal versus external shear) within the context of our mass model.
We adopt, as best estimate of H0 from PG1115, the average value from the eight models considered in Table 3, for the random uncertainty the average of the random uncertainties and for the systematic uncertainty the semi-difference between the maximum and minimum values, i.e. H km s-1 Mpc-1 (random/systematic).
4 Summary & Discussion
We have combined mass-to-light ratio constraints with lensing and dynamical analyses – using the stellar velocity dispersion measurement from Tonry (1998) – to constrain the radial mass profile of the lens galaxy of PG1115+080 and break its degeneracy with the value of H0, as determined from the measured time delay. Our main results are:
(1) A steep total mass profile with , where =2.350.10.05, and an isotropic or mildly radial velocity ellipsoid, successfully reproduces the stellar velocity dispersion and the lensing constraints. A two-component mass model, with a luminous component with stellar as determined from the evolution of the FP, satisfies all the constraints only for a relatively steep (compare TK02 and KT02) inner slope of the dark matter halo and a considerable fraction of stellar mass within the Einstein Radius, . This model explains the offset of PG1115+080 from the FP in terms of structural differences and does not require strong radial anisotropy of the stellar velocity distribution.
In previous work, ad hoc distributions of stellar orbits have been constructed inside a logarithmic potential also leading to a high stellar velocity dispersion (Romanowsky & Kochanek 1999). However, if the enclosed mass is kept fixed (given by the lens model), these orbits need to be extremely radial and instability issues may arise. Recent numerical analyses show that if E/S0 galaxies are offset from the FP through radial anisotropy by more than the observed scatter in the FP, they become unstable and evolve back to the FP (Nipoti et al. 2002). Tangential orbits always lead to a lower central velocity dispersion. Our mass model explains the offset by breaking the homology in the mass distribution, and is consistent with the anisotropy structure expected in galaxy-formation scenarios, with close to isotropic orbits in the central regions (e.g. van Albada 1982; see also the observations in Gerhard et al. 2001).
Our similar analyses of two other lenses (MG2016+112 and 0047–281; TK02 and KT02) indicate that both lie on the FP of field E/S0 galaxies and not only have total mass profiles with slope 2 within 5%, but in the case of 0047–281, a spatially resolved velocity dispersion profile allows us to rule out tangential anisotropy or significant radial anisotropy in the center of the galaxy. Data for other lenses with quality comparable to 0047–281 are being collected by the LSD Survey, to provide more information on the mass distribution and orbital structure of E/S0 (lens) galaxies.
(2) Applying these dynamical constraints to the lens mass models of PG1115+080, we find H km s-1 Mpc-1 including random (68% CL) and systematic uncertainties. To achieve higher accuracy it will be necessary to further reduce the dominant sources of uncertainty, i.e. errors on astrometry and time delay. Note that this value is significantly higher than the value of H4 km s-1 Mpc-1 found by I98, who assumed an mass profile.
Comparing to other lensing measurements of H0, our value is consistent with those derived from B1608+656 (Fassnacht et al. 1999; Koopmans & Fassnacht 1999; Fassnacht et al. 2002) and B1600+434 (Koopmans et al. 2000; Kochanek 2002), both assuming mass profiles. However, in other cases values of Hkm s-1 Mpc-1 have been found using mass profiles as well (e.g. Kochanek 2002). We therefore conclude that the approximation might not always appropriate for the determination of H0 from time-delays, given the intrinsic scatter in the total mass profile and fraction of dark matter in the central 1–2 Re of E/S0 galaxies (see e.g., Bertin et al. 1994; Carollo et al. 1995; Gerhard et al. 2001, for ranges of mass profiles of E/S0 galaxies), particularly if there is evidence for offsets from the FP. We propose that the apparent differences between H0, inferred from different lens galaxies modelled with the same mass profiles, is therefore the result of structural, not kinematic, non-homology of E/S0 galaxies, which might be related to differences in their formation or interaction histories (e.g. field versus group/cluster). Hence it appears that additional constraints, such as stellar kinematics, are essential to precisely determine the mass profile – hence H0 – for at least some lens-systems with measured time-delays.
Finally, as compared to local determinations of H0, our value is consistent with H km s-1 Mpc-1 from Saha et al. (2001; and references therein), but only marginally consistent with the final value, H km s-1 Mpc-1, from the HST Key-project (Freedman et al. 2001).
5 Acknowledgments
We thank E. Agol, G. Bertin, L. Ciotti, R. Ellis, and O. Wucknitz for their comments on this manuscript. Based on observations collected with the NASA/ESA HST, obtained at STScI, which is operated by AURA, under NASA contract NAS5-26555.
References
- [Barkana 1997] Barkana R., 1997, ApJ, 489, 21
- [Bender et al. 1998] Bender R., Saglia R. P., Ziegler B., Belloni P., Greggio L., Hopp U., Bruzual G., 1998, ApJ, 493, 529
- [Bertin et al. 1994] Bertin G. et al. 1994, A&A, 292, 381
- [Bertola et al. 1993] Bertola, F., Pizzella, A., Persic, M., Salucci, P., 1993, ApJ, 416, L45
- [Bullock et al. 2001] Bullock J. S., Kolatt T. S., Sigad Y., Somerville R. S., Kravtsov A. V., Klypin A. A., Primack J. R., Dekel A., 2001, MNRAS, 321, 598
- [Carollo et al. 1995] Carollo C. M., de Zeeuw P. T., van der Marel R. P., Danziger I. J., Qian E. E., 1995, ApJ, 441, L25
- [Courbin et al. 1997] Courbin F., Magain P., Keeton C. R., Kochanek C. S., Vanderriest C., Jaunsen A. O., Hjorth J., 1997, A&A, 324, L1
- [Djorgovski & Davis 1987] Djorgovski S., Davis M., 1987, ApJ, 313, 59
- [Dressler et al. 1987] Dressler A., Lynden-Bell D., Burstein D., Davies R. L., Faber S. M., Terlevich R. J., Wegner G., 1987, ApJ, 313, 42
- [Fassnacht et al. 1999] Fassnacht C. D., Pearson T. J., Readhead A. C. S., Browne I. W. A, Koopmans L. V. E., Myers S. T., Wilkinson P. N., 1999, ApJ, 527, 498
- [Fassnacht et al. 2002] Fassnacht C. D., Xanthopoulos E., Koopmans L. V. E., Rusin, D., 2002, ApJ, in press, astro-ph/0208420
- [Freedman et al. 2001] Freedman W. L., et al. 2001, ApJ, 553, 47
- [Fruchter & Hook 2002] Fruchter A. S., Hook R. N. 2002, PASP, 114, 144
- [Gerhard et al. 2001] Gerhard O., Kronawitter A., Saglia R. P., Bender R., 2001, AJ, 121, 1936
- [Hernquist 1990] Hernquist L., 1990, ApJ, 356, 359
- [Impey et al. 1998] Impey C. D., Falco E. E., Kochanek C. S., Lehar J., McLeod B. A., Rix H.-W., Peng C. Y., Keeton C. R., 1998, ApJ, 509, 551 [I98]
- [Jaffe(1983)] Jaffe W. 1983, MNRAS, 202, 995
- [Keeton 2001] Keeton C. R., 2001, ApJ, submitted
- [Keeton & Kochanek 1997] Keeton C. R., Kochanek C. S., 1997, ApJ, 487, 42
- [Kelson et al. 2000b] Kelson D. D., Illingworth G. D., van Dokkum P. G., Franx M., 2000b, ApJ, 531, 184
- [Kochanek et al. 2000] Kochanek C. S., et al., 2000, ApJ, 543, 131
- [Kochanek, Keeton & McLeod 2001] Kochanek C. S., Keeton C. R., McLeod B. A., 2001, ApJ, 547, 50
- [Kochanek 2002] Kochanek C. S., 2002, ApJ, submitted
- [Koopmans 2001] Koopmans L. V. E., 2001, PASA, 18, 179
- [Koopmans & Fassnacht (1999)] Koopmans L. V. E., Fassnacht C. D., 1999, ApJ, 527, 513
- [Koopmans & Treu (2002)] Koopmans L. V. E., Treu, T. 2002, ApJ, submitted, astro-ph/0205281 [KT02]
- [Krist & Hook (2001)] Krist J., Hook R. 2001, “The Tiny Tim user’s guide”
- [Kronawitter 2000] Kronawitter, A., Saglia, R. P., Gerhard, O., & Bender, R. 2000, A&AS, 144, 53
- [Merritt 1985] Merritt D., 1985a, AJ, 90, 1027
- [Merritt 1985] Merritt D., 1985b, MNRAS, 214, 25
- [Navarro et al. 1997] Navarro J., Frenk C. S., White S. D. M, 1997, ApJ, 490, 493 [NFW]
- [Nipoti, Londrillo & Ciotti 2002] Nipoti C., Londrillo P., Ciotti L. MNRAS, 332, 901
- [Osipkov 1979] Osipkov L. .P., 1979, Pis’ma Astron. Zh., 5, 77
- [Refsdal 1964] Refsdal S., 1964, MNRAS, 128, 295
- [Romanowsky & Kochanek 1999] Romanowsky A. J., Kochanek C. S., 1999, ApJ, 516, 18
- [Saglia et al. 1992] Saglia, R. P., Bertin, G. & Stiavelli, M. 1992, apj, 384, 433
- [Saha & Williams 1997] Saha P., Williams L. L. R., 1997, MNRAS, 292, 148
- [Saha & Williams 2001] Saha P., Williams L. L. R., 2001, AJ, 122, 585
- [Saha et al. 2001] Saha A., Sandage A., Tammann G. A., Dolphin A. E., Christensen J., Panagia N., Macchetto F. D. 2001, ApJ, 562, 314
- [Schechter et al. 1997] Schechter P. L. et al., 1997, ApJ, 475, L85
- [Schlegel et al. 1998] Schlegel D. J., Finkbeiner D. P., Davis M., 1998, ApJ, 500, 525
- [Tonry 1998] Tonry J. L., 1998, AJ, 115, 1
- [Treu & Koopmans (2002)] Treu T., Koopmans L. V. E., 2002, ApJ, 575, 87 [TK02]
- [Treu et al. (2001a)] Treu, T., Stiavelli, M., Bertin G., Casertano, C., & Møller, P. 2001a, MNRAS, 326, 237
- [Treu et al. 2002] Treu T., Stiavelli M., Casertano S., Møller P., Bertin G., 2002, ApJ, 564, L12
- [Treu et al. 2001] Treu T., Stiavelli M., Møller P., Casertano S., Bertin G., 2001b, MNRAS, 326, 221
- [van Albada 1982] van Albada T. S., 1982, MNRAS, 201, 939
- [van Dokkum et al. 1998] van Dokkum P., Franx M., Kelson D. D., Illingworth G. D., 1998, ApJ, 504, L17
- [Weynman et al. 1980] Weynman R. J. et al. 1980, Nature, 285, 61
- [Williams & Saha 2000] Williams L. L. R., Saha P., 2000, AJ, 119, 439
- [Wucknitz 2002] Wucknitz O., 2002, MNRAS, 332, 951
- [Zaho & Pronk 2001] Zaho H., Pronk D., 2001, MNRAS, 320, 401