Oxygen, Carbon and Nitrogen evolution in galaxies
Abstract
We discuss the evolution of oxygen, carbon and nitrogen in galaxies of different morphological type by adopting detailed chemical evolution models with different star formation histories (continuous star formation or starbursts). In all the models detailed nucleosynthesis prescriptions from supernovae of all types and low- and intermediate-mass stars are taken into account. We start by computing chemical evolution models for the Milky Way with different stellar nucleosynthesis prescriptions. Then, a comparison between model results and “key” observational constraints allows us to choose the best set of stellar yields. Once the best set of yields is identified for the Milky Way, we apply the same nucleosynthesis prescriptions to other spirals (in particular M101) and dwarf irregular galaxies. We compare our model predictions with the [C,N,O/Fe] vs. [Fe/H], log(C/O) vs. 12+ log(O/H), log(N/O) vs. 12+ log(O/H) and [C/O] vs. [Fe/H] relations observed in the solar vicinity and draw the following conclusions: i) there is no need to invoke strong stellar winds in massive stars in order to explain the evolution of the C/O ratio, as often claimed in the literature; ii) the predicted [O/Fe] ratio as a function of metallicity is in very good agreement with the most recent data (Meléndez & Barbuy 2002) available for the solar vicinity, especially for halo stars. This fact again suggests that the oxygen stellar yields in massive stars computed either by Woosley & Weaver (1995) or Thielemann et al. (1996) without taking into account mass loss, well reproduce the observations; iii) we predict that the gap observed in the [Fe/O] and [Fe/Mg] at [Fe/H]0.3 dex, should be observed also in C/O and N/O versus O/H. The existence of such a gap is predicted by our model for the Milky Way and is due to a halt in the star formation between the end of the thick disk and the beginning of the thin disk phase. Such a halt is produced by the adopted threshold gas density for the star formation rate; iv) this threshold is also responsible for the prediction of a very slow chemical enrichment between the time of formation of the solar system (4.5 Gyr ago) and the present time, in agreement with new abundance measurements; v) the chemical evolution models for dwarf irregulars and spirals, adopting the same nucleosynthesis prescriptions of the best model for the solar neighbourhood, well reproduce the available constraints for these objects; vi) by taking into account the results obtained for all the studied galaxies (Milky Way, M101, dwarf galaxies and DLAs) we conclude that there is no need for claiming a strong primary component of N produced in massive stars (M10M⊙); vii) moreover, there is a strong indication that C and N are mainly produced in low- and intermediate-mass stars, at variance with recent suggestions that most of the C should come from massive stars. In particular, intermediate-mass stars with masses between 4 and 8 M⊙ contribute mostly to N (both primary and secondary) whereas those with masses between 1 and 3 M⊙ contribute mostly to C. At the same time, our results suggest that the C yields computed for massive stars, without taking into account stellar rotation, are underestimated and should be at least a factor of 3 larger than the current values.
1 Introduction
The variation of element abundance ratios with metallicity can be used as a powerful tool for understanding the chemical enrichment of galaxies and hence, their evolution. Given the fact that different chemical elements are produced on different timescales by stars of different lifetimes, the abundance ratios of some key elements versus metallicity will depend not only on the stellar evolution processes but also on the star formation history (SFH) of a galaxy (e.g., Pagel 1997). The SFH in turn depends on important processes taking place during the galaxy evolution like, for instance, inflow and outflow of gas.
Because of their long main-sequence lifetimes and lack of deep convective zones, the lower mass stars which are still observable today, have preserved the patterns of elemental abundances generated by the initial burst of star formation. In principle, by analyzing the chemical abundances of stars of various ages, lying at different positions inside a galaxy, it is possible to constrain its star formation and enrichment histories. However, since high quality spectra of individual stars are required to determine abundances, studies of this kind are possible only in a few cases.
The CNO elements, and in particular the C/O and N/O abundance ratios, can be considered “key” tools for the study of chemical evolution of galaxies, as these are elements produced by different mechanisms and in different stellar mass ranges. Oxygen is almost entirely produced by massive stars and ejected into the interstellar medium via the explosion of type II SNe. The situation for C and N is more complex as these elements can be produced by stars of all masses. N is mostly a secondary element being a product of the CNO cycle and formed at expenses of the C and O already present in the star, although a primary N component originating in asymptotic giant branch (AGB) stars is also predicted by stellar nucleosynthesis studies. In fact, primary nitrogen can be produced during the third dredge-up, occurring along the AGB phase, if nuclear burning at the base of the convective envelope is efficient (hot-bottom burning, HBB, Renzini & Voli 1981 - hereinafter RV). Some primary N can also be produced in massive stars due to stellar rotation, according to the recent calculations of Meynet & Maeder (2002b). Carbon is a primary element produced during the quiescent He-burning in massive and intermediate-mass stars. However, there are many uncertainties still involved in the carbon yields.
The abundance ratio of a secondary to a primary element is predicted to increase with the abundance of its seed. This is the case for the N/O ratio as N is mostly a secondary element, especially in massive stars. On the other hand, the abundance ratio of two primary elements such as 12C and 16O, which are restored into the ISM by stars in different mass ranges, shows almost the same behavior with metallicity as the ratio between a secondary and a primary element: the C/O ratio in fact increases with metallicity. The most straightforward interpretation is that 12C is mainly restored into the ISM by intermediate-mass stars (and hence on longer timescales compared to the 16O enrichment which comes mainly from massive stars), so that the C/O ratio increases as the ISM enrichment proceeds. In other words, the production of a primary element on long timescales mimics the secondary nature. This interpretation has been recently challenged by several papers (eg. Henry et al. 2000, Carigi 2000 - see below).
The best place for studying the evolution of the CNO elements is the Milky Way (MW), where it is possible to measure the abundances of stars of different ages and hence infer the chemical composition of the ISM at various epochs. In particular, the abundances of the CNO elements in metal-poor stars provide an important constraint on the early chemical evolution of the Milky Way. The abundances of the very-metal-poor stars belonging to the halo trace the composition of the ISM at the time of their formation, i.e., many billion years ago, when most of the enrichment was due to massive stars. B stars and HII regions trace instead the ISM chemical composition in the Galactic disk at the present time. In the past years a great deal of observational work has been devoted to measure stellar abundances in the Milky Way, both in halo and disk stars (for a large compilation of the available abundance data until 1999 see Chiappini et al. 1999). More recently, careful and detailed abundance analyses have been carried out by several groups (e.g., Carretta et al. 2000; Fuhrmann 1998; Meléndez et al. 2001, Meléndez & Barbuy 2002, Depagne et al. 2002, Nissen et al. 2002). In particular, a few high quality data are now available for C and O at low metallicities (Carretta et al. 2000).
For the Milky Way, the data reveal that oxygen (as well as other -elements) shows an overabundance relative to Fe in metal-poor stars ([Fe/H] 1.0), whereas these ratios decrease for disk stars until they reach the solar value. This trend is generally interpreted as due to the time-delay in the iron production which originates from long living white dwarfs in binary systems eventually exploding as type Ia SNe. The available data for Mg, Si, Ca and S show that for [Fe/H] 1.0 the [/Fe] ratio is almost constant, defining a plateau, whereas for oxygen there seems to be a slight increase of the [O/Fe] ratio with decreasing metallicity (see Chiappini et al. 2001 for a discussion on this particular point - hereafter CMR2001). On the other hand, recent papers (Israelian et al. 1998, 2001; Boesgaard et al. 1999), show an even steeper increase of the [O/Fe] ratio with decreasing [Fe/H]. This trend, if real, is difficult to reconcile with our knowledge about stellar nucleosynthesis. In the present work we discuss carefully the abundance data concerning oxygen and show that when only the most reliable measurements and abundance analysis (Asplund & Garcia Pérez 2001 - see Sect. 4.1.2) are considered, a good agreement with our theoretical predictions is found.
As far as C and N are concerned, there are still many open questions. It has been shown that chemical evolution models for the MW, adopting the yields computed by RV for low- and intermediate-mass stars together with yields for massive stars as computed by Woosley and collaborators (Woosley et al. 1984; Woosley & Weaver 1995), could not reproduce the steep rise of C/O vs. O/H observed in the solar vicinity (Garnett et al. 1999). A way to solve this problem was suggested by Prantzos et al. (1994) who adopted the yields computed by Maeder (1992) which assume strong mass loss by stellar winds in massive stars. The C yields predicted by Maeder (1992) increase with metallicity, because mass loss itself is an increasing function of metallicity. Prantzos et al. showed that this C/O increase as well as the solar value of this ratio, could be reproduced by models adopting RV yields for low- and intermediate-mass stars and Maeder (1992) ones for massive stars. This fact, together with the uncertainty related to the 12C(,)16O reaction, led to the view that the main contributors to the carbon we observe today in the ISM are massive stars. Recent work in the literature seems to confirm this suggestion, even when the more recent yields of van den Hoek & Groenewegen (1997 - hereafter vdHG) for low- and intermediate-mass stars are used instead of those of RV (Liang et al. 2001; Henry et al. 2000; Carigi 2000). In the present paper we present strong arguments against such interpretation and we suggest that both the N and the C we observe at the present time in the ISM were mostly produced inside low- and intermediate-mass stars. Moreover we show that the N data in the solar vicinity can be explained without invoking important quantities of primary N in massive stars. We then check if our conclusions on the evolution of C, N and O in the MW are consistent with the CNO data available for other galaxies (blue compact galaxies - BCGs, other spiral galaxies and Damped Lyman- systems - DLAs), under the assumption that the stellar nucleosynthesis should be the same for all galaxies.
Abundance data are available for some extragalactic HII regions (Garnett et al. 1995a,b; 1997a,b; van Zee et al. 1997), including those measured in the outer parts of spiral disks (Ferguson et al. 1998; van Zee et al. 1998a,b; Garnett et al. 1999) and BCGs (Izotov et al. 1999; Izotov & Thuan 1999). Some of these objects have metallicities down to around 1/10 solar and are useful to study the behavior of chemical abundances at low metallicities. This is especially true for elements such as C and N.
The N/O vs. O/H diagram for dwarf galaxies is often interpreted in the literature (the same is true for the C/O vs. O/H diagram) as an evolutionary diagram, but instead it represents the final abundance values achieved by objects which evolved in a completely different way from each other (Diaz & Tosi 1986, Matteucci & Tosi 1985). Therefore, a meaningful comparison between model predictions relevant to dwarf irregulars and data should involve only the end points of the theoretical evolutionary tracks. Only in the case of the stars in the Milky Way we face an evolutionary diagram, where O/H can be interpreted as a time-axis.
One of the main questions nowadays is to assess the nature of nitrogen production in massive stars in order to explain the observations of N/O ratios in dwarf galaxies and DLAs which have low metallicities (Pilyugin 1999). The small “plateau” in the N/O ratio observed in low metallicity HII regions (e.g. Izotov and Thuan 1999) is often quoted as one indication that massive stars should produce an important quantity of primary N. This seems to be in conflict with the fact that the nitrogen over Si or S in some DLAs are well below the typical value observed in low-metallicity BCGs (e.g., Lu et al. 1998). In fact, DLAs offer another important piece of information (Pettini et al. 1995; Prochaska & Wolfe 2002) as in this case it is possible to probe the very early phases of evolution of such systems. In this paper we show that the dwarf galaxy and DLA data can be understood without the necessity for primary nitrogen from massive stars.
Clearly, the best way to determine the lower limit of the N/O ratio and hence the existence of a possible primary N contribution from massive stars would be to measure the N/O ratios in Galactic halo stars at metallicities below [Fe/H] 2. As we will show, this corresponds to the first 30 Myr of the evolution of the Milky Way, when the ISM was still not enriched by any intermediate-mass stars (the lifetime of an 8 M⊙ star is around 30 Myr). Unfortunately, the available data for N in halo stars are still too uncertain.
Finally, we discuss the problem of the abundance pattern in outer spiral disks. The CNO abundance ratios in outer disks are similar to those observed in dwarf irregular galaxies (van Zee et al. 1998b). We argue that this is consistent with the concept of “inside-out” formation of the disk, in which the timescale for accretion of gas onto the forming disk increases radially outwards (Matteucci & François 1989; Chiappini et al. 1997, hereafter CMG97; CRM2001). In such a scenario, outer spiral disks have experienced slow star formation like dwarf irregulars. However, some important differences exist and we will address them by studying one spiral galaxy in particular, M101.
The paper is organized as follows. In Section 2 we discuss the different yield sets which we then use in the chemical evolution model for the MW. In Section 3 we present our chemical evolution models for the MW, dwarf galaxies and for M101. In Section 4 our results are shown and the conclusions are drawn in Section 5.
2 Stellar yields
In this section we describe the stellar yields adopted in our chemical evolution models. In particular, for low- and intermediate-mass stars we adopted the yields of RV for two different efficiencies of HBB, and those of vdHG for two different cases of mass loss during the AGB phase (see below). For massive stars we adopted both the yields of Woosley & Weaver (1995 - hereafter WW) and Nomoto et al. (1997) (these latter are essentially the same as in Thielemann, Nomoto & Hashimoto 1996 - heareafter TNH, but for an enlarged grid of masses). None of these models accounts for mass loss by stellar winds and/or stellar rotation, although these processes could affect the chemical yields.
When concluding this paper, new stellar calculations appeared. Those are the new computations of Meynet and Maeder (2002b) and will be included in a future paper. However, the main differences with respect to the yields adopted here will be discussed in the next sections.
2.1 Low- and intermediate-mass stars
Stars with initial masses between 1 and 5 – 8 (depending on stellar evolution models) experience a phase of double-shell burning at the end of their life, referred to as AGB phase. During this phase, they eject into the ISM significant amounts of 4He, 12C, 13C, and 14N. The ejected masses reflect important abundance variations occurred when the stars were on the AGB phase.
In vdHG the stellar yields were computed by taking into account several new physical ingredients (see Groenewegen & de Jong 1993; Groenewegen et al. 1995) and the detailed treatment of mass loss and chemical evolution prior to the AGB. Moreover, the algorithms used are metallicity dependent. This is an important point, since mass-loss rates vary strongly with initial metallicity (e.g., Schaller et al. 1992); moreover, observations show that the luminosity function and the relative number ratios of carbon- and oxygen-rich AGB stars in galaxies of different metallicities are different (e.g., Groenewegen & de Jong 1993).
In the vdHG paper, the theoretical yields were computed for stars with initial masses between 0.8 and 8 and initial metallicities = 0.001, 0.004, 0.008, 0.02, and 0.04. Those authors followed in detail the stellar evolution and mass loss up to the end of the AGB. They included in their computations the first, second, and third dredge-up phases and the effect of HBB, though in an approximate way. The free parameters (the mass loss scaling parameter for stars on the AGB, the minimum core mass for dredge-up, and the third dredge-up efficiency) were fixed to obtain the best agreement with observations of AGB stars in both the Galaxy and the Large Magellanic Cloud (LMC). In particular, for the mass loss scaling parameter, a value of = 4 was adopted. However, for AGB stars in low metallicity systems, values of 1 – 2 may be more appropriate (arguments are given in Groenewegen et al. 1995). With decreasing values of (i.e., smaller mass-loss rates), the resulting yields increase owing to the longer AGB lifetimes which favor more thermal pulses. We computed chemical evolution models for both cases: i) 4 constant with metallicity (adopted in the models of Carigi 2000 and Henry et al. 2000), and ii) varying from 1 to 4 with increasing metallicity.
During the third dredge-up, carbon is dredged-up to the stellar surface and the star eventually becomes a C-star. For stars with initial masses larger than 34 , this transition is affected by HBB. Both the carbon already present and the newly dredged-up one are processed at the base of the convective envelope through the CNO cycle. Unfortunately, details of this process are not well understood. RV treated HBB in considerable detail as a function of the mixing length parameter . We give results of chemical evolution models adopting their yields in the case = 0 (no HBB) and = 1.5. In the standard model of vdHG, HBB is included at a level consistent with the = 2 case of RV, i.e., the largest HBB effect, which according to the authors, agrees with both theory (Boothroyd et al. 1993, 1995) and observations (Plez et al. 1993; Smith et al. 1995). Under these conditions, HBB operates in stars with .
Summarizing the main nucleosynthesis results concerning low- and intermediate-mass stars: the carbon yields increase with decreasing initial metallicity, owing to the fact that dredge-up and subsequent CNO-burning affect more strongly the composition of envelopes with low metallicity. Moreover, the core mass at the first thermal pulse is larger at low metallicity, thus resulting in a larger amount of material dredged-up to the envelope. On the contrary, the nitrogen yields slightly increase with metallicity, as nitrogen is formed by consumption of C and O already present in the stars (secondary production) and by HBB during the AGB phase (primary production). Oxygen production from low- and intermediate-mass stars is practically irrelevant. Note that a non-negligible quantity of C is also produced by Type Ia SNe and this was included in our calculations (for Type Ia SNe we adopted the yields of Thielemann et al. 1983).
2.2 Massive stars
The oxygen and the other -elements (Ne, Mg, Si, S, Ca and Ti) are mainly produced during the hydrostatic burning phases in massive stars (). Their yields depend crucially on the pre-supernova model (convection criterion, mixing processes, mass loss and nuclear reaction rates). The oxygen and the other -elements are normally restored into the ISM via SN explosion (type II SNe). Stellar winds, even in Wolf-Rayet stars, are not able to carry oxygen away but the effect of mass loss is to increase the amount of lost helium and therefore to decrease the final amount of oxygen (since He is later transformed into heavy elements). Thus the net effect of a large mass loss is to increase the yields of He and decrease those of oxygen (see Maeder 1992). Oxygen is not affected by explosive nucleosynthesis, whereas Si, S and Ca are: these elements are also produced in non-negligible amounts during the explosion of SNe Ia (the outcome of C-deflagration in C-O white dwarfs). On the other hand, O and Mg are almost entirely produced in massive stars. The Fe-peak elements are mostly formed during explosive nucleosynthesis, mainly in type Ia SNe. In the explosive nucleosynthesis, the yields depend on the uncertain speed of the burning front and convection and, for type II SN explosions, on the “mass-cut”.
Here we recall the average O and Fe yields from massive stars, obtained by integrating on the Salpeter initial mass function (IMF), as derived from the most recent calculations (WW; TNH), as well as the yields of O and Fe from type Ia SNe (Thielemann et al. 1993). These yields are: , , , . They clearly show that the bulk of O should originate from type II SNe, whereas the bulk of Fe should originate from type Ia SNe when a Salpeter like IMF is chosen.
The effects of -dependent yields including mass loss on Galactic chemical evolution have been studied by, e.g., Maeder (1992) and Prantzos et al. (1994). Prantzos et al. (1994) concluded that the growth of the C yields from massive stars with increasing metallicity is a key point in order to properly understand the [C/O] vs. [Fe/H] relation of disk stars. However, a recent study (Meynet & Maeder 2002b) seems to point to a less important effect of mass-loss than the one given in Maeder (1992). On the other hand, these new results suggest that rotation can increase the C yields, especially at Z 0.004. However, Meynet & Maeder (2002b) do not include a self-consistent calculation of the Fe yields, therefore we do not use these yields. In fact, to be able to test these new calculations on chemical evolution models, a complete grid of stellar yields for several elements is needed. However, in order to take in account, although in an approximate way, the rotation and mass loss effects we also run some models in which the C yields from WW and TNH are multiplied by a factor of 3 in the mass range 40-100 (see Sect. 2.3).
2.3 Comparison of the different yield sets
In Table 1 we present the yields per stellar generation (i.e., integrated over the IMF - see Henry et al. 2000). These quantities are listed for two different IMF choices. For 14N we show the total yield (primary+secondary). From this table we can see for instance: i) the effect of the parameter on the stellar yields computed by RV, where models with =0 (no HBB) predict less N and more C (as well as a little more O, although the contribution to O enrichment by IMS is very low); ii) the effect of a high parameter on the yields of vdHG (case =4 for all metallicities), in a situation of maximum efficiency for HBB. In this case, the C yields dependence on metallicity is small; iii) when adopting smaller at lower metallicities (case var) the C yields are much larger for Z=0.001 and Z=0.004 and decrease with metallicity; iv) for massive stars the secondary N production predicted by WW is larger than the one of TNH, while for O the opposite happens. For C both results are similar.
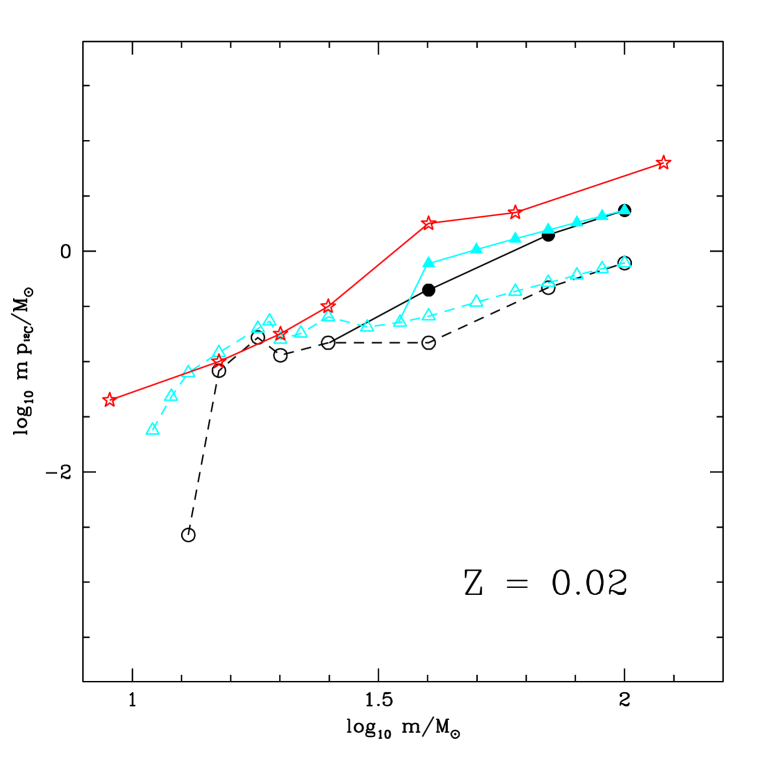
In Figure 1 we show a comparison of different carbon yields for massive stars, computed for solar metallicity (open circles: TNH; filled circles: TNH with carbon yields multiplied by 3; open triangles: WW; filled triangles: WW with carbon yields multiplied by 3; stars: Meynet & Maeder 2002b). The first thing to notice in this figure is that WW and TNH yields multiplied by a factor of 3 in the 40-100 M⊙ range are similar to the new calculations of Meynet & Maeder (2002b). In the lower mass range all the yield sets give quite similar results (and in fact we did not multiply the carbon yields for M 40 M⊙). However, an important difference exists in the 9-13 M⊙ mass range. In fact, the Meynet & Maeder yields are larger than the ones given both in TNH and WW. This would certainly lead to a better agreement with the observed C/O solar value, than the one obtained in the present paper.
| P | P | P | mass range | IMF slope | ref. | |
|---|---|---|---|---|---|---|
| 0.001 | 6.7E-4 | 5.3E-4 | 7.8E-5 | 0.9 – 8.0 | Salpeter | vdHG ( cost) |
| 0.004 | 7.3E-4 | 5.7E-4 | 6.0E-5 | 0.9 – 8.0 | Salpeter | vdHG ( cost) |
| 0.008 | 6.1E-4 | 6.2E-4 | 2.4E-5 | 0.9 – 8.0 | Salpeter | vdHG ( cost) |
| 0.02 | 4.1E-4 | 7.2E-4 | 1.2E-5 | 0.9 – 8.0 | Salpeter | vdHG ( cost) |
| 0.04 | 1.2E-4 | 9.1E-4 | 1.1E-5 | 0.9 – 8.0 | Salpeter | vdHG ( cost) |
| 0.001 | 1.9E-3 | 9.6E-4 | 2.2E-4 | 0.9 – 7.0 | Salpeter | vdHG ( var) |
| 0.004 | 1.3E-3 | 7.4E-4 | 1.2E-4 | 0.9 – 7.0 | Salpeter | vdHG ( var) |
| 0.008 | 6.1E-4 | 6.2E-4 | 2.4E-5 | 0.9 – 8.0 | Salpeter | vdHG ( var) |
| 0.02 | 4.1E-4 | 7.2E-4 | 1.2E-5 | 0.9 – 8.0 | Salpeter | vdHG ( var) |
| 0.04 | 1.2E-4 | 9.1E-4 | 1.1E-5 | 0.9 – 8.0 | Salpeter | vdHG ( var) |
| 0.001 | 6.6E-4 | 4.0E-4 | 7.3E-5 | 0.9 – 8.0 | Scalo | vdHG ( cost) |
| 0.004 | 7.1E-4 | 4.3E-4 | 5.9E-5 | 0.9 – 8.0 | Scalo | vdHG ( cost) |
| 0.008 | 6.1E-4 | 4.8E-4 | 2.9E-5 | 0.9 – 8.0 | Scalo | vdHG ( cost) |
| 0.02 | 3.9E-4 | 5.9E-4 | 2.8E-5 | 0.9 – 8.0 | Scalo | vdHG ( cost) |
| 0.04 | 6.5E-5 | 7.9E-4 | 3.1E-5 | 0.9 – 8.0 | Scalo | vdHG ( cost) |
| 0.001 | 1.9E-3 | 7.6E-4 | 2.1E-4 | 0.9 – 7.0 | Scalo | vdHG ( var) |
| 0.004 | 1.3E-3 | 5.8E-4 | 1.2E-4 | 0.9 – 7.0 | Scalo | vdHG ( var) |
| 0.008 | 6.1E-4 | 4.8E-4 | 2.9E-5 | 0.9 – 8.0 | Scalo | vdHG ( var) |
| 0.02 | 3.9E-4 | 5.9E-4 | 2.8E-5 | 0.9 – 8.0 | Scalo | vdHG ( var) |
| 0.04 | 6.5E-5 | 7.9E-4 | 3.1E-5 | 0.9 – 8.0 | Scalo | vdHG ( var) |
| 0.02 | 6.6E-4 | 1.0E-3 | -5.5E-5 | 1.0 – 8.0 | Salpeter | RV ( = 1.5) |
| 0.02 | 5.6E-4 | 7.6E-4 | -4.0E-5 | 1.0 – 8.0 | Scalo | RV ( = 1.5) |
| 0.02 | 1.3E-3 | 1.8E-4 | -1.8E-5 | 1.0 – 8.0 | Salpeter | RV ( = 0) |
| 0.02 | 1.1E-3 | 1.6E-4 | -1.4E-5 | 1.0 – 8.0 | Scalo | RV ( = 0) |
| 0.02 | 4.9E-4 | 8.8E-6 | 1.3E-2 | 13.0 – 70.0 | Salpeter | TNH |
| 0.02 | 2.1E-4 | 4.2E-6 | 4.9E-3 | 13.0 – 70.0 | Scalo | TNH |
| 0.02 | 5.9E-4 | 1.8E-4 | 6.2E-3 | 11.0 – 40.0 | Salpeter | WW |
| 0.02 | 2.8E-4 | 8.6E-5 | 2.7E-3 | 11.0 – 40.0 | Scalo | WW |
In Tables 2a and 2b we list the main nucleosynthesis prescriptions used in our models for the Milky Way. The second column indicates the adopted yields for low- and intermediate-mass stars, the third column indicates those for massive stars. The last column indicates those models where the C yields were increased by a factor of 3 in stars in the 40 to 100M⊙ mass range. Table 2b shows models analogous to model 6 but with modified nucleosynthesis for what concerns the prescriptions for N (model 8) and without a gas density threshold in the disk (model 9 - Sect. 3.1). In particular, for model 8 we assumed an important primary N contribution from massive stars.
| Model | low- and intermediate-mass stars | massive stars | 3 in the range 40 – 100 |
|---|---|---|---|
| 1 | RV ( = 0) | TNH | no |
| 2 | RV ( = 1.5) | TNH | no |
| 3 | vdHG ( cost) | TNH | no |
| 3a | vdHG ( cost) | TNH | yes |
| 4 | vdHG ( var) | TNH | no |
| 5 | vdHG ( var) | WW | no |
| 6 | vdHG ( var) | TNH | yes |
| 7 | vdHG ( var) | WW | yes |
| Model | Low- and intermediate | Massive stars | Modification |
|---|---|---|---|
| mass stars | |||
| 8 | vdHG ( var) | TNH | +primary N for massive stars |
| 9 | vdHG ( var) | TNH | no threshold in the disk |
3 The chemical evolution models
3.1 The chemical evolution model for the Milky Way
We adopt the two-infall model of CMG97 (see also CMR2001) where the formation of the halo is almost disentangled from that of the disk. The halo and bulge form on a relatively short timescale (0.8-1.0 Gyr) out of a first infall episode, whereas the disk accumulates much more slowly and “inside-out” during a second independent infall episode. The Galactic disk is approximated by several independent rings, 2 kpc wide, without exchange of matter between them. The rate of accretion of matter in each shell is:
| (1) |
where is the surface mass density of the infalling material, which is assumed to have primordial chemical composition; is the time of maximum gas accretion onto the disk, coincident with the end of the halo/thick-disk phase and set here equal to 1 Gyr; and are the timescales for mass accretion onto the halo/thick-disk and thin-disk components, respectively. In particular, = 0.8 Gyr and, according to the “inside-out” scenario, = 1.033/kpc)1.267 Gyr, in order to have 8kpc=7 Gyr as required to fit the G-dwarf metallicity distribution. We adopt a linear approximation for the variation of . This variation is constrained by the observed radial profiles of gas, star formation rate (SFR) and abundances. In some cases the observed radial profiles suggest that this timescale can approach a constant value for Galactocentric distances larger than 12 kpc. The quantities and are derived from the condition of reproducing the current total surface mass density distribution in the halo and along the disk, respectively (Rana 1991).
The SFR adopted here has the same formulation as in CMG97:
| (2) |
where is the efficiency of the star formation process, is the total surface mass density at a given radius and a given time , is the total mass surface density at the solar position, is the gas surface mass density and is the normalized gas density, i.e., . Note that the gas surface density exponent, 1.5, was obtained from the best model of CMG97 in order to ensure a good fit to the observational constraints at the solar vicinity. This value then turned out to be in very good agreement with observational results by Kennicutt (1998) and with N-body simulation results by Gerritsen & Icke (1997).
The efficiency of star formation is set to be =1 Gyr-1 to ensure the best fit to the observational features in the solar vicinity, and becomes zero when the gas surface density drops below a certain critical gas threshold (Kennicutt 2001). We adopt a threshold density 7 pc-2 in the disk (CMG97). As far as the halo/thick-disk phase is concerned, a similar value for the threshold is expected (see Elmegreen 1999). The IMF is that of Scalo (1986), assumed to stay constant during the evolution of the Galaxy (see Chiappini, Matteucci & Padoan 2000). In particular, here we adopt Model A of CMR2001 which assumes that the total halo/thick-disk mass density profile is constant for 8 kpc and decreases as outwards.
This model provides a very good fit to the G- and K-dwarf metallicity distributions in the solar vicinity (Kotoneva et al. 2002) and requires a timescale for the formation of the disk in the solar neighbourhood of 7 Gyr. The model also provides a good fit to the present time star formation rate, surface gas density, SN rates as well as abundance gradients, gas and stellar distributions along the disk (see CMR2001).
3.2 The chemical evolution model for dwarf irregular galaxies
The evolution of dwarf irregular galaxies is often assumed to be characterized by a bursting star formation history. These low-mass systems are particularly sensitive to outflows resulting from the energy injection from the SN explosions. Moreover, they could also suffer infall from the extended neutral gas envelopes often observed around such galaxies (see for example Matteucci and Chiosi 1983).
In this work we adopt a model based on the work of Bradamante et al. (1998) and take into account the recent chemodynamical results by Recchi et al. (2001). In particular, we adopt the best prescription for the energetics given in Recchi (2001) and Recchi et al. (2001): we assume a low thermalization efficiency for type II SNe () and a maximun value for SNeIa (); for the stellar winds we adopt a thermalization efficiency of . Infall is also considered with a timescale =5 108 yr and primordial chemical composition. An important result found by Recchi et al. (2001), with the above prescriptions, is that the ejecta of type Ia SNe and intermediate-mass stars are lost from the parent galaxy more easily than type II SN ejecta, so that the Fe and N ejection efficiencies are larger than the ejection efficiencies of the -elements (e.g. O, Mg).
The assumed model parameters are: a total luminous mass at the present time of 10, a dark to luminous matter ratio of 10 (which is rather a standard value for BCGs as well as for IZw18 - see Recchi 2001). We adopt the same nucleosynthesis prescriptions as in the best model for the Milky Way (model 6, see next section). Moreover for these dwarf starbursting galaxies we adopt a slightly flatter IMF, as often suggested in the literature, especially for the more metal-poor galaxies such as IZw18 (Aloisi et al. 1999), with an exponent of x=1.1 (for comparison, the Salpeter IMF by mass has x=1.35).
3.3 The chemical evolution model for M101
CNO abundances have been measured in a significant sample of spirals (Thurston et al. 1996; Garnett et al. 1997a; Ferguson et al. 1998; van Zee et al. 1998a,b; Garnett et al. 1999). This allows us to test the nucleosynthesis yields which successfully explain the CNO observations in stars of our own Galaxy against observations in others late-type galaxies.
We construct a chemical evolution model suited to follow the evolutionary history of a spiral galaxy more massive than the Milky Way, taking M 101 as a template. M 101 is assumed to form out of two main infall episodes, similarly to what happens for the Milky Way. The first infall episode forms the bulge, inner halo and thick disk substructures on a very short time-scale ( = 0.7 Gyr). During the second infall episode the thin disk is formed, mainly through accretion of external matter of primordial chemical composition. The disk forms in an “inside-out” way, as in the case of the MW. The adopted timescales are = 1, 2.5, 5.5, 13 Gyr at a radius = 2, 4, 8, 18 kpc, respectively (see detailed discussion in Section 4.2). These timescales have been chosen in order to reproduce the abundance gradients and the gas distribution along the disk of M101. The efficiency of star formation, , the exponent of the star formation law, , and the threshold in the gas density below which the star formation stops are the same as for our own Galaxy. What changes with respect to the MW model is the value of the central mass surface density at the present time and the value of the disk scale-length in the disk exponential law ( = ; here = 5.4 kpc rather than 3.5 kpc, which is the value adopted for the MW).
The value of is very uncertain. The disk surface brightness at R2 kpc ( 1 arcmin) of M101 in the B band is 21.45 mag/arcsec2 according to Okamura et al. (1976). For the solar neighborhood, we have a surface brightness of the order of 23.8 mag/arcsec2 (Van der Kruit 1986), which corresponds to a stellar density of 40 M⊙/pc2 (see CMR2001). This means that the central surface brightness of M101 is about 2.5 magnitudes brighter than the solar neighborhood, which is about a factor of 10. This would give a central surface mass density of around 400 M⊙/pc2 at around 2kpc, implying a 600 M⊙/pc2. Given the uncertainties in this value we run models for = 600, 800 and 1000 M⊙/pc However, as we will see in the next section, this value does not affect the abundance ratios.
The observed H I and H2 profiles are taken from Kenney et al. (1991), where a distance of 5.5 Mpc for M 101 is assumed. The theoretical present-day gas density distribution critically depends on the assumptions on the gas density threshold (), time-scales of disk formation and central mass density. The gas density profile in the external parts of M101 is practically determined solely by the choice of . On the other hand, the inner profile strongly depends on the assumed value and time-scale of thin-disk formation.
4 Results
4.1 The Milky Way
4.1.1 The Solar and the Interstellar Medium Abundances
The solar abundances should represent the chemical composition of the ISM in the solar neighbourhood at the time of Sun formation (4.5 Gyrs ago). The standard assumption is that since the time of the Sun formation the ISM was further enriched in several chemical elements. However, as often discussed in the literature, the abundance of oxygen in the Orion nebula is smaller by a factor of 2 than the solar value of Anders and Grevesse (1989) (see for example Cunha and Lambert 1992), at variance with the increase of the metal abundances in the Galaxy with time as predicted by many chemical evolution models. This fact, together with the abundances in other HII regions and B stars, led to the view that the Sun was enriched relative to the ISM, a possibility being that the Sun was born in a region closer to the Galactic center and then moved to its present position (Wielen et al. 1996).
Recently this situation has changed. The updated solar O abundance by Holweger (2001) and Allende Prieto et al. (2001) does not require to have a subsolar standard abundance for the present time ISM. As can be seen in Tables 3 and 4, when considering the revised photospheric oxygen abundance obtained by Holweger (2001) and comparing it with the Orion oxygen abundance (corrected for dust) given by Peimbert (1999), the ISM and Sun values are the same within the rms scatter. The same is true for the young F- and G-type stars (Sofia & Meyer 2001). Moreover, the often reported discrepancy among the Sun and B-star abundances could be due to the details of the evolution of the B stars themselves. In fact, Sofia & Meyer argue that B stars may not offer a good measure of the ISM metallicity because processes of sedimentation and/or ambipolar diffusion, occurring during their formation, could lower their refractory abundances. This is confirmed by the recent work by Daflon et al. (2001), where a sample of B stars with high rotational velocities show a systematically lower abundance value when compared with HII regions and with the predictions of chemical evolution models. This does not seem to be the case for F- and G-stars which in principle are not greatly affected by refractory depleting processes (Sofia & Meyer 2001).
The predicted abundances of C, N, O, Fe, Ne, S, Si and Mg 4.5 Gyrs ago (to be compared with the solar values) and at the present time (to be compared with recent data on the present abundances in the ISM) are shown in Tables 3 and 4, respectively, for all the models of Tables 2a,b.
If the solar and the ISM values are similar, chemical evolution models should be able to explain this constraint. The similarity between the solar abundances and the ISM ones could be indicating that the evolution of the solar vicinity in the last 4.5 Gyr was very slow. In our models (as well as in CMG97 and CMR2001), the last 4.5 Gyr of evolution of the solar vicinity are dominated by an oscillatory behavior of the star formation rate owing to the presence of the gas density threshold for the star formation. This is the case of all models of Tables 2a and 2b, except for model 9. Model 9 was computed with the same parameters as model 6 but with the assumption of no threshold in the star formation process in the disk. As can be seen in Table 3, models 6 and 9 give the same results at the time of the Sun formation, whereas model 9 predicts larger abundances for the ISM at the present time (Table 4) compared to the ones predicted by model 6. In particular, model 6 predicts only a small increase of the elements produced by massive stars, from the time of Sun formation up to now and is in agreement with the observed constancy of the oxygen abundance in the last 4.5 Gyr.
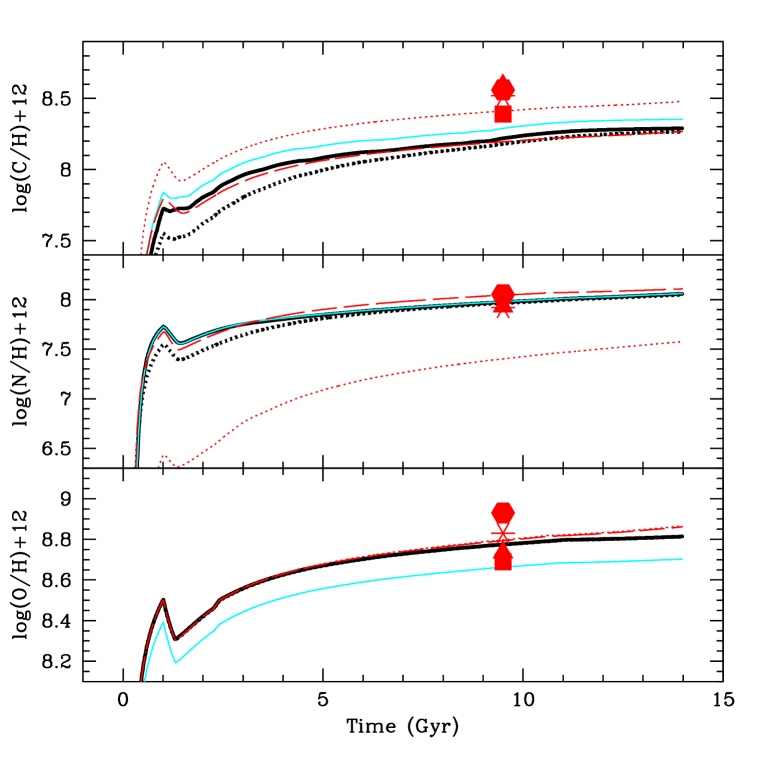
Figures 2 and 3 show the evolution in time of C, N, O, N/O and C/O for some of the models of Table 2a. The solar values obtained by Holweger (2001), Grevesse & Sauval (1998), Grevesse et al. (1996), Anders & Grevesse (1989) and Allende Prieto et al. (2001, 2002) are also shown. In Figure 2 (upper panel) we show those models in which the carbon yields in massive stars were not modified (model 1: thin dotted line, model 2: thin long-dashed line, model 3: thick dotted-line, model 4: thick solid line and model 5: thin solid line). As can be seen, all models predict a solar value which is a little below the observed ones. Model 1 (with RV yields for the case =0) predicts a larger carbon as in this case HBB is not operating. However, this model predicts a too low nitrogen abundance (Figure 2 - middle panel), thus showing the necessity of considering some HBB in AGB stars. In Figure 2 (lower panel) we note that model 5 (thin solid line) predicts a lower oxygen value, but still consistent with the recent measurements of Holweger (2001) and Allende Prieto et al. (2001).
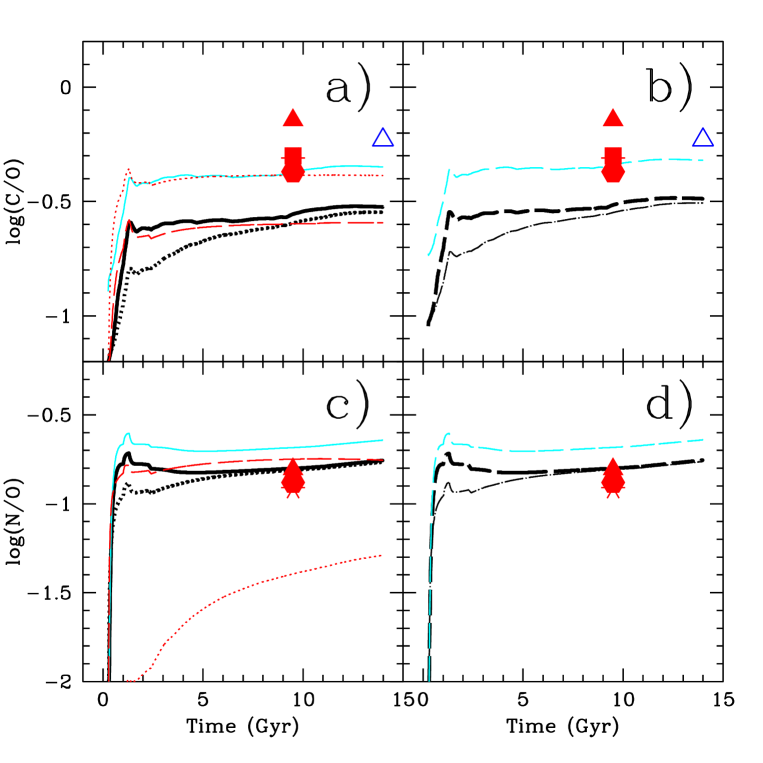
In Figures 3a and 3c we show again models 1 to 5 (curves are as in Figure 2). All these models, but model 1, reproduce the solar N/O ratio, whereas almost all models predict a solar C/O ratio which is a little lower than the observed one. In Figure 3b we show models 3a (dot-dashed line), 6 (long-dashed thick line) and 7 (long-dashed thin line). Models 3a, 6 and 7 are analogous to models 3, 4 and 5, respectively, but with carbon yields in stars with masses in the range of 40-100 M⊙ multiplied by a factor of 3 (notice that in the diagram N/O vs. O/H models 3, 4 and 5 are identical to models 3a, 6 and 7, respectively, as only the carbon yields were modified). Model 7 is in good agreement with the observations. This is due to the fact that WW yields predict less oxygen than TNH ones (see Figure 2 - lower panel). Model 6 is in reasonable agreement with the observed value if we consider the uncertainties involved both in the data and in the stellar yields for C. In fact, two large uncertainties play an important role in this plot: a) the solar value is very uncertain for carbon (see the different solar measurements plotted in this figure - big square, triangle, star and pentagon) and b) the yields of vdHG were computed with a large parameter (they adopted, at solar metallicities, =4 while in RV this value was =0.33). If the mass loss in AGB is overestimated, the C production is also underestimated. In Figure 3b this can be clearly seen as the middle curve (model 6), computed with a variable parameter at low metallicities (=1 for Z=0.001 and =2 for Z=0.004), shows a larger carbon abundance in the first billion years of the evolution of the solar vicinity than model 3a, computed with 4 at all metallicities.
In fact, as shown in Table 1, although the yields of vdHG for the case of variable predict a decrease in the integrated C yield as the metallicity increases, reaching a value lower than the one predicted by the models of RV with 1.5 at solar metallicity, the predicted C yields at low metallicities are larger by a factor of 10. This suggests that 2, assumed in vdHG calculations, is too large and that a lower value should be preferred (in agreement with the result of Diaz & Tosi 1986).
Finally, we notice that Mg seems to be underestimated by all models (see Table 3). The fact that current stellar evolution models for massive stars underestimate the Mg yields is a well known problem (see Chiappini et al. 1999 and Thomas et al. 1998 for a discussion).
Table 3. Solar abundances by number in log(X/H)+12 (∗ at 4.5 Gyrs ago). Model C N O Fe Ne S Si Mg 1 8.41 7.40 8.80 7.46 7.74 6.99 7.46 7.27 2 8.19 8.04 8.79 7.46 7.74 6.99 7.46 7.27 3 8.18 7.96 8.77 7.46 7.74 7.00 7.47 7.28 3a 8.22 7.96 8.77 7.46 7.74 7.00 7.47 7.28 4 8.22 7.97 8.77 7.46 7.74 7.00 7.47 7.28 5 8.29 7.98 8.66 7.51 7.81 7.11 7.53 7.15 6 8.26 7.98 8.77 7.46 7.74 7.00 7.47 7.28 7 8.32 7.98 8.66 7.51 7.81 7.11 7.53 7.15 8 8.26 8.06 8.77 7.46 7.74 7.00 7.47 7.28 9 8.26 7.97 8.77 7.46 7.74 7.00 7.47 7.28 Data H2001 8.59 0.11 7.93 0.11 8.74 0.08 7.45 0.08 7.54 0.05 7.54 0.06 AP0102 8.39 0.04 8.69 0.05 GS98 8.52 0.06 7.92 0.06 8.83 0.06 7.50 0.05 7.20 0.06 7.56 0.01 7.58 0.06 G96 8.55 0.05 7.97 0.07 8.87 0.07 7.50 0.01 7.20 0.04 7.56 0.01 7.58 0.06 AG89 8.56 0.04 8.05 0.04 8.93 0.03 7.51 0.01 [8.09] 7.27 0.05 7.55 0.02 7.58 0.02
H2001 - Holweger (2001), AP0102 - Allende Prieto et al. 2001, 2002, GS98 - Grevesse & Sauval 1998, G96 - Grevesse et al. 1996, AG89 - Anders & Grevesse 1989
Table 4. ISM abundances by number in log(X/H)+12 (∗ at t=tnow).
Model
C
N
O
Fe
Ne
S
Si
Mg
1
8.48
7.58
8.87
7.61
7.76
7.09
7.53
7.30
2
8.27
8.11
8.86
7.61
7.76
7.09
7.53
7.30
3
8.27
8.05
8.81
7.62
7.78
7.10
7.55
7.31
3a
8.31
8.05
8.81
7.62
7.78
7.10
7.55
7.31
4
8.29
8.06
8.81
7.62
7.78
7.10
7.55
7.31
5
8.35
8.06
8.70
7.65
7.84
7.20
7.61
7.19
6
8.33
8.06
8.81
7.62
7.78
7.10
7.55
7.31
7
8.38
8.06
8.70
7.65
7.84
7.20
7.61
7.19
8
8.32
8.14
8.81
7.62
7.78
7.10
7.55
7.31
9
8.34
8.09
8.85
7.63
7.81
7.12
7.57
7.35
Data
FUSE-ISM (M2002)
8.5-8.55
Young F & G (SM01)
8.55
8.65
7.45
7.60
7.63
HST-ISM (M9798)
7.88
8.50-8.70
Orion (P99)
8.49 0.12
7.78 0.08
8.72 0.07
7.48 0.15
7.36 0.20
M2002 - Moos et al. 2002; SM01 - Sofia & Meyer 2001; M9798 - Meyer et al. 1997, 1998; P99 - Peimbert 1999
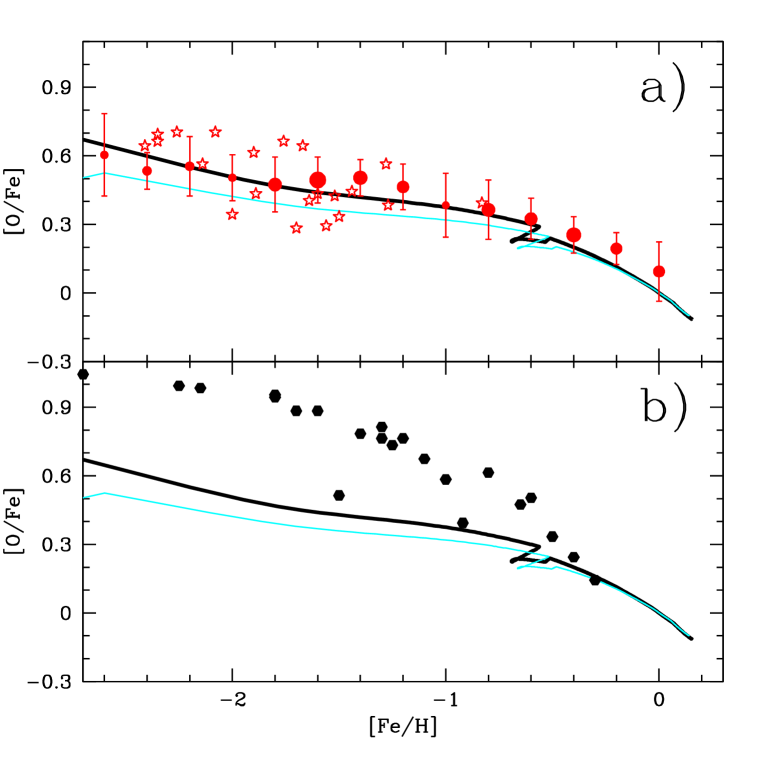
4.1.2 The [O/Fe] versus [Fe/H] plot
It is worth noting that the two-infall model provides a good fit of the [/Fe] versus [Fe/H] relation in the solar vicinity, as shown in Chiappini et al. (1999). Here we show the plot of [O/Fe] versus [Fe/H] which clearly indicates the existence of a gap in the SFR occurring at the end of the halo/thick-disk phase and before the thin-disk formation. This gap is observed in the data as pointed out by Gratton et al. (2000). In fact, if there is a gap in the SFR we should expect both a steep increase of [Fe/O] at a fixed [O/H] and a lack of stars corresponding to the gap period (see discussion in CMR2001). This gap, suggested also by the [Fe/Mg] vs. [Mg/H] diagram of Fuhrmann (1998), in our models is due to the adoption of the threshold in the star formation process coupled with the assumption of a slow infall for the formation of the disk.
Another interesting point concerning the abundance ratios that can be understood using the particular case of [O/Fe] is discussed below. Israelian et al. (1998) performed a detailed abundance analysis of 23 unevolved metal-poor stars and found that the [O/Fe] ratio increases from 0.6 to 1.0 dex between [Fe/H] 1.5 and 3 dex. In that paper the abundances were determined using high-resolution OH bands in the near UV (easier to observe in low-metallicity stars). Their result led to a controversy, as a linear run of [O/Fe] with metallicity is difficult to conciliate with the basic ideas on the roles of type Ia and type II SNe in the ISM enrichment (Matteucci & Greggio 1986; Matteucci & Chiappini 2001) as well as with measurements made by other groups (e.g, Fulbright & Kraft 1999, Sneden & Primas 2001, Nissen et al. 2001, 2002).
Meléndez et al. (2001) obtained high-resolution infrared spectra in H-band in order to derive oxygen abundances from IR OH lines and found that for a sample of stars in the 2.2 [Fe/H] 1.2 range, [O/Fe] 0.4 0.2 dex with no significant evidence for an increase of [O/Fe] with decreasing metallicity. The same behavior is seen in the compilation of Gratton et al. (2000), where O is measured from the [OI] 6300 which is known to be the most reliable way to estimate oxygen abundances (Lambert 2001). Moreover, Asplund & Garcia Pérez (2001) show that traditional 1D LTE analyses of the UV OH lines can overestimate the [O/Fe] ratio and that when adopting 3D analyses the results from UV OH lines become consistent with the one obtained from oxygen forbidden lines. Note also that Nissen et al. (2002) predict that derivations of oxygen abundance from [OI] 6300 line also should lower at low metallicities in hot stars. The effects on cooler giants should be less important, but no calculations are available at the moment.
In a more recent paper, Meléndez & Barbuy (2002) publish new oxygen abundances again obtained from infrared OH lines with 10m Keck Telescope. Moreover, Meléndez & Barbuy show a compilation of the best measurements (see details in section 4.2 of Meléndez & Barbuy) so far published in the literature. They included only abundance data obtained from the oxygen [OI] forbidden line (Figure 4a - the stars show the data of Meléndez & Barbuy 2002 in the infrared, the dots show their compilation of oxygen data from the literature, where the size of the full dots represents the number of stars in each bin of 0.2 dex in [Fe/H]).
The data for oxygen, taken from Meléndez & Barbuy (2002) (Figure 4a) show a slight increase of the [O/Fe] ratio with decreasing [Fe/H], at variance with what happens for other -elements which show a flatter behavior. This slight slope is well reproduced by theoretical models (Chiappini et al. 1999, CMR2001 - models 4 and 5) owing to the fact that the O/Fe ejected by a massive star at the end of its evolution is an increasing function of the initial stellar mass (see figure 2b of CMR2001). As a consequence, even before the contribution of SNe Ia to the iron enrichment, the O/Fe ratio already decreases due to the different ejected quantities of O/Fe by massive stars of different masses. The main change in slope occurs at [Fe/H]0.6 dex and corresponds to the time at which the type Ia SN rate in the disk reaches a maximum, roughly 1 Gyr after the gap (see also Matteucci and Recchi 2001).
On the other hand, our predictions for the [O/Fe] ratio, especially at very low metallicities, are not in agreement with the claims of a linear rising of this ratio with decreasing [Fe/H] obtained from UV OH lines (Figure 4b). These measurements are systematically larger than the samples shown in Figure 4a and are not reproduced by our model.
4.1.3 The log(C/O) vs. log(O/H) plot
By adopting the yields discussed before (with no mass loss from massive stars), we can explain the increase of the C/O abundance ratio as a function of metallicity as follows: both 16O and 12C are primary elements, but 12C is mainly restored into the ISM with a time delay by intermediate-mass stars and hence on longer timescales compared to the 16O enrichment, which comes mainly from massive stars.
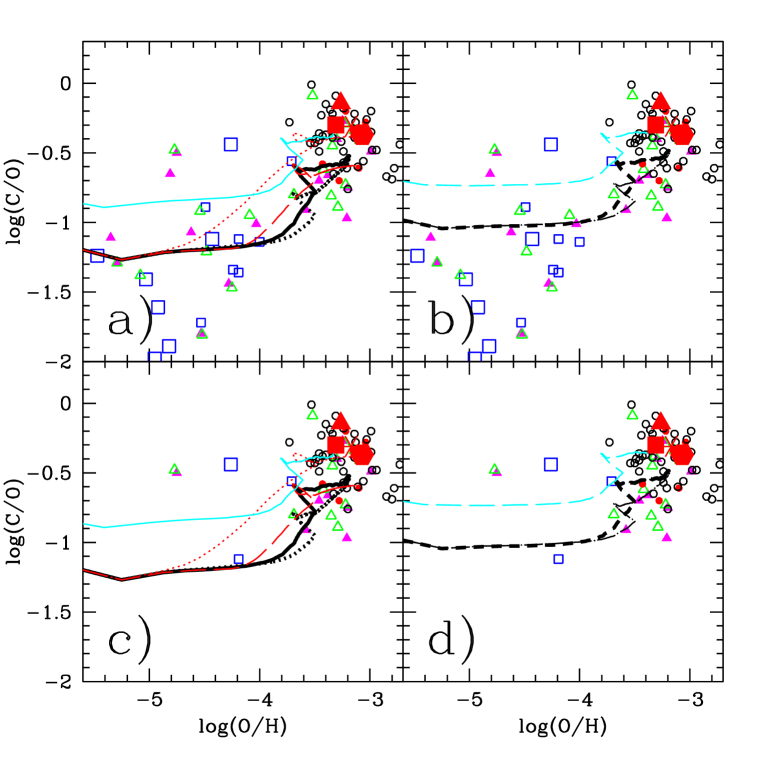
In Figure 5 we show our model predictions for log(C/O) vs. log(O/H) and compare them with the available abundance data for the solar vicinity. Carbon abundances can be obtained from the CH lines in the blue and ultraviolet (UV), infrared CO emission, red and near-infrared CI lines and [CI] forbidden lines. The [CI] line is less dependent on the effective temperature than the CI and CH lines. However, the [CI] line can be very faint and difficult to measure at low metallicities. In fact, both the [CI] and CI lines become extremely weak in metal-poor stars (already at [Fe/H] 1) (see Carretta et al. 2000 for a detailed discussion on this element). Here we will consider the more recent measurements of Meléndez et al. (2001) (small open squares), Meléndez & Barbuy (2002) (big open squares), the reanalysis of data by Edvardsson et al. (1993) done by Carretta et al (2000) (open circles) and the data of Carretta et al. (2000) (oxygen values obtained as the mean of the abundances obtained with [OI] and OI oxygen lines - open triangles - from only [OI] measurements - filled triangles). The lack of data at low metallicities is striking. Moreover, we can see a large spread at low metallicities. Some of the stars at low metallicities show enhanced C abundances due to internal mixing processes. To avoid these objects we plot in Figures 5c and 5d only dwarf stars (i.e., objects with 3.5).
Panels a) and c) show our model predictions for models 1 to 5, while in panels b) and d) we show the predictions of models 3a, 6 and 7 (see Table 2a). The first thing to notice is that the effect of the gap in the star formation is also seen in this plot. The confirmation of a gap in the star formation in such a plot would be another evidence in favor of the interpretation that most of the C we see today in the ISM comes from low- and intermediate-mass stars. In fact, if C were produced mainly in massive stars, as suggested by Prantzos et al. (1994), we would not expect to see any gap in such a plot, as both O and C would depend “linearly” on the SFR. This figure also shows that models adopting WW yields predict a larger C/O ratio (as WW models have more C and less O than the TNH ones - see Table 1).
We expect the effect of considering stellar yields including mass loss in massive stars in chemical evolution models to be mild. According to stellar models with mass loss, the C enrichment of the ISM from massive stars starts to be important only at large metallicity regimes. However, at this point, low- and intermediate-mass stars also contribute to the ISM enrichment in C and, as they are more numerous, their contribution will certainly be dominant. Moreover, as discussed before, the new calculations of Meynet & Maeder (2002b) point to a less important effect due to mass loss. Note, however, that rotation could increase the C yields which would shift our curves upwards in Figure 5. At this point we call attention to the fact that it is not correct to plot the integrated stellar yields on diagrams of this kind (as done in Meynet & Maeder 2002b - their Figures 20 and 21) as this could lead to wrong interpretations. Chemical evolution models which take into account properly the stellar lifetimes have to be used. This is of fundamental importance in order to understand which are the stars playing an important role in the ISM enrichment at different metallicities.
Finally, in Table 3 it can be seen that models for which the C yields are artificially increased (e.g. model 7) are in better agreement with the solar abundance. The need for increasing the C yields in massive stars was already noticed by Henry et al. (2000), who increased the yields by the same factor.
4.1.4 The [C/O] vs. [Fe/H] and [C/Fe] vs. [Fe/H] plots
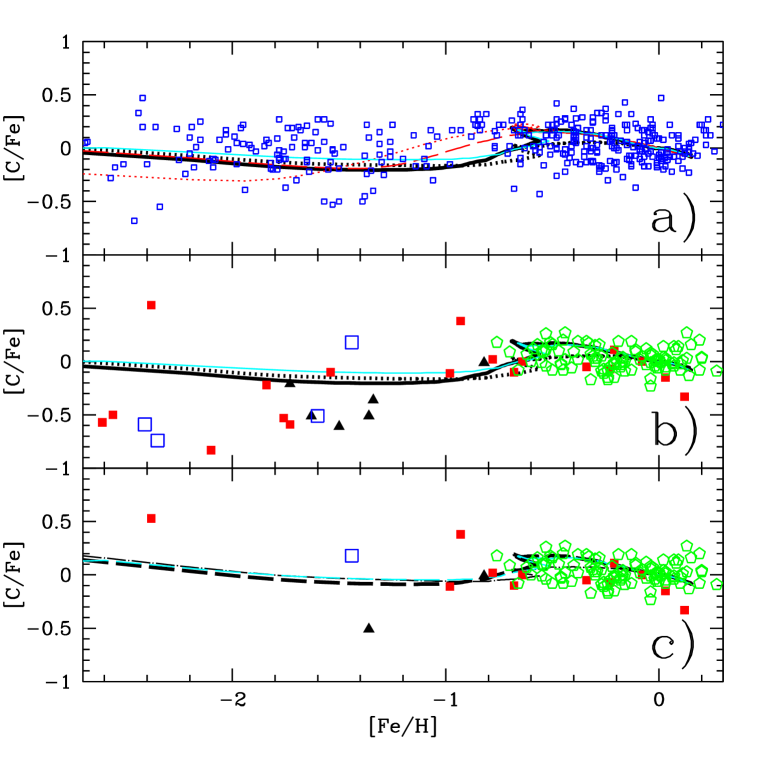
The study of the evolution of C/O cannot be disentangled from the analysis of the [C/Fe] vs. [Fe/H] diagram since this latter represents an equally important and independent constraint on the evolution of the C abundance.
Figure 6a shows the plot of [C/Fe] vs. [Fe/H] for models 1 to 5 (Table 2a) compared with the data from the compilation of Chiappini et al. (1999) (open squares). The observations imply an essentially solar [C/Fe] ratio along the whole metallicity range in agreement with our model predictions. Figure 6b includes only the most recent abundance data by Carretta et al. (2000), Meléndez et al. (2001), and Meléndez & Barbuy (2002). In this case the data seem to show [C/Fe] 0 at low metallicities, exactly the opposite of what is suggested in Figure 6a. However, when only dwarf stars are plotted (Figure 6c), very few data points are left at low metallicities and most of the stars with low [C/Fe] ratios disappear (in this figure models 3a, 6 and 7 are shown). These stars probably suffered HBB and part of their carbon was burned into nitrogen, and hence their chemical composition cannot be used as a tracer of the ISM composition at the time the star was formed. If the trend shown in Figure 6 is confirmed and [C/Fe]0 for all metallicities, this indicates that C, as Fe, is ejected into the ISM on long timescales (at variance with the results of, for example, Carigi 2000, Henry et al. 2000, Liang et al. 2001). To better constrain the C production in massive stars, more data on C in dwarf halo stars are of fundamental importance.
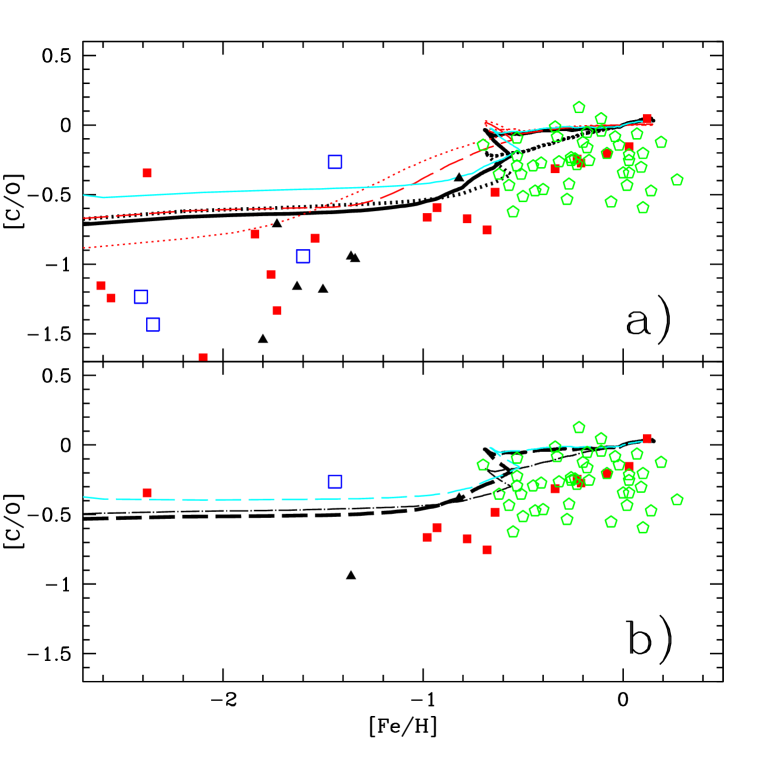
Figures 7a,b show the plot of [C/O] vs. [Fe/H]. In figure 7a we show the model predictions for models 1 to 5 listed in Table 2a. In this plot, as we did in Figure 6b, we also show only the best measurements for carbon (i.e., Meléndez et al. 2001; Carretta et al. 2000; and the reanalysis by Carretta et al. 2000 of the data of Edvardsson et al. 1993). Again, a large scatter is seen at low metallicities, which makes it difficult to constrain our models. In figure 7b only models 3a, 6 and 7 are shown, and only the dwarf stars are plotted. As can be seen in this figure, both models are in good agreement with the available data.
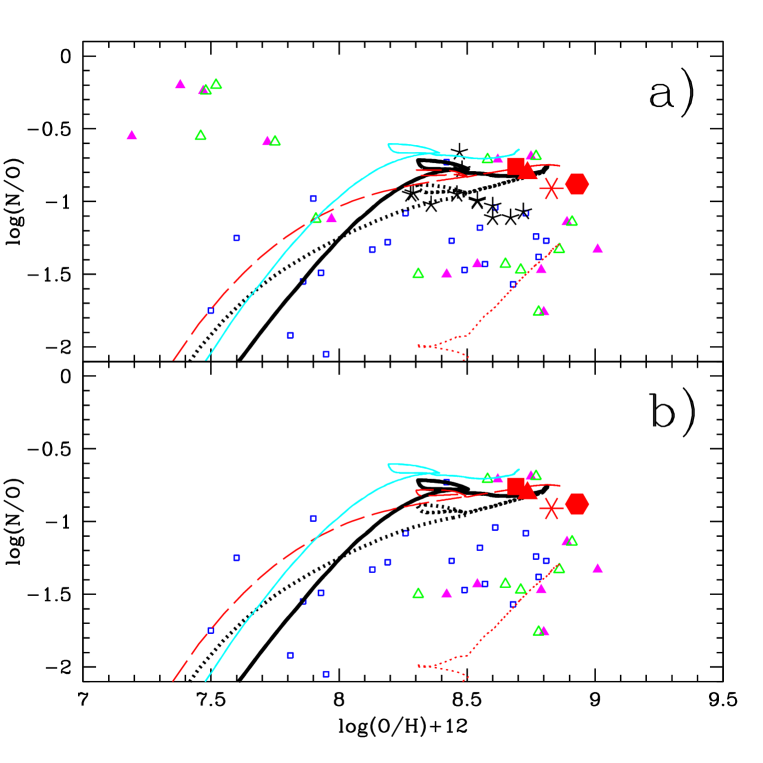
4.1.5 The log(N/O) vs. log(O/H) plot
In Figures 8a,b we plot log(N/O) as a function of log(O/H). The predictions of models 1 to 5 are shown. The lack of data in these plots is due to the fact that the abundances of N and O are measured simultaneously only for a few stars. We also included the data by Daflon et al. (2001) for B stars (stars). As discussed before, the B stars lie systematically below the predicted curves and the solar values, suggesting that processes like sedimentation and/or ambipolar diffusion took place in such stars (see Sofia & Meyer 2001 and discussion in Section 4.1.1). The solar abundances obtained from different authors are also shown (large square, triangle, star and hexagon). In Figure 8b, where we plot only dwarf stars, the data points at low metallicity disappear. In fact, those stars show both high N/O and low C/O ratios (see discussion of Figure 6 in the previous section), which suggest that they have suffered mixing processes during their evolution and are not suitable for this kind of analysis. In other words, the C and N values in giants are not representative of the halo composition at the time of their formation.
Figure 8 shows clearly the secondary behavior of N at low metallicities: the N/O ratio increases with oxygen until it reaches a plateau due to the primary N restored by low- and intermediate-mass stars. Finally, an interesting aspect of this plot is the existence of some stars with low N/O which lie near the prediction of model 1, computed with the stellar yields of RV for the case of no HBB (0). One possibility is that these stars did not suffer HBB, suggesting that HBB is not efficient in all intermediate-mass stars. It would be interesting to study the properties of these particular data points in order to better constrain both the lower-limit mass for HBB to operate and the HBB efficiency.
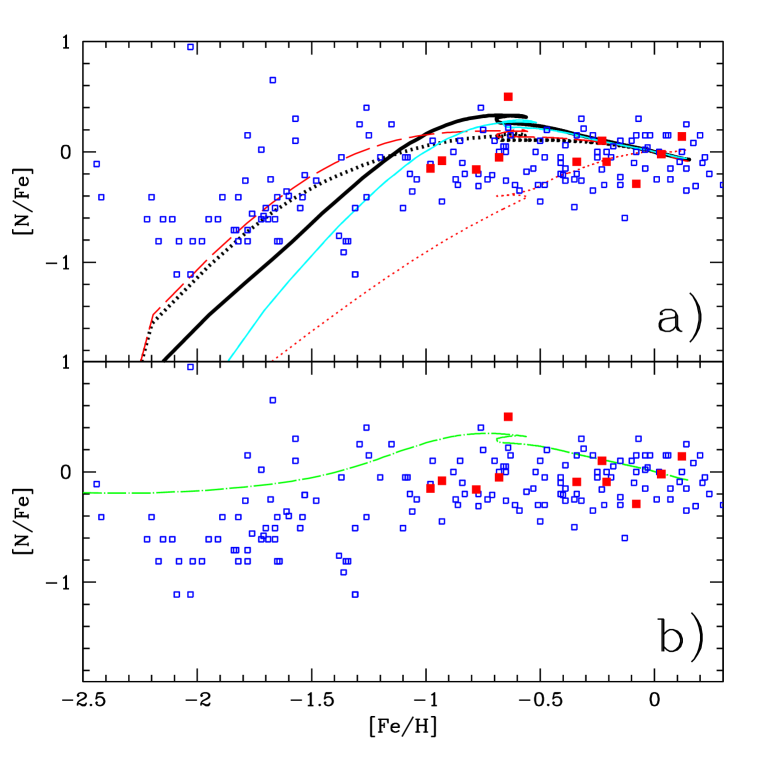
4.1.6 The [N/Fe] vs. [Fe/H] plot
Figure 9a shows the [N/Fe] vs. [Fe/H] plot. The open squares are from the sample studied in Chiappini et al. (1999). The data of Carretta et al. (2000) are also plotted (here we show only their measurements for dwarf stars - filled squares). Again a large scatter is seen in the data. Most of the points at low metallicities are from Laird (1985) and Carbon et al. (1987). These data sets were further corrected and offset to take into account errors in the temperature. Here we do not apply such a correction which was very uncertain (see Wheeler et al. 1989 for a discussion). Note that the effects of 3D hydrodynamical models would also lower the N derived from NH bands and, in principle, most of the data available in the literature should be considered as upper limits to the real N abundance value (Nissen, 2002).
From this figure it can be seen that N shows again the behaviour of a secondary element, especially at low metallicities (models 1 to 5). This fact should argue in favor of a secondary N production in massive stars. The [N/Fe] ratio increases with metallicity up to [Fe/H]1 and then flattens for larger metallicities in analogy with what happens from N/O. Therefore, by analyzing only the data available for the MW there is no need for invoking a primary N production in massive stars. In Figure 9b we show the prediction of model 8 where we adopt a large production of primary N in massive stars (see Table 2b). We can see that in order to be able to have a plateau in [N/Fe], as often suggested in the literature, a large amount of primary N from massive stars is needed (in model 8 – dash-dotted line – we assume a primary N yield from massive stars of 0.065 M⊙, constant with mass as suggested by Matteucci 1986). This amount is larger by roughly two orders of magnitude than the one predicted by recent theoretical models suggesting the existence of some primary N production in massive stars at low metallicities (Meynet & Maeder 2002a).
In summary: i) our results indicate that the N yields computed by vdHG predict too much primary N from intermediate mass stars at low metallicities. In fact, these yields were computed for a case of maximum HBB efficiency; ii) the MW data do not suggest the need of primary N production in massive stars. We also show that to obtain a flat behaviour of [N/Fe] vs. [Fe/H] the requested quantity of primary N from massive stars is much larger than the one computed by recent models. Our conclusions should hold also for all other kind of galaxies, as there is no reason for the nucleosynthesis to change. In Section 4.2 we will check the validity of this statement by analyzing other galaxies; iii) the flat behavior of [C/Fe] vs [Fe/H] clearly indicates that both C and Fe should come mainly from low- and intermediate-mass stars; iv) C yields in low- and intermediate-mass stars are underestimated at solar metallicities probably due to the large value of adopted by vdHG. Moreover, our models suggest that the C yields in massive stars (TNH and WW) should be increased by at least a factor of 3. This is in agreement with recent stellar evolution models taking into account rotation (Meynet & Maeder 2002b).
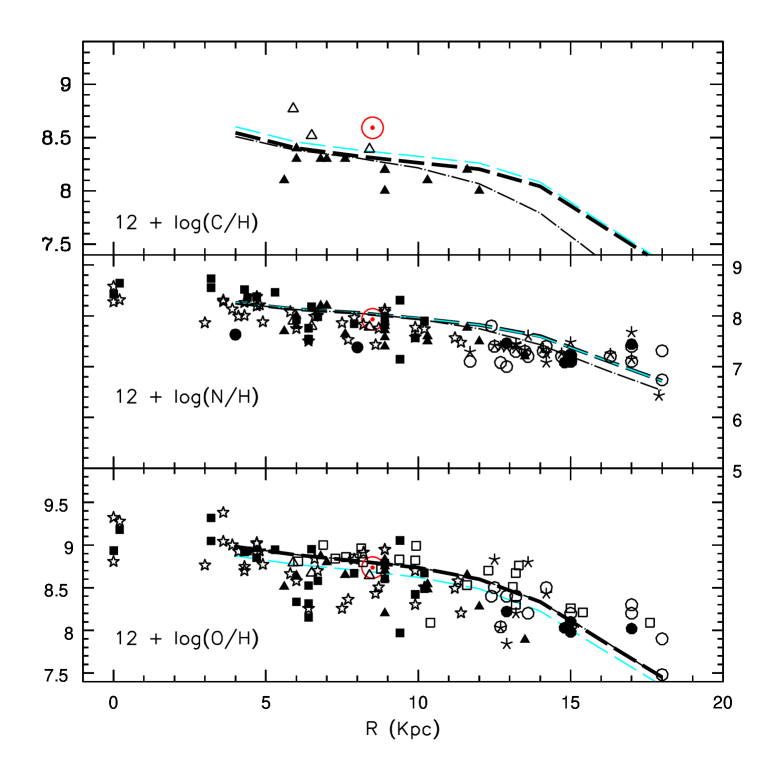
4.1.7 Abundance gradients of C, N and O in the Milky Way disk
Our prescriptions for the MW model outside the solar vicinity are the same as model A of CMR2001 (see also Section 3.1). Figure 10a shows the gradients of C, N and O predicted at the present time and compared with HII regions and B star data (see CMR2001 for details). Figure 10b shows the gradients of C/O, N/O and C/N, both predicted and observed. In those figures we plot models 3a (dash-dotted line), 6 (long-dashed thick line) and 7 (long-dashed thin line). The difference among models 6 and 7 is only on the stellar yields adopted for massive stars (TNH and WW, respectively), whereas models 6 and 3a differ on the adopted yields for low- and intermediate-mass stars (model 6 has variable with metallicity, while for model 3a is constant).
As can be seen in Figure 10a and 10b (upper panels), for C very few data are available (in Figure 10b the open triangles are the HII regions measured by Esteban et al. 1999, the open circles are the HII regions of Tsamis et al. 2002 and the black triangles are the data from Gummersbach et al. 1998 for B stars). B stars lie systematically below the HII regions.
As shown by Figure 10b (upper panel), models 6 and 7 predict the same behavior for the abundance gradient of C/O. The absolute value of the C/O abundance ratio is larger for model 7 (WW yields) than for model 6 (TNH yields). This is expected as WW yields produce more carbon and less oxygen than TNH ones (see Table 1). A more interesting effect can be seen when comparing the predictions of models 6 and 3a. These models differ only at low metallicities (where =1 for Z=0.001 and =2 for Z=0.004 for model 6, whereas for model 3a at these same metallicities =4) and hence differences should be seen only in the outer parts of the Galactic disk. As discussed before, lower values imply a larger production of carbon and this explains the larger C/O ratios obtained with model 6. Model 3a, instead, predicts a flatter behavior of the C/O ratio along the disk. Unfortunately abundance data are not available in the galactocentric distance range where the models differ.
The predicted N/O gradient for the MW is almost flat (Figure 10b - middle panel) and in good agreement with the observations. In the case of N, the stars which contribute most to the ISM enrichment at low metallicity are those suffering HBB (i.e., stars with masses larger than 4-5 ). These intermediate-mass stars start to contribute with a large amount of primary N already after 30 Myrs (the lifetime of an 8 star). In other words, the expected difference on the timescales of the enrichment of the ISM in N and O is small. This explains why the N/O ratio shows a flatter gradient than the C/O ratio. Finally, Figure 10b (lower panel) shows the predicted gradients of C/N. The flat C/N gradient predicted by model 3a is due to the fact that this model predicts less C in the outer parts of the Galactic disk (lower metallicities) than models 6 and 7.
4.2 External Galaxies
In this section we analyze the CNO data in other galaxies by using the chemical evolution models described in Section 3. For all the models discussed here the nucleosynthesis adopted is the same as model 6 (TNH yields for massive stars and vdHG for the case of variable).
4.2.1 Results for M101
For the Milky Way there is a clear lack of abundance data beyond 10-12 kpc from the Galactic center. In the case of external spiral galaxies it is possible to overcome this problem and measure the abundances of the far outermost HII regions, but there are still uncertainties. One of the main difficulties in measuring oxygen abundances in the outermost HII regions of spiral galaxies is to observe the [OIII] 4363 line, which is often not detected and which is very important to estimate the oxygen abundance. In most of the cases the oxygen abundance is rather estimated from the R23 calibration (Pagel et al. 1978; Edmunds & Pagel 1984). In this latter case, the degeneracy between the upper and lower branches of the log(O/H) vs. R23 relation has to be resolved by using other line ratios (see van Zee et al. 1998a; Ferguson et al. 1998). It is important then to keep in mind that for the outermost HII regions the oxygen abundance could be very uncertain (see discussion in van Zee et al. 1997).
To model the M101 galaxy, we adopt different values for the central total surface mass density, namely = 1000, 800 and 600 pc-2 together with a value of = 5.4 kpc for the disk scale-length (van Zee et al. 1998a). These are the fundamental parameters for this model and can in principle be inferred from observations, although the value of is very uncertain (Section 3.3). We notice that when adopting the scaling law suggested by Boissier and Prantzos (2000), we get a value for the central density of the M101 disk which is too low (in fact, this scaling law suggests that a more massive galaxy as M101 would be less concentrated and hence will have a lower central surface mass density value). Models with could not reproduce the observed total gas density profile even when allowing for different prescriptions for the SFR, IMF, etc. In summary, our first result with respect to M101 is that its central surface mass density should be larger than the one for the MW.
Once these parameters are fixed, the main free parameters still left are the infall timescales for the disk formation and their variation with galactocentric distance. These can be constrained by both the gas profile and the abundance gradients. From the study of the MW we know that the disk was formed inside-out and that the timescale for the disk formation is an increasing function of Galactocentric radius (CMR2001). Moreover, as shown by abundance data in other spiral galaxies, more massive galaxies show flatter gradients (Zaritsky et al. 1994) and have higher average interstellar abundances (Garnett et al. 1997a), thus suggesting that the more massive is the galaxy the faster is the collapse of the gas forming the disk. This means that the variation of the accretion timescale of gas onto the disk should be also a function of the galaxy mass (see Boissier & Prantzos 2000), in the sense that the most massive galaxies formed in the shortest timescale.
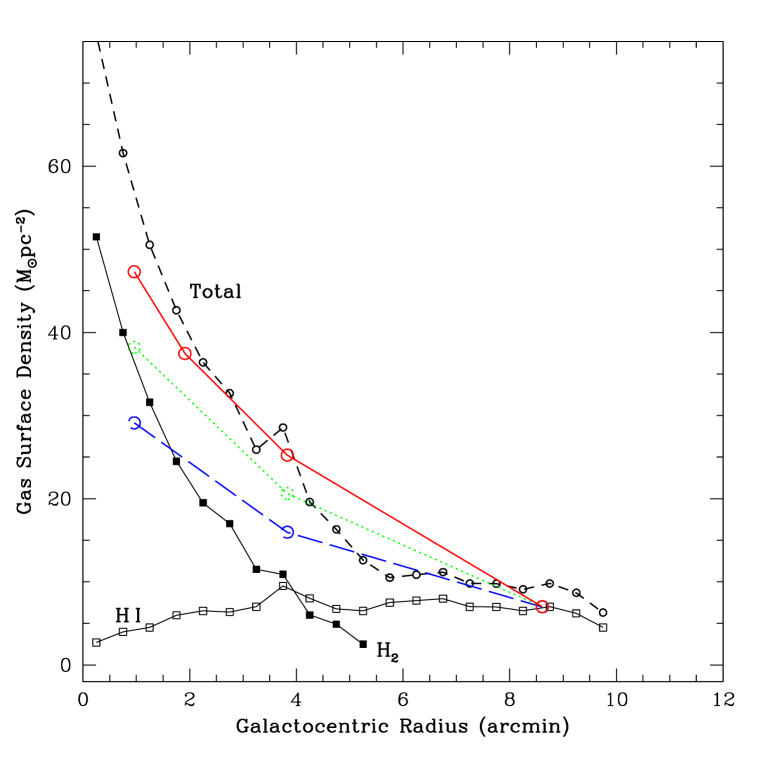
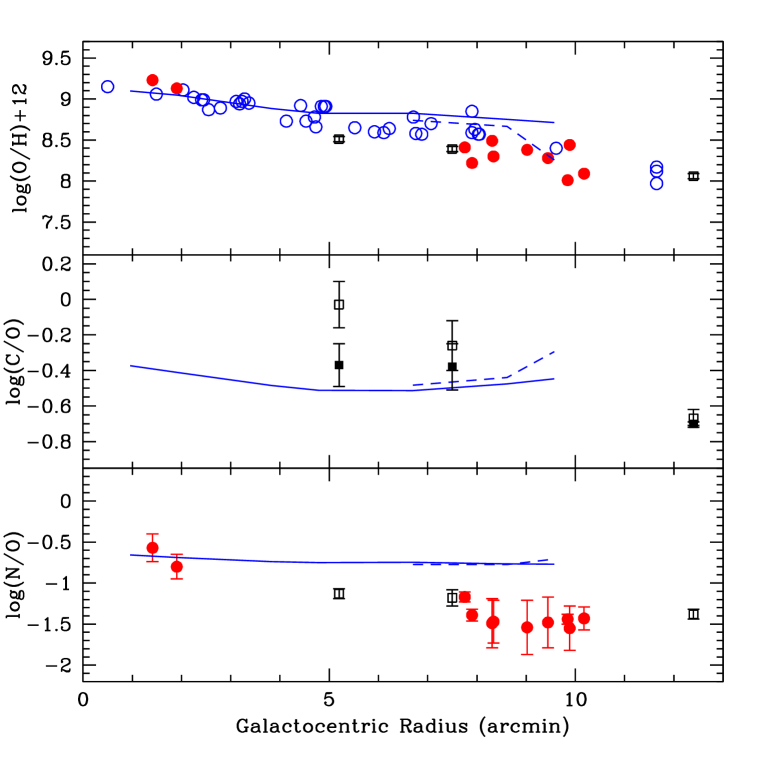
Figure 11 shows the observed gas profile for M101 (the total gas profile is shown by the short-dashed line - Kenney et al. 1991). Our predictions are shown for the models adopting different values of (solid line for =1000; dotted line for =800 and long-dashed line for =600). Although the gas profile depends upon several model parameters, it is more sensitive to the adopted total mass density profile and to the infall timescale of gas accretion onto the disk. The adopted values in this case are systematically lower than the ones of the MW, and the difference between the internal and external is smaller. In particular, we adopted , where R is given in kpc and in Gyr. Since we assumed the same for models with different values of , all of them give roughly the same values for the abundance ratios. The law for M101 was chosen to reproduce the abundance gradient of oxygen and to ensure a good fit to the total gas mass profile.
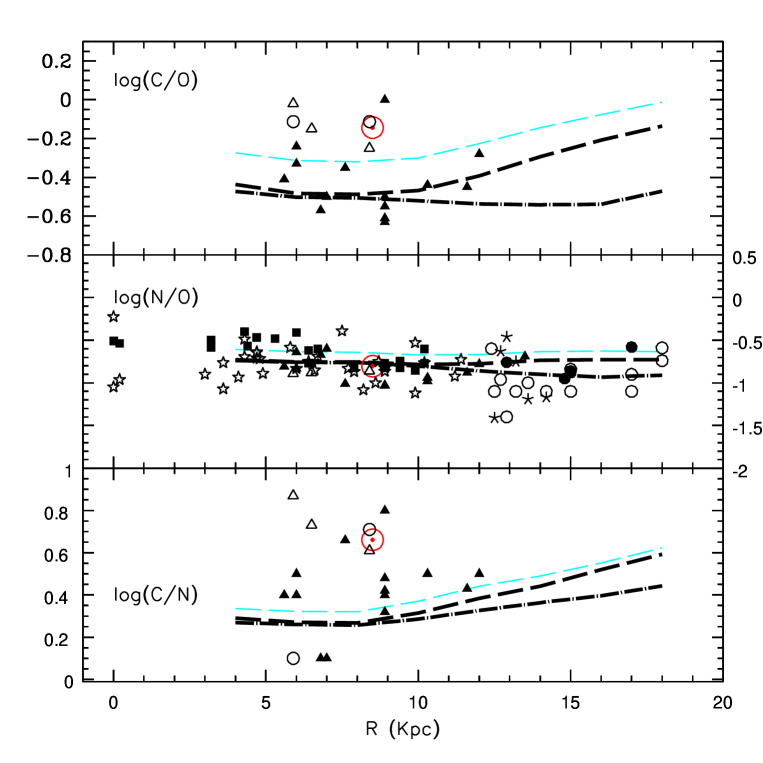
Figure 12 (upper panel) shows the gradient of oxygen measured by van Zee et al. (1998a), Kennicutt and Garnett (1996) and Garnett et al. (1999) together with our model predictions (here we show only the model with =1000). The model leads to a predicted oxygen gradient which is flatter than the observed one in the outer parts. The short-dashed line refers to essentially the same model, but here we adopted a larger threshold value (of 15 ) in the outer region (R 14 kpc). This last model provides a better fit to the observed oxygen abundance gradient being still in agreement with the observed gas profile. Figure 12 also shows the C/O and N/O gradients for M101 (middle and lower panel, respectively). As can be seen in this figure, our model is in good agreement with the C/O abundance ratio measured in the outer parts of M101 (at R15 kpc - filled square), while it probably predicts lower values than observed in the inner parts (there is only one measurement at R10 kpc for which the two values given by Garnett et al. 1999, depending on the adopted reddening correction, differ by more than .2 dex). This is again showing what we already discussed when analyzing the abundance data in the MW namely, that the C yields at solar metallicities are underestimated probably owing to an overestimated value of . In the lower panel of Figure 12 the opposite happens: the model predicts too large values of N/O in the outer parts and ensures a good fit of the abundance data in the inner parts. This last result suggests again that the primary N in intermediate-mass stars computed by vdHG is overestimated (see also Diaz & Tosi 1986).
Moreover, we notice that the outermost point of Garnett et al. (1999) is around 4.5 scale lengths from the center (R25 kpc). At such large distances the threshold in the star formation should be a dominant process, and our models predict that almost no star formation took place, and that low values for C, N and O abundances were produced. This would explain the low N/O, C/O and O/H values measured in the outer parts of M101.
In summary, the results for M101 suggest that: i) the nucleosynthesis adopted for the MW is suitable also for other spiral galaxies (we show here the particular case of M101 for which the gradients of both N/O and C/O are available); ii) also in this case there is an indication that the primary N coming from intermediate-mass stars could have been overestimated in the stellar models of vHG; iii) primary N production in massive stars would worsen our predicted N/O gradient which is already flatter than the observed one; iv) the threshold gas density in the star formation can explain the low abundance ratios measured in the outer parts of spiral galaxies. A threshold gas density value which increases towards the outer parts of spiral disks is suggested by our results.
| Model | number of bursts | time of burst occurrence | burst duration | |
|---|---|---|---|---|
| A∗ | 1 | 13.98 | 0.01 | 1.0 |
| B∗ | 1 | 13.98 | 0.01 | 2.5 |
| C | 1 | 6.0 | 0.01 | 2.5 |
| D∗ | 1 | 6.0 | 0.01 | 1.0 |
| E | 1 | 6.0 | 0.5 | 2.5 |
| F | 1 | 6.0 | 0.5 | 1.0 |
| G | 1 | 10.0 | 0.01 | 2.5 |
| H | 2 | 6.0/13.98 | 0.01 | 2.5 |
| I | 2 | 6.0/13.5 | 0.05/0.01 | 2.5 |
| J | 2 | 6.0/13.98 | 0.1/0.01 | 2.5 |
| K | 2 | 6.0/13.98 | 0.5/0.01 | 2.5 |
| L | 2 | 13.85/13.95 | 0.05 | 2.5 |
∗ Models that do not develop galactic winds
4.2.2 Results for dwarf galaxies
Carbon, nitrogen and oxygen data are available for dwarf irregular galaxies, also called extragalactic HII regions. These objects are interesting to study since they are relatively simple objects with low metallicities and high gas content. In particular, they are useful to study the abundances and abundance ratios at low metallicities. In the present work we consider the CNO abundance data from several sources (Garnett et al. 1995a,b; Garnett et al. 1997b; Izotov & Thuan 1999; Kobulnicky & Skillman 1996; van Zee et al. 1997; Kennicutt & Skillman 2001; Thuan et al. 2002). In Figures 13a and 13b we show the available data for N/O and C/O as a function of log(O/H), respectively.
The models for spiral galaxies do not apply in this case. As already extensively discussed in the literature, dwarf galaxies should have a bursting mode of star formation and they are likely to develop galactic winds. Moreover, infall of primordial matter is likely to happen in most of the cases as suggested by the large HI halos surrounding many of these objects. The main characteristics of these objects are the spread observed in their physical properties (Matteucci & Chiosi 1983).
For the dwarf irregular galaxies we adopted the chemical evolution model described in Section 3.2. A more detailed discussion about this kind of galaxies can be found in Recchi et al. (2001, 2002). The main free parameters in our models are shown in Table 5: the number of bursts, the time of occurrence of the bursts (in Gyr), the duration of the bursts (in Gyr) and the efficiency of the star formation (which also regulates the efficiency of galactic winds - in Gyr-1). We run several models which are represented in Figures 13a,b by letters. Some of the models in Table 5 do not develop galactic winds (namely, models A, B and D).
In all those models, the nucleosynthesis adopted is the same as in model 6 for the MW. In Figures 13a,b we show only the “end point” of each track and not the time evolution of the abundance ratios. The reason for this is that in these figures each observational point represents a different galaxy as seen at the present time and there is no information about time evolution. In other words, this diagram is not the equivalent of the N/O vs. O/H for the solar neighborhood stars where O/H can be interpreted as a time axis.
From Figure 13a it can be seen that the data for N/O show a flat trend with metallicity for a limited subsample of blue compact dwarf galaxies, whereas in galaxies with log(O/H)+12 7.6 there is a large scatter. This has been often quoted in the literature as a reason to believe that N could have a primary origin in massive stars (e.g., Izotov & Thuan 1999, Meynet & Maeder 2002b, and references therein). However, as it will be shown below, chemical evolution models of dwarf galaxies can explain the “high” N/O ratios measured in low-metallicity objects without the necessity to assume primary N contribution from massive stars (see also Henry et al. 2000). Moreover, the low number of objects with log(O/H)+12 7.6 so far observed challenges the idea of a “constant plateau” at low metallicities.
Our models indicate that objects suffering an initial burst in the past plus a more recent one, with a low star formation efficiency or, alternatively, just one burst whose age is long enough that intermediate mass stars have had time to restore their N into the ISM, tend to cluster around the N/O plateau (e.g. model C). On the contrary, the high metallicity and high N/O part of the plot tends to be populated by models in which more than one burst has occurred (e.g., model K). Moreover, the longer is the burst duration the larger is the final N/O abundance obtained (Models E, F and K). Those models are also in good agreement with the data in the log(C/O) vs. log(O/H) plot. We notice that one of the main requirements to fit both the C/O and N/O abundance ratios is that those galaxies are characterized by an IMF flatter than the Salpeter one. In fact, if a normal IMF is adopted, most of the models tend to predict too high N/O ratios.
Our main conclusions with respect to dwarf galaxies are summarized below. The large spread observed both in the N/O vs. O/H and C/O vs. O/H diagrams for oxygen abundances larger than 7.6 can be explained as due to different chemical evolution histories of different galaxies (i.e., different star formation efficiencies, different burst ages and different burst durations). Moreover, the time-delay in restoring N relative to O into the ISM is also a cause for the observed spread (Larsen et al. 2001). Once again we do not see the need for invoking primary N production in massive stars to explain the above data. The adopted yields from vdHG already predict a large primary N contribution from AGB stars. Objects with low oxygen abundances and high N/O ratios could have simply suffered a burst at least 30 Myrs ago (the lifetime of an 8M⊙ star), with a low star formation efficiency. Otherwise, they could be objects which had a previous burst of star formation, a long quiescent period and start now to have a second burst.
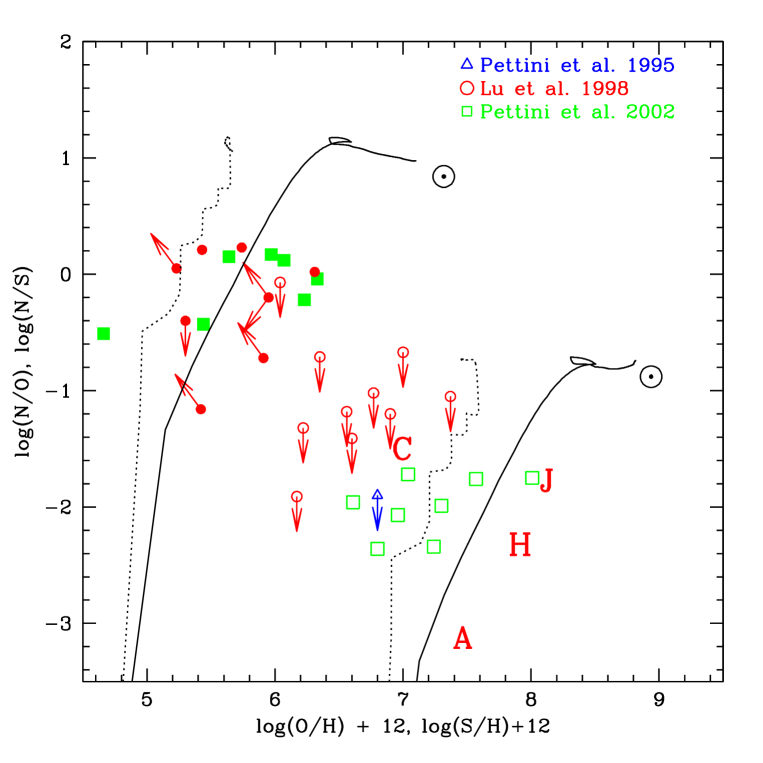
4.2.3 Comparison with observations in DLAs
In this section we compare our model predictions for two different regions of the MW and for dwarf irregulars with the abundance data of DLAs. In this paper we discuss only the N/O and N/S abundance ratios in DLAs. For a detailed discussion on all the other elements usually measured see Calura et al. (2002).
In Figure 14 we plot the recent data compilation by Pettini et al. (2002, 1995). Pettini et al. (2002) include DLAs which have relatively low values of hydrogen column density in order to increase the probability that the O I 1302.2 line is not strongly saturated (a known difficulty in this kind of analysis) and which are at relatively low redshifts (), where the Lyman line can still be clearly observed. The full sample described in Pettini et al. (2002) consists of 15 absorption systems in which the abundance of N has been measured (11 detections and 4 upper limits). In 8 of the 15 cases the abundance of oxygen is available directly, while in the other 7 cases S was measured and used as a proxy for oxygen (see also Molaro 2002).
In this figure we plot both N/O and N/S as a function of log(O/H)+12 and log(S/H)+12, respectively. The open symbols refer to oxygen while the filled symbols to sulphur data. The Sun location in terms of S and O is also shown. We also plot the points given by Lu et al. (1998). The solid curve is the model 6 prediction for the MW in the solar vicinity, for N/S (Figure 14, upper left) and N/O (Figure 14, lower right) as a function of S and O, respectively. The dotted curve is the model 6 prediction for an outer region (here we take the Galactocentric distance R 18 kpc). The letters A, C, H and J correspond to different models for dwarf galaxies (see Table 5).
Two important things can be noticed in this figure. The first one is that most of the N/O data fall below the so called “N plateau” defined by dwarf galaxies (log(N/O)1.5). These data show lower N/O ratios, favoring the time-delay model of N production from low- and intermediate-mass stars. This is in agreement with our previous conclusion that primary N production in massive stars should not be important.
The second thing is that our model predictions fit both the N/S and N/O ratios in the sense that our curves for the MW reach log(N/O)2 and log(N/S) after roughly 100 Myr after the SFR started. In particular, our model prediction for log(N/O) vs. log(O/H) for a galactocentric distance of 18 kpc is in agreement with the observations of Pettini et al. (2002) for oxygen (open squares in Figure 14). This suggests that those objects could be similar to the outer parts of the MW at early times (but see below). Notice that the often adopted procedure in the literature of converting the N/S observations into N/O values by adopting a solar log(S/O) would lead to a large scatter in the log(N/O) vs. log(O/H) plot. In fact, when computing a detailed chemical evolution model we see that S/O is not constant, especially at low metallicities. As in the case of O/Fe previously discussed (see Section 4.1.2), the S/O ratio varies with metallicity because i) the S/O ejected by massive stars varies with the initial mass of the progenitor star and ii) type Ia SNe contribute a non-negligible amount of S. Moreover, although the bulk of primary N contribution by low- and intermediate-mass stars takes 300 Myrs, an important amount of N is released into the ISM already after 30 Myrs (by the 8 stars). This could explain part of the scatter seen in the N/O ratios in DLAs.
These results suggest that DLAs have experienced little star formation up to the time they are observed. This is in agreement with the idea that a large fraction of such systems are either dwarf irregular galaxies or external parts of disk galaxies (see also Calura et al. 2002). In fact, there are essentially 4 ways of obtaining a low N/O at low metallicities: a) with an IMF which is flatter than a Salpeter one plus an inefficient star formation rate; b) that these systems are similar to outer disks where the star formation was essentially zero for most of their evolution due to the threshold and then started forming stars not before 100 Myrs (depending on the assumed IMF and stellar yields) since the time at which they are observed. In fact, in this case AGB stars have not had yet the time to restore their primary N into the ISM; c) that these objects are precursors of dwarf galaxies in which selective outflows took place, ejecting more N than O and thus lowering their N/O ratios or d) that DLAs are precursors of dwarf galaxies observed either in the burst or inter-burst phases. In this case the N/O ratio during the burst phase is lower than in the inter-burst phase, where only N is produced. However, the case of a very flat IMF can be excluded by the observed low /Fe.
5 CONCLUSIONS
We studied the evolution of the C, N, O and Fe abundances as a function of time and galactocentric distance in the Milky Way. In particular we computed the evolution of the C/O and N/O ratios, and obtained the abundance gradients of C/O, N/O and C/N in the disk by means of a chemical evolution model which reproduces the majority of the observational constraints in the Galaxy (CMG97, CMR2001).
From the comparison between observations and model results for the Milky Way we can draw the following conclusions:
-
•
Models for the MW adopting van den Hoek and Groenewegen (1997) yields for low- and intermediate-mass stars and Thielemann et al. (1996) for massive stars are well in agreement with the abundance data on metal-poor stars, in particular the data for [O/Fe] obtained from [OI] and IR OH lines;
-
•
We show that [C/Fe]0 over the whole [Fe/H] range clearly indicates that both C and Fe should come mainly from low- and intermediate-mass stars. This is at variance with the interpretation by several authors (e.g., Carigi 2000, Henry et al. 2000) that C should originate mainly in massive stars. This conclusion was based on the yields of Maeder (1992) which overestimate the effects of mass loss in massive stars. As shown by our good fit of [O/Fe] vs. [Fe/H], the yields of TNH are in good agreement with the observations, except for the fact that their C values should be increased by a factor of 3 for stars with M40M⊙. This is in agreement with the new calculations of Meynet & Maeder (2002) taking into account rotation.
-
•
A gap in the star formation rate between the thick and thin disk formation affects our model predictions for the C/O and/or N/O versus O/H plot. The existence of such a gap is already confirmed in [Fe/O] vs. [O/H] and [Fe/Mg] vs. [Mg/H] by observations (Gratton et al. 2000, Fuhrmann 1998). For the C/O and N/O versus O/H plot it is not possible to conclude the same from the few/uncertain available data.
-
•
The threshold in the star formation rate is responsible for the slow chemical enrichment of the solar neighborhood in the last 4.5 Gyrs which explains the similarity between the observed abundances in Orion and the Sun.
-
•
The [N/Fe] vs. [Fe/H] plot for halo stars show that N has a clearly secondary behavior at low metallicities thus implying that primary N production in massive stars is not important. Moreover, to obtain a solar [N/Fe] along the whole metallicity range, the required primary N is at least two orders of magnitudes higher than that predicted by the most detailed and up to date stellar evolution models (Meynet & Maeder 2002a).
-
•
Our model predictions for the abundance gradients of C, N and O are in good agreement with the observations. In particular, we obtain a gradient for N/O which is flatter than the one of C/O. This is mainly due to the important contribution of primary nitrogen from intermediate-mass stars suffering HBB. More data are necessary to better constrain the C/O gradient in the Galaxy.
When applying the “best” nucleosynthesis prescriptions to other galaxies we find that:
-
•
Again, there is no need for claiming the existence of an important primary N contribution from massive stars to explain the abundance data of dwarf galaxies, outer spiral disks or DLAs;
-
•
Models computed with TNH and vdHG yields can well reproduce the distribution of dwarf galaxies in plots such as log(N/O) and log(C/O) versus log(O/H)+12;
-
•
The nucleosynthesis adopted for the MW is also in agreement with what is observed in other spiral galaxies (we show here the particular case of M101 for which the gradients of both N/O and C/O are available). As for the MW, there is an indication that the primary N coming from intermediate-mass stars is overestimated and that C is underestimated at solar metallicities;
-
•
Invoking primary N in massive stars does not solve the problem of explaining the observed N/O gradient in M101. Instead, we suggest that the threshold in the star formation rate could explain the low abundance ratios at large galactocentric distances.
-
•
Our predictions for the abundance gradients of N/O, C/O and C/N are also compatible with the idea that most of the C and N we see today in the ISM comes from low- and intermediate-mass stars.
-
•
Our model for M101 suggests that the threshold in the gas density should increase with galactocentric distance.
Finally, we stress that the N/O vs. O/H diagram for dwarf galaxies is often interpreted in the literature (the same is true for the C/O vs. O/H diagram) as an evolutionary diagram, but instead it represents the final abundance values achieved by objects which evolved in a completely different way from each other. In other words, this diagram is not the equivalent of the N/O vs. O/H for the solar neighborhood stars which is a real evolutionary plot, where for each O/H value corresponds a different galactic age. Therefore, any conclusion on the secondary/primary value of N derived from such a diagram should be taken with care.
References
- (1) Afflerbach, A., Churchwell, E., Werner, M. W. 1997, ApJ 478, 190
- (2) Aloisi, A., Tosi, M., Greggio, L. 1999, ApJ, 118, 302
- (3) Anders, E., & Grevesse, N. 1989, Geochim. Cosmochim. Acta, 53, 197
- (4) Allende Prieto, C., Lambert, D. L., Asplund, M. 2002, ApJ, 573, L137
- (5) Allende Prieto, C., Lambert, D. L., Asplund, M. 2001, ApJ, 556, L63
- (6) Asplund, M. & Garcia Pérez, A.E. 2001, A&A, 372, 601
- (7) Boesgaard, A. M., King, J. R., Deliyannis, C. P., & Vogt, S. S. 1999, AJ, 117, 492
- (8) Boissier, S. & Prantzos, N. 2000, MNRAS, 312, 398
- (9) Boothroyd, A.I., Sackmann, I.-J., & Ahern, S.C. 1993, ApJ, 416, 762
- (10) Boothroyd, A.I., Sackmann, I.-J., & Wasserburg, G.J 1995, ApJ, 442, L21
- (11) Bradamante, F., Matteucci, F., D’Ercole, A. 1998, A&A 337, 338
- (12) Calura, F., Matteucci, F., Vladilo, G. 2002, MNRAS (submitted)
- (13) Carbon, D. F., Barbuy, B., Kraft, R. P., Friel, E. D., Suntzeff, N. B. 1987, PASP, 99, 335
- (14) Carigi, L. 2000, Rev. Mex. Astron. Astrof., 36, 171
- (15) Carretta, E., Gratton, R. G., Sneden, C. 2000, A&A, 356, 238
- (16) Cayrel, R., Andersen, J., Barbuy, B., Beers, T. C., Bonifacio, P., François, P., Hill, V., Molaro, P., Nordström, B., Pletz, B., Primas, F., Spite, F., Spite, M. 2001, New Astronomy Rev., 45, 533
- (17) Chiappini, C., Matteucci, F., Romano, D. 2001, ApJ, 554, 1044 (CMR2001)
- (18) Chiappini, C., Matteucci, F., Padoan, P. 2000, ApJ, 528, 711
- (19) Chiappini, C., Matteucci, F., Beers, T. C., Nomoto, K. 1999, ApJ, 515, 226
- (20) Chiappini, C., Matteucci, F., & Gratton, R. 1997, ApJ, 477, 765 (CMG97)
- (21) Cunha, K. & Lambert, D. L. 1992, ApJ, 399, 586
- (22) Daflon, S., Cunha, K., Butler, K., Smith, V. V. 2001, ApJ, 563, 325
- (23) Depagne, E., Hill, V., Spite, M. et al. 2002, A&A, 390, 187
- (24) Diaz, A. I., Tosi, M. 1986, A&A, 158, 60
- (25) Edmunds, M. G. & Pagel, B. E. J. 1994, MNRAS, 211, 507
- (26) Edvardsson, B., Andersen, J., Gustafsson, B., Lambert, D.L., Nissen, P. E. & Tomkin, J. 1993, A&A, 275, 101
- (27) Elmegreen, B. G. 1999, ApJ, 517, 103
- (28) Esteban, C., Peimbert, M., Torres-Peimbert, S., Garcia-Rojas, J., Rodriguez, M. 1999, ApJS, 120, 113
- (29) Ferguson, A. 2002, in “The Evolution of Galaxies II. Basic Building Blocks”, eds M. Sauvage, G. Stasinska and D. Schaerer, Kluwer, p. 119
- (30) Ferguson, A.M.N., Gallagher, J.S., & Wyse, R.F.G. 1998, AJ, 116, 673
- (31) Fich, M., Silkey, M. 1991, ApJ, 366, 107
- (32) Fuhrmann, K. 1998, A&A, 338, 161
- (33) Fulbright, J. P. & Kraft, R. P. 1999, AJ, 118, 527
- (34) Garnett, D. R., Shields, G. A., Peimbert, M., Torres-Peimbert, S., Skillman, E. D., Dufour, R. J., Terlevich, E., & Terlevich, R. J. 1999, ApJ, 513, 168
- (35) Garnett, D. R., Shields, G. A., Skillman, E. D., Sagan, S. P., & Dufour, R. J. 1997a, ApJ, 489, 63
- (36) Garnett, D. R., Skillman, E. D., Dufour, R. J., Shields, G. A. 1997b, ApJ, 481, 174
- (37) Garnett, D. R., Skillman, E. D., Dufour, R. J., Peimbert, M., Torres-Peimbert, S., Terlevich, R., Terlevich, E., Shields, G. A. 1995a, ApJ, 443, 64
- (38) Garnett, D. R., Dufour, R. J., Peimbert, M., Torres-Peimbert, S., Shields, G. A., Skillman, E. D., Terlevich, E., Terlevich, R. J. 1995b, ApJ, 449, L77
- (39) Gerritsen, J. P. E., Icke, V. 1997, A&A, 325, 972
- (40) Gratton, R.G., Carretta, E., Matteucci, F., & Sneden, C. 2000, A&A, 358, 671
- (41) Grevesse, N., & Sauval, A.J. 1998, Space Sci. Rev., 85, 161
- (42) Grevesse, N., Noels, A., Sauval, A. J. 1996, ASP Conf. Ser., vol. 99, p.117
- (43) Groenewegen, M.A.T., & de Jong, T. 1993, A&A, 267, 410
- (44) Groenewegen, M.A.T., van den Hoek, L.B., & de Jong, T. 1995, A&A, 293, 381
- (45) Gummersbach, C. A., Kaufer, A., Schäfer, D. R., Szeifert, T., Wolf, B. 1998, A&A, 338, 881
- (46) Gustafsson, B., Karlsson, T., Olsson, E., Edvardsson, B. & Ryde, N. 1999, A&A, 342, 426
- (47) Henry, R.B.C., Edmunds, M.G., Köppen, J. 2000, ApJ, 541, 660
- (48) Holweger, H. 2001, in Joint SOHO/ACE Workshop: Solar and Galactic Composition, ed. R. F. Willmmer-Schweingruber, Am. Inst. of Physics Conf. Proc., vol 598, p. 23
- (49) Israelian, G., Rebolo, R., Garcia López, R.J., Bonifacio, P., Molaro, P., Basri, G. & Shchukina, N. 2001, ApJ, 551, 833
- (50) Israelian, G., Garcia López, R. J., Rebolo, R. 1998, ApJ, 507, 805
- (51) Izotov, Y. I., Chaffee, F. H., Foltz, C. B., Green, R. F., Guseva, N. G., Thuan, T. X. 1999, ApJ, 527, 757
- (52) Izotov, Y. I., Thuan, T. X. 1999, ApJ, 511, 639
- (53) Kenney, J.D.P., Scoville, N.Z., & Wilson, C.D. 1991, ApJ, 366, 432
- (54) Kennicutt, R. C, Skillman, E. D. 2001, AJ, 121, 1461
- (55) Kennicutt, R. C. 2001, in Galaxy Disks and Disk Galaxies, eds. J. G. Funes, S. J. and E. M. Corsini, ASP Conf. Ser., Vol 230, pp. 291-298
- (56) Kennicutt, R. C., Skillman, E. D. 2001, AJ, 121, 1461
- (57) Kennicutt, R. C. 1998, ApJ, 498, 541
- (58) Kennicutt, R. C., Garnett, D. R. 1996, ApJ, 436, 504
- (59) Kennicutt, R. C., Skillman, E. D. 1996, ApJ, 462, 147
- (60) Kotoneva, E., Flynn, C., Chiappini, C., Matteucci, F. 2002, MNRAS, in press (astro-ph/0206446)
- (61) Laird, J. B. 1985, ApJ 289, 556
- (62) Lambert, D. 2001, in “Oxygen Abundances in Old Stars and Implications to Nucleosynthesis and Cosmology”, 24th meeting of the IAU, Joint Discussion 8
- (63) Larsen, T. I., Sommer-Larsen, J., Pagel, B. E. J. 2001, MNRAS, 323, 555
- (64) Liang, Y. C., Zhao, G., Shi, J. R. 2001, A&A, 374, 936
- (65) Lu, L., Sargent, W. L. W., Barlow, T. A. 1998, AJ 115, 55
- (66) Maeder, A. 1992, A&A, 264, 105
- (67) Matteucci, F., Chiappini C. 2001, New Astron. Rev., 45, 567
- (68) Matteucci, F., Recchi, S. 2001, ApJ, 558, 351
- (69) Matteucci, F. 1986, MNRAS, 221, 911
- (70) Matteucci, F. & Greggio, L. 1986, A&A, 154, 279
- (71) Matteucci, F. & Tosi, M. 1985, MNRAS 217, 391
- (72) Matteucci, F., Chiosi, C. 1983, A&A, 123, 121
- (73) Meléndez, J., Barbuy, B. 2002, ApJ 575, 474
- (74) Meléndez, J., Barbuy, B., Spite, F. 2001, ApJ, 556, 858
- (75) Meyer, D. M., Jura, M., Cardelli, J. A. 1998, ApJ, 493, 222
- (76) Meyer, D. M., Cardelli, J. A., Sofia, U. J. 1997, ApJ, 490, L103
- (77) Meynet, G., & Maeder, A. 2002a, A&A, 381, L25
- (78) Meynet, G., & Maeder, A. 2002b (astro-ph/0205370)
- (79) Molaro, P. 2002, in XVII IAP Colloquium “Gaseous Matter in Galaxies and Intergalactic Space”, p. 307
- (80) Moos, H. W., Sembach, K. R., Vidal-Madjar, A. et al. 2002, ApJS, 140, 3
- (81) Nissen, P. E. 2002 in “CNO in the Universe”, Eds. C. Charbonnel, D. Schaerer and G. Meynet, ASP Conf. Ser., in press
- (82) Nissen, P.E., Primas, F., Asplund, M., Lambert, D.L. 2002, A&A, 390, 235
- (83) Nissen, P.E., Primas, F., Asplund, M. 2001, New Astron. Rev,. 45, 545
- (84) Nomoto, K., Hashimoto, M., Tsujimoto, T., Thielemann, F.-K., Kishimoto, N., Kubo, Y., & Nakasato, N. 1997, Nucl. Phys. A, 616, 79c
- (85) Okamura, S., Kanazawa, T., Kodaira, K. 1976, PASJ, 28, 329
- (86) Pagel, B.E.J. 1997, in “Nucleosynthesis and Chemical Evolution of Galaxies”, Cambridge Univ. Press
- (87) Pagel, B. E. J., Edmunds, M. G., Fosbury, R. A. E., Webster, B. L. 1978, MNRAS, 184, 569
- (88) Peimbert, M. 1999, in “Chemical Evolution from Zero to High Redshift”, ESO Workshop, ed. J. R. Walsh, M. R. Rosa. Berlin: Springer-Verlag, p. 30.
- (89) Pettini, M., Ellison, S. L., Bergeron, J., Petitjean, P. 2002, A&A, in press
- (90) Pettini, M., Lipman, K., Hunstead, R. W. 1995, ApJ, 451, 100
- (91) Plez, B., Smith, V.V., & Lambert, D.L. 1993, ApJ, 418, 812
- (92) Prantzos, N., Vangioni-Flam, E., & Chauveau, S. 1994, A&A, 285, 132
- (93) Prochaska, J. X., Wolfe, A. M. 2002, ApJ, 566, 68
- (94) Pilyugin. L. S. 1999, A&A, 346, 428
- (95) Rana, N. C. 1991, ARA&A, 29, 129
- (96) Recchi, S. 2001, PhD Thesis, University of Trieste, Italy
- (97) Recchi, S., Matteucci, F., D’Ercole, A. 2001, MNRAS, 322, 800
- (98) Recchi, S., Matteucci, F., D’Ercole, A., Tosi, M. 2002, A&A, 384, 799
- (99) Renzini, A., & Voli, M. 1981, A&A, 94, 175 (RV)
- (100) Rudolph, A. L., Simpson, J. P., Haas, M. R., Erickson, E. F., Fich, M. 1997, ApJ, 489, 94
- (101) Scalo, J.M. 1986, Fundam. Cosmic Phys., 11, 1
- (102) Schaller, G., Schaerer, D., Meynet, G., & Maeder, A. 1992, A&AS, 96, 269
- (103) Simpson, J. P., Colgan, S. W. J., Rubin, R. H., Erickson, E. F., Haas, M. R. 1995, ApJ, 444, 721
- (104) Smith, V.V., Plez, B., Lambert, D.L., & Lubowich, D.A. 1995, ApJ, 441, 735
- (105) Sneden, C. & Primas, F. 2001, New Astron. Rev., 45, 513
- (106) Sofia, U. J., Meyer, D. M. 2001, ApJ, 554, L221
- (107) Thielemann, F. -K., Nomoto, K., & Hashimoto, M. 1996, ApJ, 460, 408 (TNH)
- (108) Thielemann, F. -K., Nomoto, K. & Hashimoto, M. 1993, in Origin and Evolution of the Elements, ed. N. Prantzos et al., Cambridge University Press, p. 297
- (109) Thomas, D., Greggio, L., Bender, R. 1998, MNRAS, 296, 119
- (110) Thuan, T. X., Lecavalier des Etangs, A., Izotov, Y. I. 2002, ApJ, 565, 875
- (111) Thurston, T.R., Edmunds, M.G., & Henry, R.B.C. 1996, MNRAS, 283, 990
- (112) Tsamis, Y. G., Barlow, M. J., Liu, X. -W., Danziger, I. J., Storey, P. J. 2002, MNRAS, in press
- (113) van den Hoek, L.B., & Groenewegen, M.A.T. 1997, A&AS, 123, 305 (vdHG)
- (114) van der Kruit, P. C. 1986, A&A, 157, 230
- (115) van Zee, L., Salzer, J.J., Haynes, M.P., O’Donoghue, A.A., & Balonek, T.J. 1998a, AJ, 116, 2805
- (116) van Zee, L., Salzer, J.J., Haynes, M.P. 1998b, ApJ, 497, L1
- (117) van Zee, L., Haynes, M. P., Salzer, J. J. 1997, AJ, 114, 2497
- (118) Vilchez, J. M., Esteban, C. 1996, MNRAS, 280, 720
- (119) Wheeler, J. C., Sneden, C. Truran, J. W. 1989, ARA&A, 27, 279
- (120) Wielen, R., Fuchs, B., Dettbarn, C. 1996, A&A, 314, 438
- (121) Woosley, S. E., Weaver, T. A. 1995, ApJS, 101, 181 (WW)
- (122) Woosley, S. E., Axelrod, T. S., Weaver, T. A. 1984, in “Stellar Nucleosynthesis”, eds. C. Chiosi and A. Renzini, Reidel (Dordrecht), p. 263
- (123) Zaritsky, D., Kennicutt, R. C., Huchra, J. P. 1994, ApJ, 420, 87