A Case for Renewed Activity in the Giant Radio Galaxy J0116473
Abstract
We present ATCA radio observations of the giant radio galaxy J0116473 at 12 and 22 cm wavelengths in total intensity and polarization. The images clearly reveal a bright inner-double structure within more extended edge-brightened lobe emission. The lack of hotspots at the ends of the outer lobes, the strong core and the inner-double structure with its edge-brightened morphology lead us to suggest that this giant radio galaxy is undergoing a renewed nuclear activity: J0116473 appears to be a striking example of a radio galaxy where a young double source is evolving within older lobe material. We also report the detection of a Mpc-long linear feature which is oriented perpendicular to the radio axis and has a high fractional polarization.
1 Introduction
The concept of episodic activity in radio galaxies, with each phase manifesting itself as an extended radio structure, was inherent in the models suggested for sources with X-shaped structures and powerful radio galaxies with wings (Leahy and Williams, 1984). Restarting beams following an interruption in nuclear activity was again suggested as a cause for source structures which appeared to have partial jets (Bridle, Perley and Henriksen, 1986). This idea gained support from the observations of 3C388 by Roettiger et al. (1994) in which the lobe spectral index distribution revealed two distinct regions. Observational indications coupled with simulations of the development of extended radio structures have suggested that episodic activity may play an important role in the evolution of at least some categories of radio sources (Baum et al., 1990; Clarke and Burns, 1991).
In a study of the morphologies of a sample of giant radio galaxies, Subrahmanyan, Saripalli and Hunstead (1996) drew attention to a variety of morphological features which were suggestive of interrupted nuclear activity. Recently, the WENSS discovered several giant radio galaxies exhibiting double-double morphologies which have been attributed to renewed nuclear activity (Schoenmakers et al., 2000b) and the study is indicative of a higher incidence rate of such inner doubles among large radio galaxies. As a consequence, systematic studies of the role of episodic nuclear activity are possible for the category of giant radio galaxies. The relatively long timescales ( yr; Komissarov and Gubanov 1994) over which radio lobes remain visible after the central activity which energizes them stops makes synchrotron lobes useful indicators of any past activity phases in radio galaxies.
Such studies have interesting implications for the fuelling of the central engine and the conditions under which a renewal of nuclear activity may occur. Moreover, these studies may address the question of the role of such recurrent activity in the attainment of the extraordinary sizes in the giant radio sources.
J0116473 was previously imaged as part of a study of the morphologies in radio galaxies of megaparsec dimensions (Subrahmanyan, Saripalli and Hunstead, 1996). This object was noted as exhibiting unusual characteristics: lack of hotspots in a source which had properties consistent with FR-II type (Fanaroff and Riley, 1974) radio galaxies and an elongated structure extending along a direction perpendicular to the jets. It was hypothesized that the morphological features in this giant radio galaxy — and indeed some others in the sample — might be a manifestation of recurrent nuclear activity. Subrahmanyan, Saripalli and Hunstead (1996) concluded that the large sizes of giant radio galaxies may be a result of a restarting of their central engines in multiple phases of activity along roughly similar directions.
We are currently following up on our earlier hypothesis with case studies of the giant sources which showed evidence of recurrence in activity. In this paper, we present higher dynamic range Australia Telescope Compact Array (ATCA; see The Australia Telescope 1992) images of J0116473 in total intensity and polarization. The ATCA observations presented here provide new evidence for a restarting of activity in this giant source. In the next section we describe our observations. In later sections we discuss the role of recurrence in the creation of the unusual morphological features in this source. We postpone comparison of the source features and parameters with other sources exhibiting similar inner double structures to a later paper.
2 Observations and Imaging
J0116473 has an angular size of about 12 arcmin and it was observed with ATCA at 12 and 22 cm wavelengths in several array configurations in order to image a range of angular-scale structures from a few arcsec to several arcmin. Observations were made during 1999 January to April in an extended 6.0C 6-km array, a 1.5C 1.5-km array, a 750C 750 m array and a compact 375-m array. Full Earth-rotation synthesis observations over 12 hr were made in each of the configurations in order to cover the visibility domain with the East-West array. 22 and 12-cm wavelength visibilities were recorded simultaneously in two bands of 128 MHz each centered at 1384 and 2496 MHz. Full polarization measurements were recorded in order to image the source in Stokes I, Q and U. The continuum band was covered in 16 independent channels.
The flux density scale was bootstrapped to B1934638 whose flux density was adopted to be 14.9 and 11.14 Jy respectively at 1384 and 2496 MHz. The data were calibrated, imaged and deconvolved using standard procedures and the miriad software routines. To avoid bandwidth smearing effects in the wide-field images made with the wide continuum bands, images were constructed using the bandpass-calibrated multi-frequency channel data adopting bandwidth synthesis techniques. Images were deconvolved using the Clark (1980) algorithm with the Cornwell (1983) modification to suppress CLEAN instabilities. At least two iterations of phase self-calibration were performed; the visibility amplitudes were not self-calibrated.
3 The Source Components and Physical Parameters
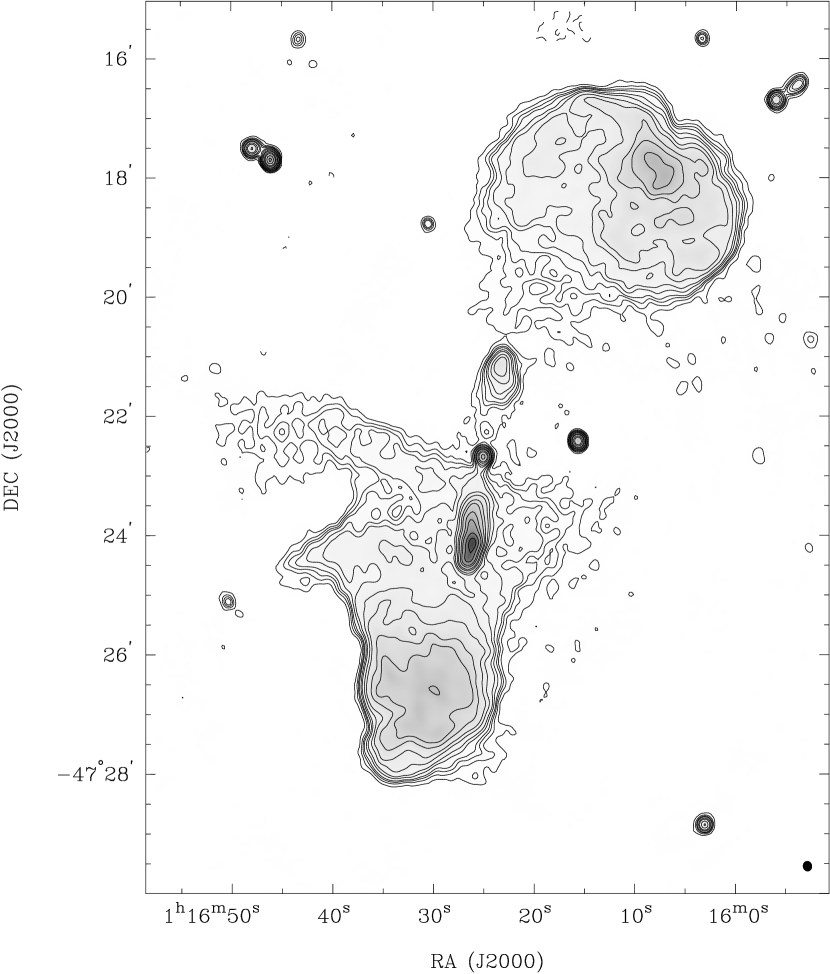
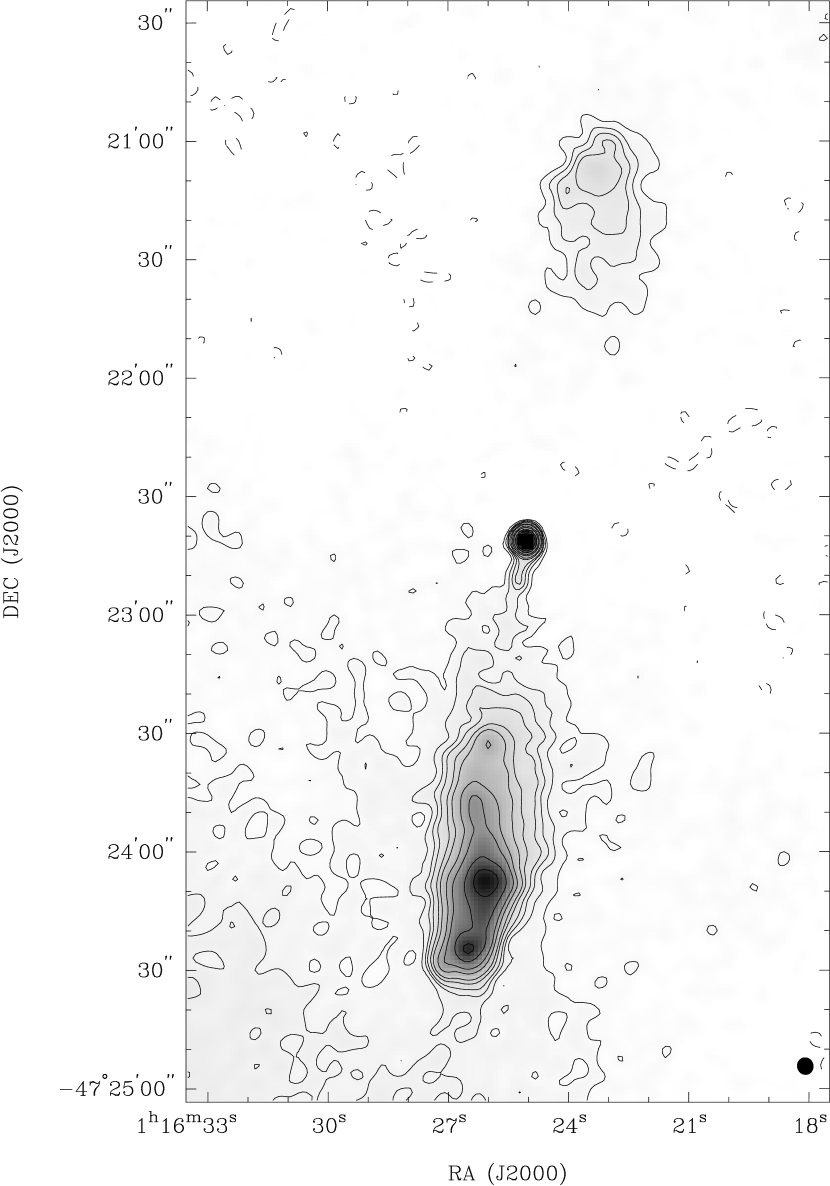
In Figure 1 we show a total intensity image of J0116473 at 22 cm made with a beam of FWHM arcsec2. The giant radio galaxy is seen to have (i) two large, diffuse, edge-brightened lobes which do not show any hotspots at the ends, and (ii) what appears to be another double source, smaller in size and sharing the same radio core, whose lobes have a much higher brightness. A peculiar elongated structure is also seen extending nearly a megaparsec in a direction perpendicular to the radio axis and intersecting the radio axis just south of the core. The source is seen to have a similar morphology at 12 cm.
J0116473 has a total flux density of 2.9 Jy at 1376 MHz and 1.6 Jy at 2496 MHz. The overall spectral index is 0.93 (we define the spectral index by the relation: ) between these two frequencies. The source is at a redshift of 0.146 (Danziger, Goss and Frater, 1978) and the total radio luminosity at 1376 MHz is W Hz-1 (herein we adopt cosmological parameters H∘ = 65 km s-1 Mpc-1, = 0.3 and = 0.7). The largest angular size is 12.5 arcmin and we infer the linear size to be 2.1 Mpc.
The radio images detect a radio core with a flux density of 11 mJy at 1376 MHz and with a flat spectral index, computed between 1376 and 2496, of .
3.1 Outer Lobes of J0116473
The total radio power of J0116473 places it in the category of powerful radio galaxies; however, the outer lobes lack compact hotspots. In their place, we can recognise only diffuse warm-spots towards the lobe ends.
Both the outer diffuse lobes (hereinafter we refer to the northern and southern outer lobes as N1 and S1, the corresponding inner lobes are called N2 and S2) appear relaxed although they are seen to be well bounded as inferred from the bunching of the contours at the edges over much of the lobes. The sharp outer boundaries are indicative of a confinement of the synchrotron plasma by the external intergalactic medium (IGM).
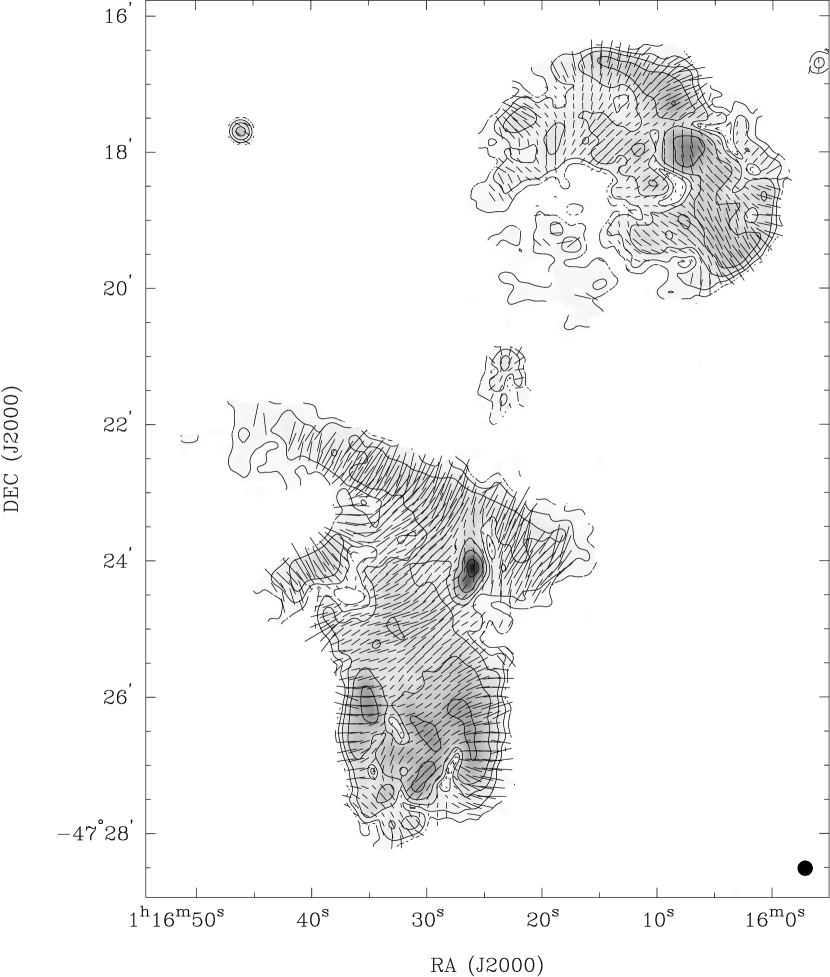
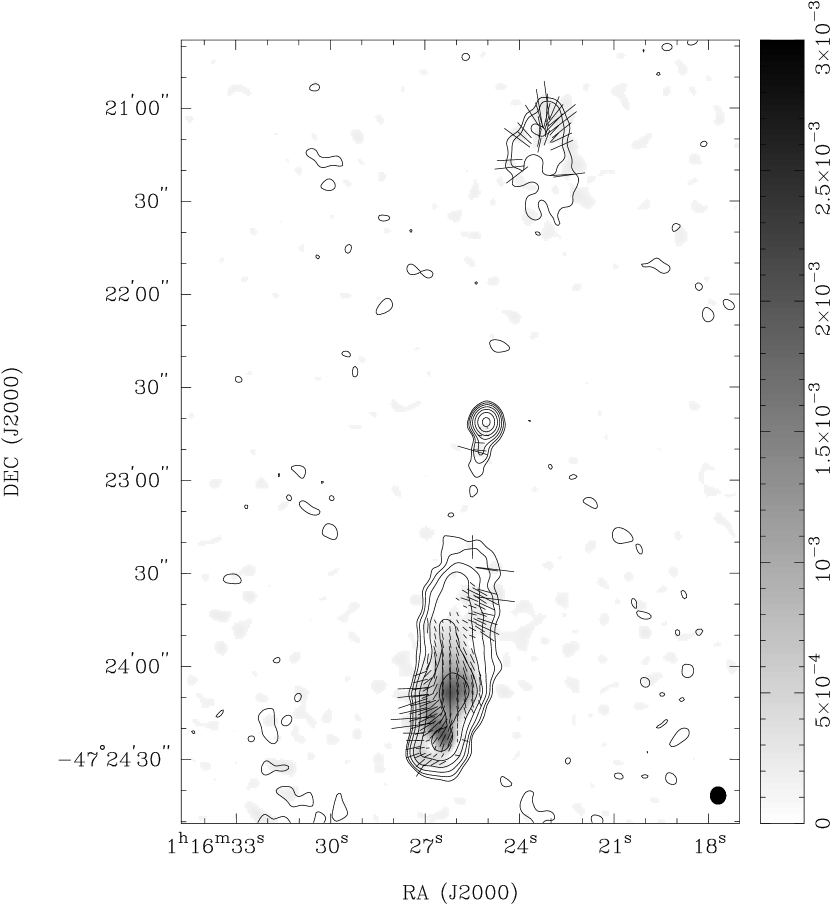
The intensity distribution of linearly polarized emission at 22 cm, with a beam of 12 arcsec FWHM, is shown in Figure 2 as a greyscale representation with contours overlayed. The electric field polarization vectors are also overlayed, with the vector lengths proportional to the fractional polarization. From the orientations of the polarization vectors at 12 and 22 cm, we have derived the distribution of rotation measure (RM) over the source: values of RM are small and have a mean of 3 rad m-2 with a 1- spread of 4 rad m-2 (see Figure 3). It may be noted here that the observed difference in the orientations of the polarization vectors at 12 and 22 cm are small; therefore, we have assumed that our RM values inferred from 2-frequency polarization images do not suffer from ambiguities. The vector orientations in Figure 2 have been corrected for the derived Faraday rotation.
The fractional polarization is enhanced along most of the outer boundaries of both lobes and the projected magnetic field lines are circumferentially oriented along these boundaries: the polarization properties are suggestive of an ordering of the field owing to a compression of the lobe plasma along the outer boundaries. Fractional polarization in the range 20-30 per cent are measured over most of the two outer lobes with values exceeding 50 per cent along the lobe boundaries. We observe significantly more structure in both the outer lobes in polarized intensity as compared to that in total intensity. The dips in polarized intensity in the vicinity of the intensely polarized regions in N1 and S1 are likely to be due to beam depolarization because the E-vectors on either side of these dips show large differences in their position angles.
The image of polarized intensity at 12 cm is very similar to that at 22 cm; we computed the distribution of depolarization ratio over the source as a ratio of the fractional polarizations at 22 and 12 cm. No regions of the source appear to have noticable depolarization at a resoution of 12 arcsec and we also do not see any depolarization asymmetry: on the average, the fractional polarization at 22 cm is within 5 per cent of that at 12 cm in both lobes. The lack of evidence for internal Faraday rotation and depolarization asymmetry in J0116473 is consistent with similar findings for other GRGs (Willis and O’Dea, 1990; Lara et al., 1999).
It may be noted here that the morphology in the northern lobe appears to indicate that the diffuse warm-spot region at its outer end was probably fed by a flow which entered the lobe along the axis defined by the inner double and bent by almost at the north-eastern boundary of the lobe. The situation may have been similar to that in sources which show ‘rim hotspots’: these radio galaxies, which are several times smaller, have hotspots that are seen along the rim of a lobe and the jet is thought to enter along the rim and bend through a large angle to create a terminal hotspot at its end (e.g., 3C135, 3C192; Leahy et al. 1997). It may be that we are viewing a relict of a rim-type hotspot complex in this giant radio galaxy and we identify the warm spot as the position where the beam may have terminated.
The projected magnetic field distribution inferred from Figure 2 may provide a clue as to how the beam propagated in the past. In the north-east regions of the lobe, the B-field vectors are circumferential and would be parallel to a beam which propagated into the northern lobe along its eastern rim and curved to terminate at the location of the peak in polarized and total intensity. A sharp flip in the position angle of the E-vectors is seen at the location of the peak in going from NE to SW across the diffuse lobe: if the south west of the lobe is made of post-hotspot material, this would imply that the field here is oriented perpendicular to the flow. An interesting feature is a loop-like distribution of the projected B-field over the lobe with reduced polarized intensity in the central regions towards the southern end.
A de-collimated flow, as inferred for the northern lobe, is uncharacteristic of powerful radio galaxies where narrow beams usually feed hotspots at the lobe ends; large-opening-angle beams are more typical of low-power sources whose lobes are edge darkened. It is interesting to ask whether a decrease in the beam power, as the central engine activity in a powerful radio source ceases, is accompanied by a transition to an FR-I type flow.
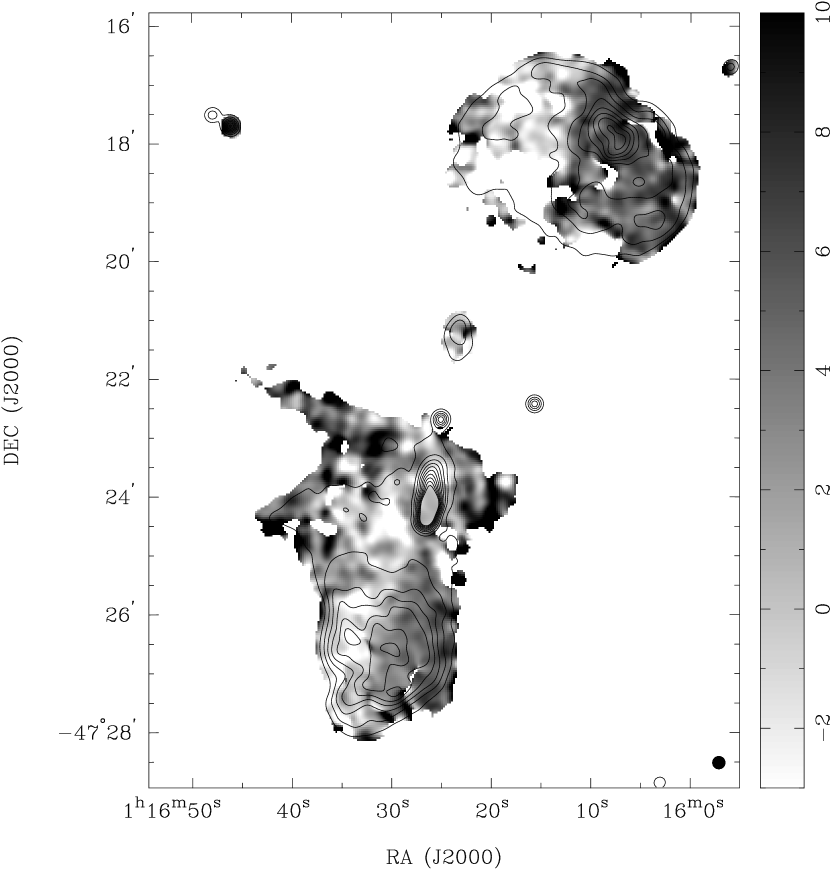
We observe a large-scale structure in the RM distribution over the source: as seen in Figure 3, the RM is low in a band running along the length of the radio galaxy at a position angle of about and with a width of 2 arcmin. In Figure 4 we display the profile of this RM variation: the image shown in Figure 3 was rotated counter clockwise through and binned (averaged) along declination to construct the profile plot. The profile clearly shows that the mean RM is close to zero in the 2 arcmin wide band and values on either side of the band average around 5 rad m-2.
In sensitive observations of high Galactic latitude fields, Wieringa et al (1993) and later Haverkorn, Katgert and de Bruyn (2000) reported detection of linear structures in polarized intensity which showed abrupt changes in RM along directions transverse to the filaments. These bands have widths and derived RM values similar to the feature we observe in J0116473. However, as seen in Figure 3 where contours of total intensity are overlayed on the RM image, there appears to be a correspondence between the RM and total intensity distributions: in N1 and S1 the brightness shows a step decrement at the location of the band with low RM. Moreover, the band with low RM has a position angle similar to the source axis although it is not symmetric with respect to the radio core position. These indicate that the RM structure may be intrinsic to the source and not a foreground galactic feature. If such an interpretation were correct, it may imply a spatial separation of entrained thermal plasma in the lobes: the low RM channel may trace relicts of the beam plasma from past activity. It may be noted here that there is no corresponding feature in the distribution of depolarization ratio; however, this is understandable owing to the low values of RM.
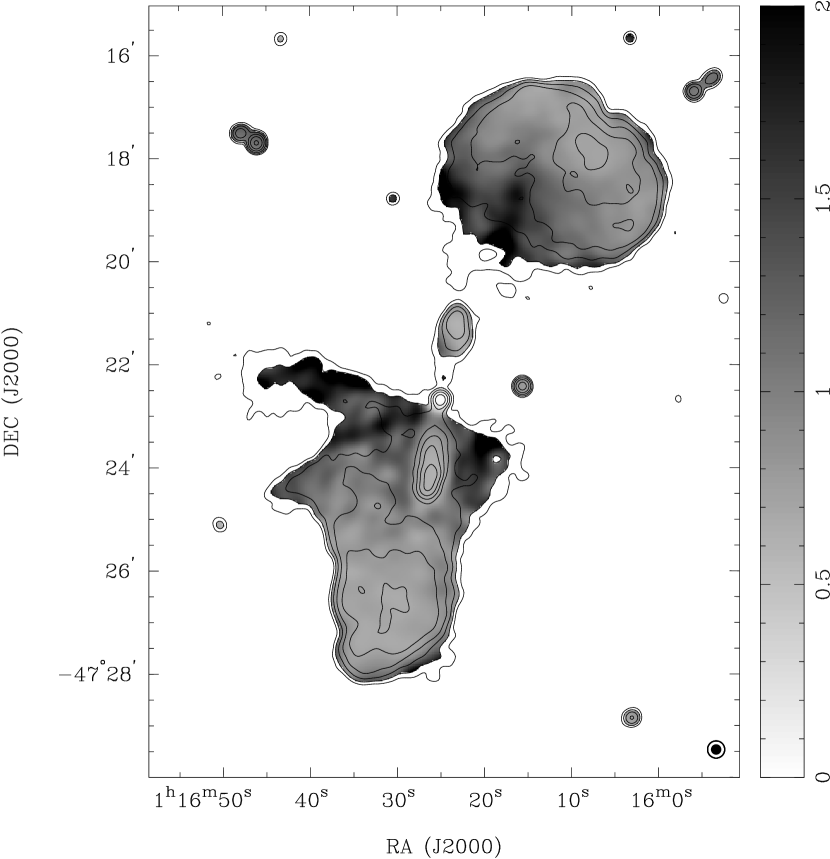
In Figure 5 we show the distribution of spectral index, computed between 22 and 12 cm and using images with 20 arcsec FWHM beams, over the entire source. Both outer lobes show a steepening of the spectral index away from the lobe ends: this is a characteristic feature of the lobes in powerful radio galaxies and has, traditionally, been interpreted as owing to spectral aging in the cocoon plasma as it backflows from hotspots towards the central core. However, in the case of J0116473, there are no hotspots at the ends; therefore, we hypothesize that the outer lobes are probably relicts, of a powerful radio galaxy, in which the beams from the central engine no longer terminate.
The optical field of J0116473 does not indicate evidence for significant galaxy overdensity in the vicinity of the radio source (Subrahmanyan, Saripalli and Hunstead, 1996). Because the diffuse outer lobes are located far from the host galaxy and in an environment which is poor in galaxy density, we may expect a relatively low IGM pressure. Subrahmanyan and Saripalli (1993) used constraints on the Comptonization of the CMBR spectrum and concluded that giant radio galaxies were not thermally confined by the IGM. Using current limits on the Comptonization -parameter of (Fixen et al., 1996), and assuming that the uniform IGM gas was ionized by redshift , we expect any uniform IGM to have a present day thermal pressure at most dyne cm-2. The outer lobes N1 and S1 have peak brightness of about 10 mJy beam-1 in 22 cm images made with 10 arcsec FWHM beams and the synchrotron emission has a spectral index ; assuming that the lobes have a line-of-sight path length of 0.5 Mpc and making standard minimum energy assumptions (Miley, 1980), we infer that the lobe synchrotron plasma has an energy density of at least erg cm-3. Clearly, the lobes are overpressured with respect to the ambient IGM and, consistent with the indications from the total intensity and polarization observations discussed above, the lobes — although relicts — are likely expanding and ram-pressure confined by the IGM.
The two outer lobes are somewhat dissimilar in structure: N1 is seen to have a more spherical shape where as S1 appears cylindrical or elongated. There is a conspicuous lack of emission between N1 and the core (except for the sharply delineated N2) and this is in contrast to the southern outer lobe S1 in which the lobe emission appears to extend to the core.
3.2 The Inner Double
A higher resolution image of the inner double, made at 12 cm and with a beam of arcsec2 FWHM, is shown in Figure 6. The total flux density of the inner double, excluding the core, is 0.26 and 0.17 Jy respectively at 22 and 12 cm; the inner lobes have an overall spectral index of 0.7 which is significantly flatter than that of the outer lobes. The radio luminosity of the inner lobes is W Hz-1 at 1376 MHz: the inner double, by itself, has a luminosity which is on the dividing line between FR-I and FR-II sources.
The inner double, in isolation, appears like the two lobes of a radio galaxy. The two components are both edge brightened and collinear with the core. Both are sharply bounded towards their leading edges with decreasing surface brightness away from their ends. The northern lobe (N2) of the inner double is more diffuse, without hotspots and is relatively short in length. In contrast, the southern inner lobe (S2) is elongated and has a series of emission peaks along its length: these peaks are not all collinear. In spite of the striking morphological differences between the northern and southern components of the inner double, the ends of the components are equidistant from the core: the inner double has arm lengths which differ by less than 10 per cent and the overall linear size of the inner double is 600 kpc.
We have detected a one-sided jet close to the core and directed towards S2: the jet appears to be directed to the northern-most peak in S2. The jet is much narrower than the lobe and emission peaks which constitute S2. The core, lobe N2, the jet and the two peaks in lobe S2 which are closest to the core are all well aligned. However, two sharp bends are seen to occur in S2 at the locations of the middle two peaks in the lobe. The jet is unresolved in our 12 cm image made with a beam of 4.2 arcsec FWHM (Figure 6) and we estimate the jet width to be kpc; in contrast, the inner lobes are well resolved and have transverse widths of about 20 arcsec. The detection of the narrow jet is a strong reason to believe that S2 and N2 are indeed lobes of a restarted activity and that they are not visible parts of jets transporting energy to the outer lobes S1 and N1. This view is supported by the increasing transverse widths of N2 and S2 towards the core and the symmetric locations of the outermost peaks in N2 and S2 on either side of the core.
If the inner double is a new episode of activity that is propagating within the older lobe plasma, the ambient medium for the inner and outer doubles would be different and differences in their interactions with their respective ambient media might be reflected in their spectral and polarization characteristics. The properties of the inner double and its evolution may then be used as a probe of the older lobe plasma in which it is embedded. In J0116473, S2 is surrounded by emission from S1 and this provides an opportunity for examining the evolution of the inner lobes within the outer cocoon material.
The inner double and outer lobes share the same radio core and the axis of the inner double appears aligned with the axis of beams which fed the outer lobes: we would expect that S2 is embedded in the cocoon of S1 and that N2 is either propagating in the IGM or a low-surface-brightness southern extension of N1. If we assume cylindrical symmetry for S1, we may expect that S2 would be embedded in S1 even if the axes of the outer and inner doubles were misaligned in 3-dimensional space. The lobe separation symmetry observed in N2 and S2 also argues against large angles between the axis of the inner double and the plane of the sky.
The polarization in the emission from the inner double at 12 cm is shown in Figure 7 with a beam of 4 arcsec FWHM. Care was taken to avoid contamination from the diffuse emission surrounding S2: only visibilities with spatial frequencies exceeding 3 k were used in making the image. In N2 and S2, the projected B-field vectors appear to follow the total intensity contours at the leading edges of the lobes: a property commonly seen in FR-II type radio galaxies. There is also evidence for a circumferential magnetic field along the edges of the lobes away from the ends: this is similar to the behaviour seen in the outer double and other FR-II type radio galaxies. The fractional polarization is enhanced all along the edges of N2 and along the eastern edge of S2 and has values exceeding 50 per cent in these regions; the depolarization ratio computed between 22 and 12 cm over the inner lobes is unity within the errors. The low polarized intensity (and fractional polarization) in the western edge of S2 may be a consequence of beam depolarization because the E-vectors sharply change orientation from being circumferential along the edge to being perpendicular to the source axis away from the edge. In the remainder of the inner lobes, the fractional polarization is about 20-30 per cent. The projected B-field away from the lobes edges is oriented perpendicular to the source axis; however, the jet detected close to the core has a projected B-field configuration which is oriented along the jet axis: the arrangement is common in jets in powerful radio galaxies. The lack of depolarization asymmetry lends additional support for the inner and outer lobes both being close to the plane of the sky.
The spectral index distribution over the inner lobes was computed from images at 2496 and 1376 MHz — made using visibilities in the restricted common range 1.7-30 k — which were convolved to a final beam of arcsec2 at p.a. of . The spectral index image is featureless at this resolution and has a value about 0.7 over most of N2 and S2. The spectral index image was binned along RA and the profile of the average spectral index in declination is shown in Figure 8. There does not appear to be any significant spectral index gradient along either N2 or S2; if anything, there is marginal indication for a flattening of the spectral index toward the core in both the lobes. The jet emerging from the core toward S2 has a spectral index of 0.6.
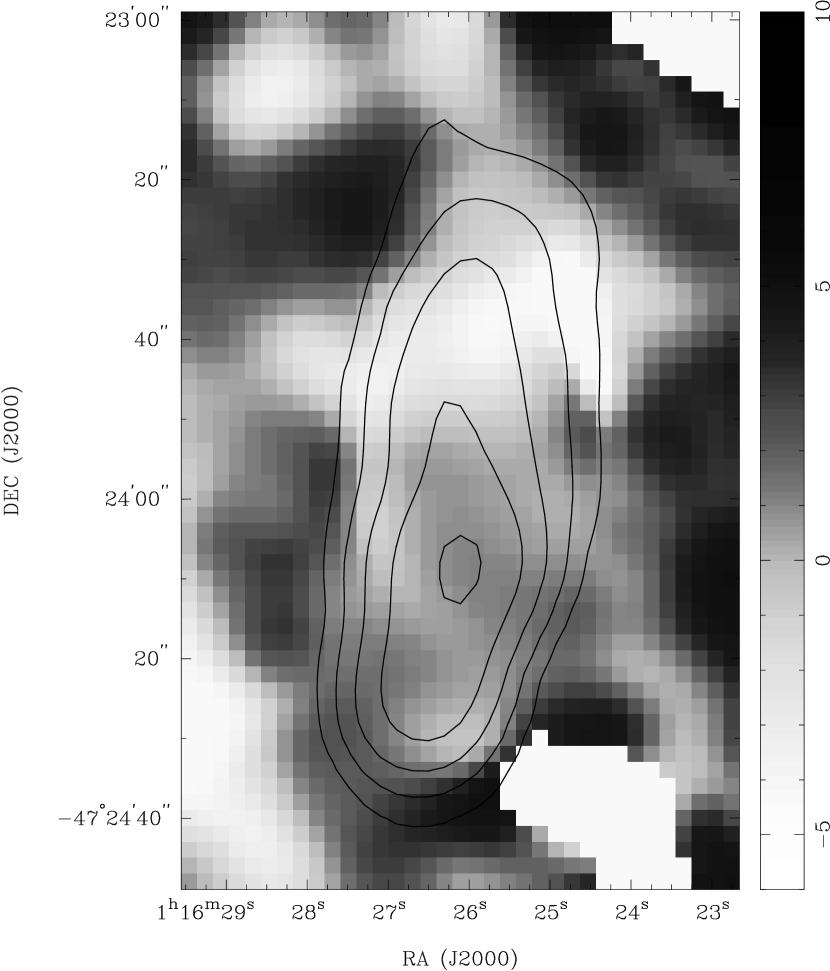
Both N2 and S2 show uniform RM values close to zero (Figure 3). In Figure 9, we show the RM distribution in the vicinity of S2 where it is seen that the lobe appears to be surrounded by regions which have a distinctly different value of RM. The correlation in the spatial distribution of RM with total intensity points to the possibility that the RM structure is intrinsic to the source. It is interesting that the higher RM values avoid the area covered by S2, indicating greater entrained thermal plasma and/or ordered fields in the ambient cocoon close to the edge of the advancing inner lobe.
To summarize, the inner double has an edge-brightened morphology, a distinctive feature of powerful FR II-type sources; however the absence of spectral gradients in the inner lobes is uncharacteristic of double radio sources. If spectral gradients along lobes of double radio sources represent age of synchrotron plasma, the absence of significant gradients in the inner lobes of J0116473 suggests that the advance speed of the ends of the source is unusually high compared to sources growing in any thermal IGM. This is consistent with the suggestion that lobes advance within relict cocoons with speeds 0.2-0.3 (Schoenmakers et al., 2000a) which is much greater than the advance speeds of 0.03 inferred for powerful radio galaxies (Scheuer, 1995).
In the restarted jet model of Clarke and Burns (1991) the new jets are overdense with respect to their ambient medium and propagate almost ballistically unable to form hotspots. In these conditions circumferential fields and high degrees of polarization are not expected to be seen towards the ends of the restarted jets. In giant radio galaxies, however, Kaiser, Schoenmakers and Roettgering (2000) argue that the longer timescales involved allow for sufficient entrainment of ambient material across the contact discontinuity and into the older cocoon plasma and this raises the thermal density to levels adequate for the formation of hotspots at the ends of the new jets. The circumferential B-field, accompanied by high degrees of polarization, seen around the leading ends of N2 and S2 constitute the typical signature expected of compressed synchrotron plasma. The observations are indicative of an evolution for the ends of the inner lobes that is similar to that for the outer lobes and in powerful radio galaxies where light jets form hotspots on meeting with a denser ambient medium. The advance of a restarted jet is also predicted to result in a bow shock structure within the older cocoon plasma with an intensity contrast same as that of structure at its head. (Clarke et al, 1992). Our observations do not reveal any evidence for such a bow shock feature in total intensity; similar to the case in other giant radio galaxies with inner double structures (Kaiser, Schoenmakers and Roettgering, 2000).
4 Recurrent activity in J0116473
The observational evidence presented in the preceeding sections lead us to postulate the following scenario for the formation of the radio structure: the outer lobes were formed in an earlier phase of activity in which powerful beams from the central engine formed hotspots at the ends of the source and the edge-brightened lobes. That phase of nuclear activity ceased and the beams feeding the hotspots and lobes discontinued. Since then, the hotspots have relaxed and expanded into the warm spots and the beam channels were pinched off. The outer lobes N1 and S1 are the visible relicts of the past activity phase. The beams were recently re-activated following the interruption and these new beams have formed the inner lobes N2 and S2. The position angle of the inner double is seen to be the same as the axis of the beams that formed the outer double and this suggests that the re-activated central engine maintained the axis of ejection. It may be noted here that the warm spot in the northern lobe is probably not along the axis of the past activity phase (see section 3.1).
We see that while there are no glaring separation asymmetries in this radio galaxy for the outer and inner double structures, morphologically there are clear side to side asymmetries and an indication that the asymmetry repeats over the two activity epochs. Such a similarity in the morphologies of the inner and outer components was also reported in at least two other giant radio galaxies with inner double structures (B1450+333 and 1834+620; Schoenmakers et al. (2000a)). S2 has a cylindrical shape similar to the southern outer lobe S1; N2 appears more relaxed and more spherical as is the case for the northern outer lobe N1. If one views the inner double as a stage through which the outer double might have evolved, the lobe morphology would appear to have been set early in the evolution. It would be interesting to study the role of the bar-like feature in creating medium differences close to the host galaxy that might cause the side-to-side asymmetries; this would require the linear feature to have existed before the formation of the outer lobes.
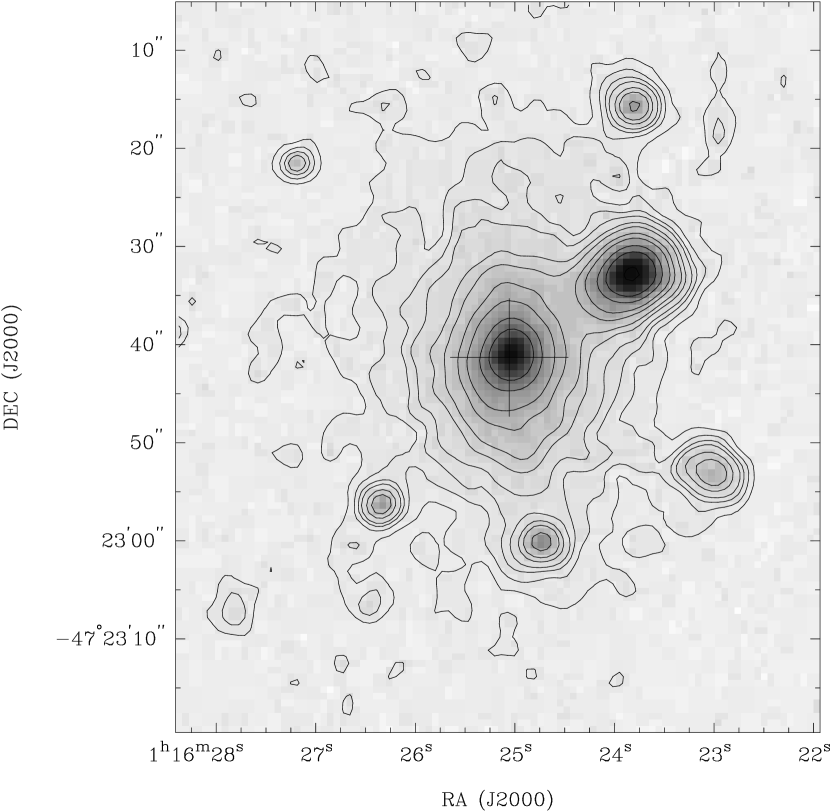
The SuperCOSMOS digitization of the UKST red plate OR 18623 has been used to extract the optical image of the host galaxy and is shown in Figure 10. Contours of the smoothed image (using a 2-arcsec FWHM Gaussian) have been overlayed after subtracting the mean sky background. The cross marks the location of the radio peak as determined from a 4-arcsec resolution image of the core at 2496 MHz. There is seen to be a concentration of objects within 100 kpc of the host elliptical galaxy. One object located 15 arcsec to the north west, at a distance of about 50 kpc, is relatively bright and is seen in the red image to be clearly extended towards — and within the extended envelope of — the radio galaxy host, suggestive of a possible interaction. Optical observations are suggested to substantiate this as well as to look for any evidence for episodicity in the host galaxy properties which might be related to multiple nuclear activity in this galaxy.
4.1 Activity Related Timescales
From the lack of any hotspots in N1 and S1 we can obtain an estimate of the time elapsed since the central engine activity stopped. Assuming a maximum jet bulk flow velocity of , the travel time of the jet material from the core to the presumed locations of the past hotspots in the outer lobes is at least yr. A 1-kpc size hotspot of relativistic plasma may be expected to disappear in a sound-crossing timescale of about yr. Because hotspots are not seen in N1 and S1, we estimate that beams may have stopped injecting energy into N1 and S1 at least yr ago.
Subsequently, if the outer lobes are overpressured with respect to the ambient IGM (see section 3.1), N1 and S1 would have continued to experience expansion losses. Assuming that the ambient IGM has density at most (Burles et al., 1999), the outer lobes, which have internal energy density exceeding erg cm-3, would have to expand at speeds at least in order to be ram-pressure confined. Expansion by factor would reduce the luminosity by factor (Leahy, 1991): J0116473 is currently seen as a powerful radio source and if we assume that the 22-cm radio luminosity of the lobes was at most W Hz-1 when the energy injection was switched off, we conclude that the relict lobes are younger than yr.
The previous activity phase may have stopped at most yr ago and, if the inner lobes advance into the relict cocoon with speed about 0.2-0.3 (Schoenmakers et al., 2000a), we estimate that the current activity phase commenced yr ago.
5 The Bar-like Feature
In the southern lobe, we recognize an unusual bar-like feature just south of the core. The bar is sharply bounded along its northern edge and appears to be a distinct component. It has a length of at least 1 Mpc and is oriented nearly perpendicular to the source axis. As seen in Figure 2, this feature is the most highly polarized region in the radio galaxy and appears to have a fractional polarization exceeding 50 per cent. The projected magnetic field in the bar is aligned along its length. The radio spectral index of the bar emission, as computed using our ATCA images at 12 and 22 cm, is steep with .
Examples of lobes of radio galaxies abruptly cutting off in sharp, straight edges facing the parent galaxy have been cited in several radio galaxies (Black et al., 1992; Gopal-Krishna and Wiita, 2000). The lack of emission along a columnar region about the core has been speculated as arising due to the docking of the backflowing lobe plasma by an extended disk of cold gas, situated at the center of the host galaxy, with its axis along the radio axis. These edges, seen previously in normal-sized powerful radio galaxies, have extents kpc. In the case of J0116473, only one lobe reveals a sharp, straight edge towards the core and it is seen to be nearly a megaparsec in length.
Radio galaxies having such extended features at large angles to the main source axis are usually recognised as winged and X-shaped sources. These extended, fainter features are thought to be remnants of older activity or cavities in the IGM — excavated during an older activity — into which newer lobe plasma has flowed (Leahy and Williams, 1984). These sources are considered to have undergone a change in the direction of ejection over a large angle. If we conjecture that the linear bar-like feature is a remnant of past activity (prior to the formation of S1 and N1) in the same host galaxy, the galaxy has since moved kpc and this may take yr assuming velocities typical for galaxies in small groups (Hickson, 1997). A relict with this age may not be expected to be visible owing to expansion and radiation losses; however, backflow from S1 may render the cavity visible by replenishing it.
The bar in J0116473 has a high fractional polarization and B-field oriented along its length. These properties are also seen in low-surface-brightness wings of X-shaped sources (e.g. 0828+32, 3C223.1, 3C403 and 4C12.03); however, they are more striking in J0116473. If backflow from the southern outer lobe of J0116473 flows into the relict cavity — as is required to render it visible — the uniform projected B-field and the high fractional polarization might be indicating an ordered flow along the bar and possibly a stretching of the fields as the plasma expands at the end of the relict channel.
The radio structures seen in J0116473 are not unlike those in the X-shaped radio galaxy 4C12.03 (Leahy and Perley, 1991). In this latter object, as well, there are three distinct structures which may be associated with three successive activity phases: an extended double along the main axis of the radio source, an inner double along the same axis and a fainter bar-like feature with straight edges of almost 800 kpc extent which makes a large angle with the main axis of the radio galaxy.
In the scenario proffered above for the formation of the structures in J0116473, the required large change in the ejection axis between the first episode (responsible for the bar) and the second (responsible for N1 and S1) may be produced by an interaction with a sufficiently massive intruder that re-aligns the black hole axis (Natarajan and Pringle, 1998). The lack of change in the ejection axis in the restarting episode, which resulted in the inner lobes N2 and S2, may be a result of an interaction involving a smaller intruder that does not bring with it sufficient angular momentum to perturb the ejection axis significantly. Alternately, constancy of the ejection axis in restarting episodes might be a result of multiple encounters between the host galaxy with a single intruder (Schoenmakers et al., 2000b), in which the successive encounters alter the activity state of the central engine without significantly perturbing the black hole axis.
6 Summary
We have presented 12 and 22 cm total-intensity and polarization ATCA observations of the giant radio galaxy J0116473. The observations were carried out with the purpose of following up on intriguing aspects noted for this galaxy in an earlier work. Our new higher dynamic range observations have provided much support for our earlier hypothesis of interrupted nuclear activity in this source. The inner double structure located within the much larger diffuse lobes is argued to be a pair of new lobes formed as a result of renewed activity in the core. The observations show this inner double in detail revealing its edge brightened morphology, its symmetric location about the core, and a narrow jet.
The 1-Mpc long bar-like feature close to the core is seen to be highly polarized with fractional polarization as high as 50 per cent all along its length and with projected magnetic field vectors oriented along its length. We discuss a possible origin for this feature, suggesting it to be a result of earlier activity. Additionally, we note the presence of two other unusual features seen in this source, a band of low rotation measure along the length of the source and a step in the rotation measure situated towards the southern inner lobe. We briefly discuss possible causes for these features.
References
- Baum et al. (1990) Baum, S.A., O’Dea, C.P., Murphy, D.W., de Bruyn, A.G., 1990 A&A, 232, 19
- Black et al. (1992) Black, A.R.S., Baum, S.A., Leahy, J.P., Perley, R.A., Riley, J.M., Scheuer, P.A.G., 1992 MNRAS, 256, 186
- Bridle, Perley and Henriksen (1986) Bridle, A.H., Perley, R.A., Henriksen, R.N., 1986 AJ, 92, 534
- Burles et al. (1999) Burles, S., Nollett, K., Truran, J., Turner, M.S., 1999 Phys. Rev. Lett., 82, 4176
- Clark (1980) Clark, B. G., 1980 A&A, 89, 377
- Clarke and Burns (1991) Clarke, D.A., Burns, J.O., 1991 ApJ, 369, 308
- Clarke et al (1992) Clarke, D.A., Bridle, A.H., Burns, J.O., Perley, R.A., Norman, M.L., 1992 ApJ, 385, 173
- Cornwell (1983) Cornwell, T. J., 1983 A&A, 121, 281
- Danziger, Goss and Frater (1978) Danziger, I. J., Goss, W. M., Frater, R. H., 1978 MNRAS, 184, 341
- Fanaroff and Riley (1974) Fanaroff, B.L., Riley, J.M., 1974 MNRAS, 167, 31p
- Fixen et al. (1996) Fixen, D.J., Cheng, E.S., Gales, J.M., Mather, J.C., Shafer, R.A., Wright, R.L., 1996 ApJ, 486, 623
- Gopal-Krishna and Wiita (2000) Gopal-Krishna, Wiita, P.J., 2000 ApJ, 529, 189
- Haverkorn, Katgert and de Bruyn (2000) Haverkorn, M., Katgert, P., de Bruyn, A.G., 2000 A&A, 356, L13
- Hickson (1997) Hickson, P., 1997, ARA&A, 35, 357
- Kaiser, Schoenmakers and Roettgering (2000) Kaiser, C.R., Schoenmakers, A.P., Roettgering, H.J.A., 2000 MNRAS, 315, 381
- Komissarov and Gubanov (1994) Komissarov, S.S., Gubanov, A.G., 1994 A&A, 285, 27
- Lara et al. (1999) Lara, L., Marquez, I., Cotton, W.D., Feretti, L., Giovannini, G., Marcaide, J.M., Venturi, T., 1999 A&A, 348, 699
- Leahy (1991) Leahy, J.P., 1991, Beams and Jets in Astrophysics, ed P.A. Hughes, Cambridge University Press, 100
- Leahy and Perley (1991) Leahy, J.P., Perley, R.A., 1991 AJ, 102, 537
- Leahy and Williams (1984) Leahy, J.P., Williams, A.G., 1984 MNRAS, 210, 929
- Leahy et al. (1997) Leahy, J.P., Black, A.R.S., Dennet-Thorpe, J., Hardcastle, M.J., Komissarov, S., Perley, R.A., Riley, J.M., Scheuer, P.A.G., 1997 MNRAS, 291, 20
- Miley (1980) Miley, G.K., 1980 ARA&A, 18, 165
- Natarajan and Pringle (1998) Natarajan, P., Pringle, J.E., 1998 ApJ, 506, 97L
- Roettiger et al. (1994) Roettiger, K., Burns, J.O., Clarke, D.A., Christiansen, W.A., 1994 ApJ, 421, L23
- Scheuer (1995) Scheuer, P.A.G., 1995 MNRAS, 277, 331
- Schoenmakers et al. (2000a) Schoenmakers, A.P., de Bruyn, A.G., Rottgering, H.J.A., van der Laan, H., Kaiser, C.R., 2000 MNRAS, 315, 371
- Schoenmakers et al. (2000b) Schoenmakers, A.P., de Bruyn, A.G., Rottgering, H.J.A., van der Laan, H., 2000 MNRAS, 315, 395
- Subrahmanyan and Saripalli (1993) Subrahmanyan, R., Saripalli, L., 1993 MNRAS, 260, 908
- Subrahmanyan, Saripalli and Hunstead (1996) Subrahmanyan, R., Saripalli, L., Hunstead, R.W.H., 1996 MNRAS, 279, 257
- The Australia Telescope (1992) The Australia Telescope, 1992, special issue of J. electr. electron. Eng. Aust., 12, June
- Wieringa et al (1993) Wieringa, M.H., de Bruyn, A.G., Jansen, D., Brouw, W.N., Katgert, P., 1993 A&A, 268, 215
- Willis and O’Dea (1990) Willis, A.G., O’Dea, C.P., 1990, Galactic and Intergalactic Magnetic Fields, IAU Symposium 140, eds. R. Beck, P.P. Kronberg and R. Wielebinski, 455