22institutetext: Wide Field Astronomy Unit, Institute for Astronomy, University of Edinburgh, Blackford Hill, Edinburgh, EH9 3HJ, UK.
The Liverpool-Edinburgh High Proper Motion Survey
We present a catalogue of 6206 stars which have proper motions exceeding 0.18yr-1 with an R-band faint magnitude limit of 195mag. This catalogue has been produced using SuperCOSMOS digitized R-Band ESO and UK Schmidt Plates in 131 Schmidt fields covering more than 3,000 square degrees (75 of the whole sky) at the South Galactic Cap. The survey is 90 complete within the nominal limits of the Luyten Two Tenths Catalogue of 185mag and 0225yr-1, and is 80 complete for 195mag and 25yr-1.
Key Words.:
Galaxy: kinematics and dynamics – Galaxy: halo – solar neighbourhood – Stars: late-type – subdwarfs – white dwarfs1 Introduction
1.1 Proper Motion Surveys
Proper motion surveys can give us a good insight into stellar populations and dynamics in the Solar neighbourhood. They identify nearby objects, allow analysis of their space motions and, with data in more than one passband, give population differentiation. These three factors mean that proper motion surveys are ideal in addressing the problems of the local stellar mass function and the halo mass function, both of which are currently poorly constrained (e.g. Henry et al., 1997, Lee 1993). The problem with the local stellar mass function is in large part due to the undersampling of nearby stars upon which it is mainly based. Identification of objects such as the nearby brown dwarf Kelu-1 (Ruiz et al. 1997), which was discovered as part of the Calan-ESO proper motion survey (Ruiz et al. 2001) and has an astrometrically estimated distance of 10pc, are vital in this respect. Both present day and initial halo mass functions are poorly constrained (Lee 1993) due to a number of factors. These include the relatively low number of nearby halo subdwarf stars and the difficulty in obtaining accurate distances for them. However, halo stars have greater space velocity and velocity dispersion than disc stars which means that a halo star will have a higher proper motion than a disc star at the same distance. When combined with their subluminosity this provides an excellent method of differentiating them from disc stars (seeSect. 51).
However, all of the existing surveys suffer from one or more of the following problems;
-
•
internal inhomogeneities which make statistical analysis difficult and unreliable,
-
•
low areal coverage which makes a survey subject to low number statistics,
-
•
use of non-contiguous survey fields which prevents cross-checking of discovered objects and completeness levels from areas where contiguous fields overlap.
One of the main purposes of this survey is to address these problems by conducting an internally homogeneous large area survey in contiguous fields by means of scripted computer algorithms. By using only the R-band plates we also ensured that the survey would have a high completeness relative to other surveys which require an object to be present in more than one passband, thus missing faint objects with extreme colours, such as brown dwarfs and ancient halo subdwarfs and white dwarfs. This is important because these objects are among the most astrophysically interesting to be selected by proper motion surveys. Using only the R-band plates also means that our completeness is easier to assess.
1.2 The Luyten Catalogues
The largest catalogue of high proper motion stars to date is the New Luyten Catalogue of Stars with Proper Motions Greater Than Two Tenths of an Arcsecond (NLTT) (Luyten, 1979). The NLTT and the Luyten Half Second Proper Motion Catalogue (LHS) (Luyten, 1979) were compiled over a period of 60 years from two main surveys; the Bruce Proper Motion Survey (BPM), covering an area from the South Celestial Pole to a declination of +25∘, and the Palomar Observatory Sky Surveys (POSS I and II) covering the area from the North Celestial Pole to –33∘. The nominal faint limit of the Bruce survey is R165mag and the faint limit of the POSS is R20mag (Morgan et al., 1992), the Luyten Catalogues have no stated bright limit. The Luyten proper motion measurements were made using two different techniques; (i) manual plate blinking and (ii) automatic machine detection (Williams, 2000). The Luyten catalogues therefore contain some internal inhomogeneities such as a brighter limiting magnitude for fields south of –33∘ and variations in the completeness of the catalogues between different areas of the surveys. The stated proper motion limits of the NLTT are 018yr-125yr-1 whilst the LHS comprises stars from the NLTT with 05yr-1.
1.3 Other Surveys and the Completeness of the Luyten Catalogues
There have been a number of estimates of the completeness of the NLTT and LHS catalogues in recent years, mostly based on the results of small area proper motion surveys.
Scholz et al. (2000) conducted a survey in 40 fields using the Automatic Plate Measuring microdensitometer (APM) at Cambridge, UK. They discuss the completeness of previous catalogues, as well as how they find far more stars in the relatively incomplete southern area of the NLTT, but beyond stating that the NLTT is incomplete they do not quantify their own completeness or, using their data, the completeness of the NLTT.
Evans (1992) compared the results from four fields of the APM proper motion project to the results for the same areas from the NLTT. He discovered a number of NLTT stars which, when measured with the APM microdensitometer, proved to have proper motions below the 018yr-1 cutoff limit. He also found a larger number of stars which had proper motions above this limit which were not listed in the NLTT. By conducting a Monte Carlo simulation he showed that these discrepancies could be almost entirely attributed to random measuring errors. He further stated that these errors led to a contamination of between 10 and 20 and an incompleteness of 16 (ie a completeness of 84). However, whilst the comparison was meticulously carried out and extremely detailed it relied on comparison of a very small number of fields. It is therefore possible that it suffers from selection effects and small number statistics.
Ruiz et al. (2001) compared their results from the Calan-ESO proper motion catalogue to the Luyten catalogues and concluded that for 0.8yr-1 and R13mag the LHS catalogue is 60 complete. They also state that the Luyten Two Tenths catalogue (LTT) is 40 complete for R13mag, but this refers to the 1975 version of the Two Tenths catalogue, which was superseded by the more complete NLTT in 1979. The Ruiz et al. comparison suffers from a similar problem to that of Evans in that it used the relatively small number of 14 fields. In addition to this their survey was conducted by manual blink comparison which is always prone to human error, as highlighted by the larger incompleteness of the southern BPM section of the NLTT over the northern POSS section. It was also conducted at low Galactic latitude b40∘ because fields at high Galactic latitude do not contain enough background stars for efficient blink comparison, which could be an important contributory factor in the incompleteness of the BPM section of the NLTT.
Dawson (1986) applied the V/Vmax method as described by Schmidt (1968, 1975) to estimate a completeness of 90 for -33∘, b10∘, R18mag and 05yr-1 (i.e. the northern areas of the LHS).
Flynn et al. (2001) applied a statistical test to the NLTT consisting of taking two concentric spheres centred around the Sun whose volumes are in the ratio 2:1 (thereby giving them a radial ratio of 1259 which corresponds to an average magnitude difference of 05mag between the shells) and assuming that the completeness for stars in the inner sphere is 100. It is then possible to calculate the completeness of the stars in the outer ‘shell’, and by applying this to different magnitude bins they derive a plot of completeness for the LHS and NLTT catalogues relative to the completeness at R=13 (assumed for the purposes of the plot to be 100 complete). This analysis shows the completeness of the NLTT dropping steadily from 80 at R=14 to 60 at R=185mag. However, Monet et al. (2000) suggest that this analysis is flawed since it does not take into account the different space densities of stars at high and low Galactic Latitude. Their recomputation of the Flynn et al. test gives a completeness at low Galactic latitude (15b35) of between 75 and 85 for 14R18mag.
Monet et al. (2000) conducted a survey in 35 fields using POSS II plates and estimated that the LHS is 90 complete, as well as recalculating the result of Flynn et al. (discussed above).
2 The Data and Search Process
2.1 The SuperCOSMOS Sky Survey
The SuperCOSMOS Sky Survey (SSS) (Hambly et al. 2001a) is a project of the Wide-Field Astronomy Unit at the Royal Observatory Edinburgh. The purpose of the project is to digitise Schmidt survey plates from the ESO, UK and Palomar (southern area) Schmidt surveys with the SuperCOSMOS microdensitometer machine and make the digitised data available online to the general astronomical community.
2.2 The Survey Data
The proper motion survey was conducted by comparison of two epochs of SuperCOSMOS digitized R-band Schmidt plates. The plates used are the ESO Schmidt and the Anglo-Australian UK Schmidt R-band surveys. The two surveys were taken at different observatories by different groups which means that the epoch differences between the plates vary. In the majority of cases the ESO plate was taken before the UK plate, although in a very small number of cases the UK plate is earlier. The average epoch difference is 85 years and the vast majority of fields have epoch differences between 5 and 13 years (see Fig. 2). The survey was conducted using only the two R-band plates in order not to miss faint objects with extreme colours, such as late M dwarfs or brown dwarfs, which might not be found by a search which also required detections in the BJ and I band plates. Once the survey was completed the positions of the candidate high proper motion stars were extrapolated to the BJ and I band plates in order to extract BRI colour information where possible.

2.3 The Digitized Data
The data has been digitized using the SuperCOSMOS microdensitometer at the Royal Observatory Edinburgh UK (Hambly et al. 1998) as part of the SuperCOSMOS Sky Survey (Hambly et al., 2001, a, b & c). Each object on the plate is reduced to 32 image parameters which describe its position, size, intensity, etc., in a format known as Image Analysis Mode (IAM) (Hambly et al., 2001a). These parameters make it possible to perform full astrometry and photometry on the data and to compare the data from two or more plates of the same field.
2.4 The Search Programs
The survey was conducted by a series of programs which manipulate the IAM files to perform full relative astrometry on the two epochs of each field. The programs attempt to pair all objects between the two plates from which the high proper motion stars may be selected. Objects are selected for the search process on the basis of a number of the IAM image parameters;
-
•
the quality flag (which indicates if there are any problems with the object such as it being too faint, too bright, too large or too small),
-
•
the deblending flag which indicates if the object is part of a larger object (e.g. part of the diffraction spike or halo of a bright star),
-
•
the classification flag, which indicates whether the object is a galaxy, a star, dust or dirt, or too faint to classify.
The first task is to match the coordinate system of the UK plate to that of the ESO plate and trim the edges from the data (the latter being important because the UK plates are 6∘ square whilst the ESO plates are 5∘ square). The data for both plates is then reordered within the IAM files into 24 lanes so that the pairing programs only need to search a limited area of the plates rather than the whole of the dataset thus saving computer time and resources.
The position of each object on the UK plate is then checked against the ESO plate for any object at the same position. This is a simple first pass procedure to identify objects which have zero proper motion. Every ESO plate object left unpaired by this procedure is searched for on the UK plate in annuli of gradually increasing radius. The search looks for any object which has similar IAM image parameters to that of the object on the ESO plate. When a match is found an identifier is written to a file of paired objects and the program moves on to the next object. If no match is found within the cutoff radius the program writes a null identifier to the pairs file.
The search is conducted in this two step manner because the likelihood of finding a match decreases as the search radius increases. Searching the entire area out to the cut-off radius in one pass would use a large amount of computer time and processing power, which would be mostly wasted since for the vast majority of stars a match will be found within the first few annuli. Additionally, searching the full radius in one go could result in two or three objects being identified as possible pairings for every ESO object, requiring the software to choose between these objects as to which is the most likely to be the correct one. Again, this would again be a waste of time and processor power, since the most likely match of two or more similar candidates would always be the one nearest to the first epoch position.
We then perform full relative astrometry on the stars in x and y plate coordinates (measured in mm). The next stage is to calculate a transformation from x-y to RA-dec coordinates, which can then be applied to the x-y relative astrometry to yield full relative proper motions in RA and dec. Once this has been done catalogue stars can be selected by applying proper motion cuts to the paired objects. Finally the catalogue can be compared to an electronic version of the NLTT (see Sect. 4).
Limits of 018yr-1200yr-1, and 9R195mag were applied to the final selection of proper motion objects. The lower proper motion limit was chosen to avoid any erroneous pairings due to the positional errors in the SuperCOSMOS data and to be consistent with the NLTT. The high proper motion limit was chosen to be well above any expected proper motion in order to include all potential objects. The bright magnitude limit was chosen because of the problems encountered with bright objects on a Schmidt plate (e.g. size of image, diffraction and saturation), whilst the faint magnitude limit was chosen because it becomes extremely difficult to differentiate by eye between dust and true stellar images for R195mag on a Schmidt plate, which must always be the final test for any proper motion object discovered from the digitized data. This has the additional effect that the object classification contained in the IAM data becomes less accurate for faint objects which also makes selection of good pairs by use of the programs extremely difficult for images fainter than R=195mag.
After the proper motion selection was completed the data was compared to the BJ and I band plates (where available) in order to obtain magnitude data for the objects in those passbands.
3 The Catalogue
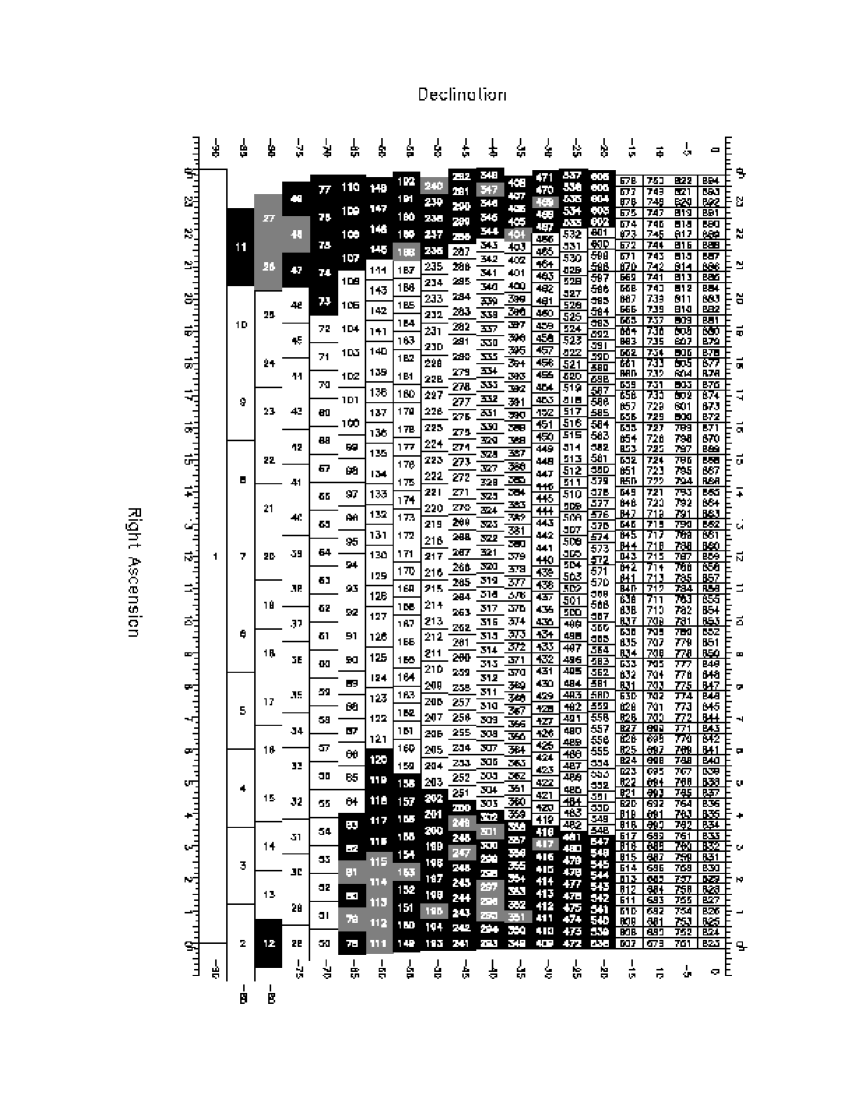
The catalogue comprises 6605 objects, 399 of which are extra detections of stars from the plate overlap regions and are already listed in the catalogue. This means that there are actually 6206 high proper motion stars in the catalogue. They lie within an area of -82.5∘dec-22.5∘ and 21hrsRA5hrs with magnitude limits of 9mR19.5mag and proper motion limits of 0.1820yr-1. Table 1 is a sample from the catalogue, comprised of the first 40 objects.
The columns are; catalogue number, right ascension (hr, m, s) and declination (∘, , ) (equinox J2000 at the epoch of the ESO plate), multiple detection flag, ESO/SRC number of the field the object was located on, Epoch of ESO observation, proper motion in R.A., error on proper motion in R.A., proper motion in dec, error on proper motion in dec, total proper motion, error on total proper motion (all proper motions and their associated errors are given in yr-1), position angle of proper motion (in degrees), apparent magnitudes: BJ, RESO, RUK, I. The multiple detection flag indicates where, in an overlap region between plates, an object is identified more than once (in some cases four times). This flag is 0 if the object is not a multiple detection or has the more accurate data of the mutiple detections. The flag is 1 if the object is a multiple detection with less accurate data, e.g. where there is no matching object was identified on the BJ or I band plates or the proper motion error is higher than for other detections. In those cases where no match could be found in the BJ or I band plates the apparent magnitude is given as 0.00.
| NC | R.A. | dec | FM | Fld | Epoch | α | μα | δ | μδ | P.A. | BJ | RESO | RUK | I | ||||||
|---|---|---|---|---|---|---|---|---|---|---|---|---|---|---|---|---|---|---|---|---|
| 1 | 0 | 0 | 0.364 | -46 | 1 | 4.89 | 0 | 292 | 1989.513 | 0.1662 | 0.0184 | -0.0928 | 0.0192 | 0.1894 | 0.0265 | 117.42 | 19.55 | 17.56 | 17.66 | 16.87 |
| 2 | 0 | 0 | 7.346 | -40 | 39 | 52.36 | 0 | 348 | 1985.774 | -0.0446 | 0.0182 | -0.1995 | 0.0198 | 0.2035 | 0.0267 | 191.33 | 17.82 | 15.79 | 15.92 | 14.76 |
| 3 | 0 | 0 | 7.353 | -40 | 39 | 52.90 | 1 | 293 | 1988.853 | -0.0228 | 0.0412 | -0.2003 | 0.0251 | 0.2007 | 0.0480 | 186.97 | 17.73 | 15.70 | 15.70 | 14.50 |
| 4 | 0 | 0 | 12.691 | -31 | 46 | 19.22 | 0 | 409 | 1981.750 | 0.1856 | 0.0472 | -0.0398 | 0.0532 | 0.1887 | 0.0707 | 102.41 | 14.23 | 12.05 | 12.25 | 11.31 |
| 5 | 0 | 0 | 18.360 | -27 | 8 | 36.13 | 1 | 409 | 1981.750 | 0.2766 | 0.0300 | -0.0896 | 0.0359 | 0.2892 | 0.0465 | 108.19 | 14.72 | 12.32 | 12.65 | 11.42 |
| 6 | 0 | 0 | 18.448 | -27 | 8 | 36.32 | 0 | 537 | 1986.806 | 0.2626 | 0.0175 | -0.0732 | 0.0096 | 0.2714 | 0.0199 | 104.72 | 14.70 | 12.36 | 12.65 | 11.32 |
| 7 | 0 | 0 | 18.488 | -27 | 8 | 36.59 | 1 | 471 | 1989.530 | 0.2417 | 0.0253 | -0.1389 | 0.0958 | 0.2774 | 0.0986 | 118.54 | 14.72 | 12.41 | 12.36 | 11.33 |
| 8 | 0 | 0 | 18.527 | -27 | 8 | 36.86 | 1 | 472 | 1990.728 | 0.2654 | 0.0424 | -0.0697 | 0.0440 | 0.2731 | 0.0608 | 104.93 | 14.55 | 12.20 | 12.23 | 10.76 |
| 9 | 0 | 0 | 19.380 | -26 | 12 | 48.55 | 1 | 537 | 1986.806 | 0.2374 | 0.0180 | -0.0420 | 0.0188 | 0.2399 | 0.0259 | 99.22 | 19.75 | 17.35 | 17.52 | 15.69 |
| 10 | 0 | 0 | 19.455 | -26 | 12 | 48.80 | 0 | 472 | 1990.728 | 0.2140 | 0.0179 | -0.0337 | 0.0183 | 0.2156 | 0.0255 | 99.18 | 19.56 | 17.31 | 17.43 | 15.54 |
| 11 | 0 | 0 | 22.130 | -41 | 33 | 45.67 | 1 | 293 | 1988.853 | -0.0444 | 0.0395 | -0.2279 | 0.0260 | 0.2310 | 0.0471 | 191.45 | 17.58 | 15.45 | 15.76 | 14.23 |
| 12 | 0 | 0 | 22.135 | -41 | 33 | 45.01 | 0 | 348 | 1985.774 | -0.0551 | 0.0236 | -0.2289 | 0.0228 | 0.2343 | 0.0326 | 192.23 | 17.72 | 15.60 | 15.74 | 14.01 |
| 13 | 0 | 0 | 24.175 | -39 | 4 | 4.21 | 0 | 348 | 1985.774 | 0.1409 | 0.0373 | -0.1173 | 0.0234 | 0.1825 | 0.0438 | 128.49 | 17.01 | 14.66 | 14.89 | 12.79 |
| 14 | 0 | 0 | 24.226 | -39 | 4 | 4.64 | 1 | 293 | 1988.853 | 0.1571 | 0.0546 | -0.1160 | 0.0391 | 0.1944 | 0.0669 | 126.85 | 16.73 | 14.54 | 14.73 | 13.03 |
| 15 | 0 | 0 | 25.643 | -18 | 46 | 1.64 | 0 | 538 | 1984.788 | 0.2006 | 0.0122 | 0.0125 | 0.0199 | 0.2000 | 0.0232 | 86.65 | 18.69 | 16.50 | 16.62 | 14.40 |
| 16 | 0 | 0 | 25.652 | -18 | 46 | 1.60 | 1 | 606 | 1985.626 | 0.1974 | 0.0268 | 0.0243 | 0.0324 | 0.1980 | 0.0418 | 82.20 | 18.39 | 15.99 | 16.07 | 13.89 |
| 17 | 0 | 0 | 26.931 | -41 | 25 | 30.40 | 0 | 348 | 1985.774 | 0.4938 | 0.0236 | -0.0489 | 0.0228 | 0.4939 | 0.0326 | 94.29 | 17.70 | 15.74 | 15.65 | 14.57 |
| 18 | 0 | 0 | 27.089 | -41 | 25 | 30.44 | 1 | 293 | 1988.853 | 0.5038 | 0.0395 | -0.0456 | 0.0260 | 0.5035 | 0.0471 | 95.60 | 17.68 | 15.54 | 15.68 | 14.68 |
| 19 | 0 | 0 | 30.500 | -26 | 13 | 54.54 | 1 | 537 | 1986.806 | 0.2913 | 0.0557 | 0.0861 | 0.0379 | 0.3023 | 0.0671 | 72.68 | 14.53 | 12.24 | 12.63 | 11.12 |
| 20 | 0 | 0 | 30.594 | -26 | 13 | 54.26 | 0 | 472 | 1990.728 | 0.3026 | 0.0443 | 0.0954 | 0.0322 | 0.3158 | 0.0545 | 72.72 | 14.20 | 11.72 | 12.09 | 10.74 |
| 21 | 0 | 0 | 32.679 | -53 | 26 | 4.18 | 0 | 149 | 1989.597 | 0.1754 | 0.0173 | -0.1351 | 0.0167 | 0.2204 | 0.0239 | 127.94 | 18.92 | 16.61 | 16.75 | 14.53 |
| 22 | 0 | 0 | 33.945 | -36 | 50 | 8.79 | 0 | 349 | 1988.788 | 0.4433 | 0.0469 | 0.0866 | 0.0497 | 0.4495 | 0.0680 | 79.27 | 16.14 | 14.06 | 14.21 | 12.84 |
| 23 | 0 | 0 | 35.458 | -45 | 15 | 5.96 | 0 | 292 | 1989.513 | 0.1913 | 0.0481 | -0.0289 | 0.0299 | 0.1925 | 0.0564 | 96.72 | 14.28 | 12.69 | 12.84 | 12.16 |
| 24 | 0 | 0 | 36.181 | -47 | 7 | 50.26 | 0 | 292 | 1989.513 | 0.1974 | 0.0203 | -0.0920 | 0.0204 | 0.2167 | 0.0286 | 113.07 | 20.53 | 18.07 | 18.28 | 17.25 |
| 25 | 0 | 0 | 36.221 | -47 | 7 | 50.34 | 1 | 193 | 1989.583 | 0.1795 | 0.0256 | -0.0932 | 0.0224 | 0.2013 | 0.0339 | 117.79 | 20.72 | 18.30 | 18.47 | 17.41 |
| 26 | 0 | 0 | 36.735 | -40 | 29 | 16.69 | 1 | 348 | 1985.774 | 0.1975 | 0.0374 | -0.0684 | 0.0365 | 0.2080 | 0.0520 | 107.76 | 15.70 | 14.39 | 14.45 | 13.90 |
| 27 | 0 | 0 | 36.799 | -40 | 29 | 16.83 | 0 | 293 | 1988.853 | 0.2033 | 0.0379 | -0.0613 | 0.0240 | 0.2113 | 0.0446 | 107.17 | 15.69 | 14.44 | 14.44 | 13.79 |
| 28 | 0 | 0 | 37.350 | -24 | 38 | 26.40 | 0 | 472 | 1990.728 | -0.1293 | 0.0309 | -0.2127 | 0.0440 | 0.2477 | 0.0535 | 211.49 | 16.95 | 14.57 | 14.67 | 12.69 |
| 29 | 0 | 0 | 37.401 | -24 | 38 | 25.76 | 1 | 537 | 1986.806 | -0.1489 | 0.0452 | -0.1858 | 0.0345 | 0.2370 | 0.0566 | 217.88 | 17.12 | 14.92 | 15.18 | 13.18 |
| 30 | 0 | 0 | 45.060 | -62 | 43 | 41.48 | 0 | 78 | 1988.689 | 0.2170 | 0.0509 | -0.2317 | 0.0472 | 0.3159 | 0.0691 | 137.21 | 13.34 | 11.13 | 11.46 | 10.28 |
| 31 | 0 | 0 | 47.988 | -31 | 31 | 33.46 | 0 | 409 | 1981.750 | 0.0063 | 0.0641 | -0.1844 | 0.0244 | 0.1835 | 0.0682 | 178.25 | 12.90 | 11.95 | 12.28 | 11.83 |
| 32 | 0 | 0 | 51.837 | -33 | 53 | 14.74 | 0 | 349 | 1988.788 | 0.1803 | 0.0286 | 0.0156 | 0.0239 | 0.1801 | 0.0371 | 85.31 | 18.59 | 16.45 | 16.53 | 14.55 |
| 33 | 0 | 0 | 55.111 | -53 | 19 | 47.56 | 0 | 149 | 1989.597 | 0.1781 | 0.0546 | -0.0736 | 0.0171 | 0.1918 | 0.0570 | 112.71 | 17.12 | 14.81 | 14.94 | 13.30 |
| 34 | 0 | 0 | 56.293 | -79 | 51 | 22.35 | 0 | 12 | 1984.739 | 0.2041 | 0.0132 | 0.0857 | 0.0088 | 0.2203 | 0.0158 | 67.62 | 17.81 | 15.61 | 15.76 | 13.67 |
| 35 | 0 | 0 | 59.144 | -25 | 41 | 39.11 | 0 | 537 | 1986.806 | 0.0082 | 0.0309 | -0.2114 | 0.0188 | 0.2105 | 0.0360 | 176.91 | 16.19 | 14.64 | 14.74 | 13.92 |
| 36 | 0 | 1 | 1.621 | -21 | 48 | 51.16 | 0 | 538 | 1984.788 | 0.0764 | 0.0263 | -0.2299 | 0.0187 | 0.2411 | 0.0321 | 161.77 | 17.15 | 15.33 | 15.23 | 13.24 |
| 37 | 0 | 1 | 4.854 | -33 | 57 | 39.33 | 0 | 349 | 1988.788 | 0.2701 | 0.0666 | -0.0838 | 0.0509 | 0.2815 | 0.0835 | 107.46 | 16.75 | 14.60 | 14.56 | 13.05 |
| 38 | 0 | 1 | 26.461 | -42 | 53 | 8.67 | 1 | 292 | 1989.513 | 0.1973 | 0.0265 | -0.0825 | 0.0289 | 0.2128 | 0.0390 | 110.76 | 16.18 | 14.26 | 14.25 | 13.32 |
| 39 | 0 | 1 | 26.499 | -42 | 53 | 8.58 | 0 | 241 | 1989.806 | 0.1836 | 0.0154 | -0.0504 | 0.0223 | 0.1895 | 0.0270 | 105.53 | 16.27 | 14.31 | 14.49 | 13.55 |
| 40 | 0 | 1 | 27.468 | -30 | 36 | 31.17 | 0 | 409 | 1981.750 | 0.1509 | 0.0341 | -0.1498 | 0.0178 | 0.2114 | 0.0383 | 134.92 | 16.77 | 14.88 | 14.78 | 14.04 |
4 Completeness of the Survey
4.1 The completeness test
Our completeness test consists of placing 100 simulated proper motion stars, each of which has the same magnitude and proper motion, into the data set for an ESO field and conducting the search process to see how many are recovered. This is repeated for the same magnitude with increasing proper motion starting from 03yr-1 then 05yr-1 and then in steps of 05yr-1 up to 10yr-1. The same procedure is then repeated for every 05 magnitudes from R=12mag to R=19mag.
The lower limit of 03yr-1 was used because the simulated stars are added to the data after the coordinate matching procedure but before the astrometric solution is applied to the data. The calculated proper motions of the simulated stars can therefore vary by more than 10, which means that an input proper motion of 02yr-1 results in some of the simulated stars being lost due to their calculated proper motions falling below the lower proper motion cutoff limit of 018yr-1. The upper limit of 10yr-1 was chosen because no candidate star was discovered by the survey with a proper motion above 10yr-1.
One of the main problems with assessing the overall completeness of this survey is the way in which the plate epoch differences vary from field to field. An increase in epoch difference means that, for a given proper motion, the physical image separation of a star between the two epochs will also increase. This results in an increase in the probability of an erroneous pairing which will in turn reduce the completeness. Fortunately this problem can be quantified by running the test on fields with different epoch differences. For this reason the tests were carried out on three fields;
-
•
Field 188, with a 2980 year epoch difference,
-
•
Field 479, with a 9078 year epoch difference,
-
•
Field 158, with a 16911 year epoch difference,
These fields are representative of the shortest and longest epoch differences as well as an epoch difference roughly halfway between these two extremes.
4.2 Epoch difference limits on fields used in the survey
Fields with epoch differences of less than 3 years were discarded due to a large increase in false pairings at these shorter epoch differences. It was originally thought that these false pairings were caused by dirt and dust which are randomly distributed on the plates. However, there are too few dust particles on the UK plates which could be paired with the stars on the ESO plates to have such a large effect on the number of pairings. The overall proper motion errors are, on average, about 0.04yr-1, but analysis of these errors reveals that they increase for fields with a short epoch difference. The proper motion error is propogated from the centroiding errors on the SuperCOSMOS data. This increase begins to have a significant effect on the proper motions at an epoch difference of slightly less than 3 years. The falsely identified stars are therefore not wrongly paired but are the result of the higher proper motion errors on stars with proper motions which are actually below the 0.18yr-1 cut off limit in plates with short epoch differences.
Although the completeness decreases for plates with large epoch differences (see Fig. 3) this is simply a systematic effect of the increase in the plate to plate separations of stars at any given proper motion increasing the likelihood of false pairings. Since this only affects faint objects with relatively large proper motions no upper limit was applied to the allowed epoch difference of plate pairs.
4.3 Completeness test result
Fig. 3 shows that for fields with a short epoch difference the test completeness remains over 90% for all magnitudes and proper motions tested. Fig. 3 shows how the completeness decreases for increasing epoch difference and Fig. 4 how it decreases for R18.5mag. This drop off is due partly to the increasing number of stars at faint magnitudes, and partly to dust and dirt on the plates, which can be difficult to distinguish from faint stars. The former results in an increase in the density of faint stars which in turn increases the probability of a false pairing. The latter is only a small effect for the reasons discussed above. Morgan et al. (1992) give the limiting magnitudes of both ESO R and UK R plates as 22, although they point out that the limiting magnitudes of Schmidt plates are not defined in a consistent manner. Hambly et al. (2001b) give the limit for identifying an object above the noise of an ESO Schmidt plate as R21. Our limit of R=19.5mag is therefore a little conservative, but appropriate since we need to do more than just identify objects above the noise and are aiming for a uniform catalogue.


4.4 Cumulative number of proper motion stars
Another measure of the completeness of the survey is relationship between the proper motion and the cumulative number of stars with proper motions equal to or greater than a given proper motion. For any tangential velocity, VT,
| (1) |
the volume (V) is proportional to r3.
For a uniform distribution of stars the number of stars per unit volume is constant (i.e.
is constant). Since
| (2) |
this implies that
| (3) |
and, therefore, that
| (4) |
Fig. 5 is plot of Nc against for all stars in this survey with 02yr-1. The data has a slope of -3.007 for 0210yr-1 and demonstrates that this survey is complete within these limits.

4.5 Completeness of the NLTT
This survey identified 6206 high proper motion objects in 75 of the whole sky with a completeness of 90. This implies 86,400 stars with magnitudes 9R19.5mag and proper motions 0.18yr-1 over the whole sky compared to the 58,845 stars in the NLTT, which would suggest at first sight that the overall completeness of the NLTT is 70. This is, however, extremely misleading since the NLTT is made up of two surveys (see Sect. 12). The POSS plate section of the survey (north of dec-33∘) has a nominal faint magnitude limit of R185mag, and was mostly conducted by a laser microdensitometer machine, thus making it largely free from human error. The BPM section (south of -33∘) has a nominal faint R-band magnitude limit of R165mag and was conducted entirely by eye on a blink comparator (which Luyten himself developed). The Luyten catalogues are therefore far less complete in the southern BPM area, as well as having a brighter limiting magnitude. Figs. 6 and 7 show how the completeness and faint limits of the different sections of the NLTT vary. Fig. 6 shows the number of high proper motion stars in the NLTT and this survey for the 43 fields in this survey which have field centres with dec- 30∘. Fig. 7 shows the number of high proper motion stars in the NLTT and this survey for the 73 fields in this survey which have field centres with dec-40∘. The overlap between fields with centres at dec=-35∘ and dec=-30∘ means that the fields with centres at dec=-35∘ contain a number of stars discovered from the POSS plates which would increase the number of stars in the NLTT relative to this catalogue. This would give a false indication of the relative numbers of stars between the two catalogues, and for this reason the 15 fields with plate centres at dec=-35∘ were omitted from this plot.
As discussed in Sect. 13, Monet et al. have also shown that the completeness of the NLTT is dependent on Galactic latitude. Our survey was conducted at Galactic latitudes -30∘b-90∘ which most nearly corresponds to the high Galactic latitude fields which Monet et al. show to be less complete. Our analysis shows that in the POSS section of the NLTT is 85 complete for 105R195mag and that the BPM section is 90 complete for R13mag with the completeness dropping off rapidly for fainter magnitudes.


5 Object populations and selection for follow up observations
As noted in Sect. 11, proper motion surveys can give an insight into both the local stellar neighbourhood and halo populations. In order to have a high proper motion an object must be either nearby or have a high space velocity (or both). High proper motion surveys therefore naturally select nearby and halo stars. Analysis of the objects identified by the survey requires differentiation of the populations, and this can be achieved by use of reduced proper motion and colour-colour diagrams. Astrophysically interesting objects can then be selected for follow up observations on this basis.
We recently obtained data for a number of stars selected from the catalogue on the ESO New Technologies Telescope at the La Silla observatory, Chile. The stars were selected as; those with the highest proper motions, candidate brown dwarfs, halo subdwarfs. These data are currently being reduced.
5.1 Reduced Proper Motion
The concept of reduced proper motion (H) was first used by Ejnar Hertzsprung (Luyten, 1968) as an alternative to absolute magnitude in order to produce ‘statistical’ HR diagrams. It combines the observable properties of proper motion, , and apparent magnitude, , via the equation,
| (5) |
From the definition of parallax it can be seen that,
| (6) |
where is the tangential velocity measured in kms-1, and is the parallax in arcseconds, and since,
| (7) |
where is in parsecs, it follows that,
| (8) |
Using this and the relation between apparent and absolute magnitudes,
| (9) |
we can substitute into eqn.5 to get,
| (10) |
From this it can be seen that the reduced proper motion, as calculated from the measured properties of proper motion and apparent magnitude, is equivalent to a combination of the absolute magnitude and tangential velocity, which are intrinsic properties of a star. Plotting the reduced proper motion against colour thus gives a plot which is in essence an H-R diagram modified to include tangential velocity, called a reduced proper motion diagram.
One of the advantages of such a plot is that the higher mean tangential velocity of halo subdwarfs, when combined with their intrinsic subluminosity makes them far easier to differentiate from the disk population. However, the spread in H of objects in a reduced proper motion diagram is far larger than the spread in magnitude in a standard H-R diagram because of the random spread of velocities about the mean values for the different populations. It also means that stars can be misidentified due to unusually high or low tangential velocities.
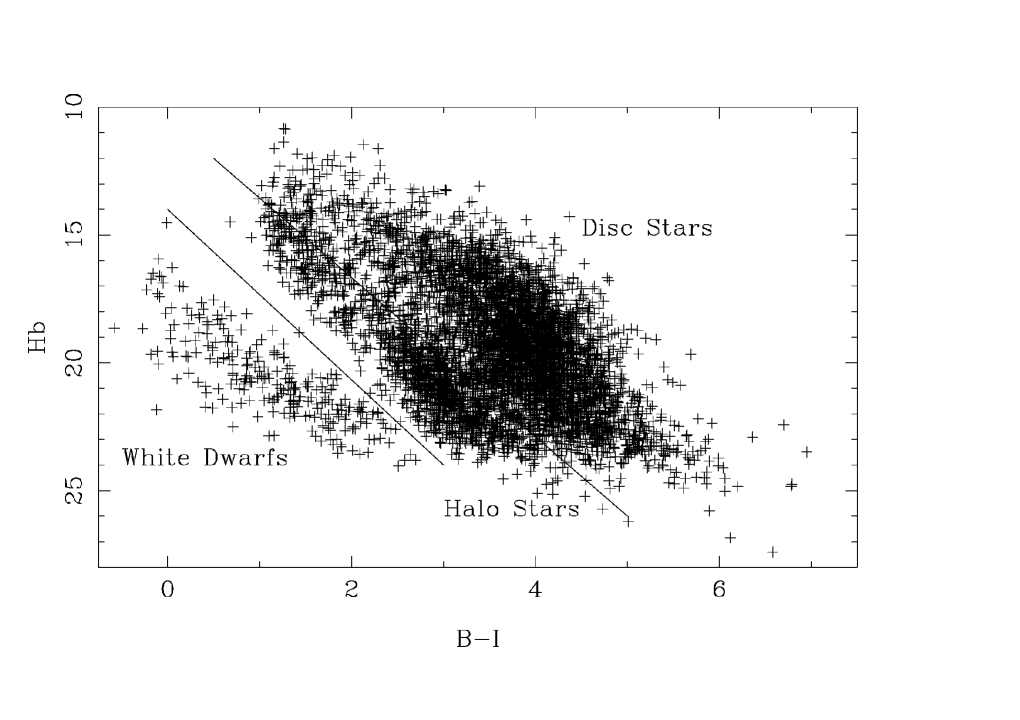
Fig. 8 is a plot of the B-band reduced proper motion (HB) against B-I and shows the differentiation between the white dwarf, halo and disc populations. It should be noted that for 150 faint red stars no matches could be found on the BJ plates.
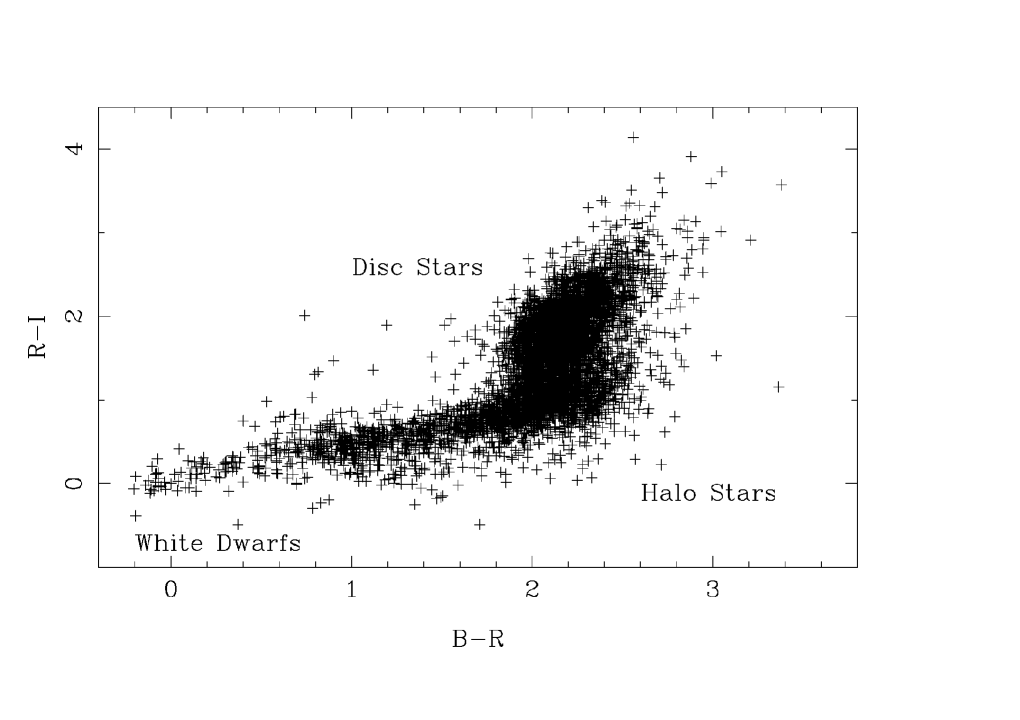
5.2 The Colour-Colour Diagram
The BRI two colour diagram (Fig. 9) utilises the BJ and I plates from the UK Schmidt survey. Halo subdwarfs and giant stars occupy the bottom right of this plot, the white dwarfs form the tail to the lower left and the disc main sequence runs from above the halo subdwarf region to the top right of the plot. This plot can therefore be used in conjunction with the reduced proper motion plots to differentiate between the various populations of objects.
6 Discussion
Over the past few years there have been several papers which offer a variety of values for the completeness of the Luyten catalogues, and discuss its shortcomings (see Sect. 12). The values offered for the completeness of the Luyten catalogues vary from 60 for mR13 (Ruiz et al., 2001,comparison to Calan-ESO survey conducted at low galactic latitude) to 90 for mR18 and 05yr-1 (Dawson 1986, V/Vmax method applied to northern areas of LHS)
Our completeness levels are the first to be calculated from an analysis of the search technique itself, and show that for the vast majority of stars in the catalogue (R19mag and 0225yr-1) the completeness is greater than 90. Fig. 6 therefore indicates that for the Northern areas (-33∘, b10∘) the NLTT is 85 complete. Fig. 7 shows the incompleteness of the Southern part of the NLTT for R13mag (25 complete for 15R165mag and 15 for 165R18mag).
We used the HB, B-I and the B–R, R–I plots to select halo subdwarfs. This selection yielded 1189 halo subdwarfs from a total of 6104 stars which have both B and I band magnitudes (19.5). Table 6 of Reid (1984) gives four model predictions of the relative numbers of disc, halo, intermediate (thick disc) and white dwarf populations which would be discovered by a polar proper-motion survey. The models are based on different combinations of the disc and halo luminosity functions and the kinematics of the halo. Our result gives a value which falls between the predictions of models A and D and excludes models B amd C. Model A is based largely on the results of Wielen (1974), whilst model D uses the Luyten (1968) disc luminosity function, a ‘mean globular’ halo luminosity function and the halo kinematics of Oort (1965). This analysis is described in more detail in Pokorny, Jones & Hambly, 2002 (in preparation).
Acknowledgments
The authors would like to thank all of the staff of the SuperCOSMOS project at the ROE and Mike Read for producing Fig. 1. RSP would like to thank J. M. Porter, P. A. James and A. M. Newsam for helpful discussions and suggestions. RSP acknowledeges support of an LJM University fellowship.
References
- (1) Dawson P.C., 1986, ApJ, 311, 984.
- (2) Evans D.W., 1992, MNRAS, 255, 521.
- (3) Flynn C., Sommer-Larsen J., Fuchs B., Graff D.S., & Salim S., 2001, MNRAS, 322, 553.
- (4) Hambly N. C., Miller L., MacGillivray H. T., Herd J. T., & Cormack, W. A., 1998, MNRAS, 298, 897.
- (5) Hambly N.C., MacGillivray H.T., Read M.A., et al., 2001a, MNRAS, 326, 1279.
- (6) Hambly, N.C., Irwin, M.J., & MacGillivray, H.T., 2001b, MNRAS, 326, 1295.
- (7) Hambly, N.C., Davenhall, A.C., Irwin, M.J., & MacGillivray, H.T., 2001c, MNRAS, 326, 1315.
- (8) Henry T.J., Ianna P.A., Kirkpatrick J.D., & Jahreiss H., 1997, AJ, 114, 388.
- (9) Lee S-G., 1993, JKAS, 26, 141.
- (10) Luyten W.J., 1968, MNRAS, 139, 221.
- (11) Luyten W.J., 1979, LHS catalogue, University of Minnesota.
- (12) Luyten W.J., 1979, NLTT catalogue, University of Minnesota.
- (13) Monet D.G., Fisher M.D., Liebert J., et al., 2000, AJ, 120, 1541.
- (14) Morgan D.H., Tritton S.B., Savage A., Hartley M., &Cannon R.D., 1992, in: Digitised Optical Sky Surveys, eds. H.T. McGillivray & E.B. Thomson (Kluwer: Dordrecht), 11.
- (15) Oort, J.H., 1965, Galactic Structure, ch. 15, University of Chicago Press.
- (16) Reid, I.N., 1984, MNRAS, 206, 1.
- (17) Ruiz M.T., Leggett S.K., & Allard F., 1997, ApJ, 491, 107.
- (18) Ruiz M.T., Wischnjewsky, M., Rojo P.M., & Gonzalez L.E., 2001, ApJS, 133, 119.
- (19) Schmidt M., 1968, ApJ, 151, 393.
- (20) Schmidt M., 1975, ApJ, 202, 22.
- (21) Scholz R.-D., Irwin W., Ibata R., Jahreiss H., & Malkov O.Yu., 2000, A&A, 353, 958.
- (22) Wielen R., 1974, Highlights of Astronomy, 3, 395.
- (23) Williams D. B., 2000, JAAVSO, 28, 12.