The Nuclear Regions of the Seyfert Galaxy NGC 4151 Parsec-scale \HI Absorption and a Remarkable Radio Jet
Abstract
Sensitive high angular and linear resolution radio images of the 240-pc radio jet in NGC 4151, imaged at linear resolutions of 0.3 to 2.6 pc using the VLBA and phased VLA at 21 cm, are presented and reveal for the first time a faint, highly collimated jet (diameter 1.4 pc) underlying discrete components, seen in lower resolution MERLIN and VLA images, that appear to be shock-like features associated with changes in direction as the jet interacts with small gas clouds within the central 100 pc of the galaxy. In addition, 21-cm spectral line imaging of the neutral hydrogen in the nuclear region reveals the spatial location, distribution and kinematics of the neutral gas detected previously in a lower resolution MERLIN study. Neutral hydrogen absorption is detected against component C4W (E+F) as predicted by Mundell et al, but the absorption, extending over 3 pc, is spatially and kinematically complex on sub-parsec scales, suggesting the presence of small, dense gas clouds with a wide range of velocities and column densities. The main absorption component matches that detected in the MERLIN study, close to the systemic velocity (998 km s-1) of the galaxy, and is consistent with absorption through a clumpy neutral gas layer in the putative obscuring torus, with higher velocity blue- and red-shifted systems with narrow linewidths also detected across E+F. In this region, average column densities are high, lying in the range 2.7 1019 1.7 1020 cm-2 K-1 ( is the spin temperature), with average radial velocities in the range 920 Vr 1050 km s-1. The spatial location and distribution of the absorbing gas across component E+F rules out component E as the location of the AGN (as suggested by Ulvestad et al.) and, in combination with the well-collimated continuum structures seen in component D, suggests that component D (possibly subcomponent D3) is the most likely location for the AGN. We suggest that components C and E are shocks produced in the jet as the plasma encounters, and is deviated by, dense clouds with diameters smaller than 1.4 pc.
Comparison of the radio jet structure and the distribution and kinematics of ionized gas in the narrow line region (NLR) suggests that shock-excitation by passage of the radio jet is not the dominant excitation mechanism for the NLR. We therefore favour nuclear photoionization to explain the structure of the NLR, although it is interesting to note that a small number of clouds with low velocity and high velocity dispersion are seen to bound the jet, particularly at positions of jet direction changes, suggesting that some NLR clouds are responsible for bending the jet. Alternatively, compression by a cocoon around the radio jet due to pressure stratification in the jet bow shock could explain the bright, compressed optical line-emitting clouds surrounding the cloud-free channel of the radio jet, as modelled by Steffen et al.
1 Introduction
Nuclear activity in galaxies is present over a wide range of luminosities, from the most distant and powerful quasars, to the weaker Active Galactic Nuclei (AGN) seen in nearby galaxies such as Seyferts, LINERs and even the Milky Way (e.g., Huchra & Burg 1992; Ho Filippenko & Sargent 1997). The standard model of nuclear activity involves the release of gravitational potential energy from galactic material accreted by a supermassive black hole at the galaxy center and, although radiation from the central engine is detected across the electromagnetic spectrum, it was the radio emission that first led to the discovery of powerful AGN (e.g., Baum & Minkowski 1960; Hazard, Mackey & Shimmins 1963; Bridle & Perley 1984). Indeed, the presence of powerful, highly-collimated relativistic radio jets in radio-loud quasars and radio galaxies, extending well beyond their host galaxy (e.g., Fanaroff & Riley 1974; Bridle & Perley 1984), provided key evidence for the exhaust material from a black-hole driven central engine (Scheuer 1974, Blandford and Rees 1974; Bridle et al. 1994; Urry & Padovani 1995).
In contrast, radio-quiet quasars and Seyfert galaxies are ten times more common but 100 to 1000 times weaker at radio wavelengths than their radio-loud cousins (e.g., Goldschmidt et al. 1999); consequently nuclear starbursts have been advocated as the primary power source instead of black-hole accretion (e.g., Fernandes & Terlevich 1995). However, instrumental improvements and high resolution radio imaging with the VLA, MERLIN and the VLBA over the last twenty years have shown increasing evidence for collimated radio emission in the form of small-scale radio jets that are weak analogues to jets in radio-loud AGN (e.g. Ulvestad & Wilson 1989; Wilson 1991; Nagar et al. 1999; Kukula et al. 1999) and indicate the presence of a central black hole and accretion disk, at least in some Seyferts. Similarly, measurements of high brightness temperatures in milliarcsecond resolution images of Seyfert nuclei with flat radio spectra have also suggested support for accretion-powered central engines (Mundell et al. 2000).
Radio jets, although interesting in their own right, also provide a valuable probe of the interstellar medium close to the central engine, in particular the putative obscuring torus, which is thought to surround the central engine, providing fuel for the AGN and determining the observed optical spectral differences between type 1 (unobscured, viewed pole-on down the torus axis ) and obscured type 2 (viewed edge-on in the torus equatorial plane) (e.g., Antonucci & Miller 1985). Some of the molecular gas in the torus is expected to be dissociated and ionized by the central UV/X-ray continuum source resulting in detectable quantities of neutral and ionized gas (e.g., Krolik & Lepp 1989; Pier & Voit 1995). Absorption of the radio jet continuum emission by intervening torus gas can be measured to determine ionized gas densities via free-free absorption (e.g., Ulvestad, Wrobel & Carilli 1999; Ulvestad et al. 1999), neutral gas columns via 21-cm neutral hydrogen (H i) absorption (e.g., Mundell et al. 1995; Gallimore et al. 1999; Peck & Taylor 2002) and molecular gas content via OH absorption (e.g., Hagiwara et al. 2000). Due to the small size scales of the radio jet and the obscuring torus, high angular resolution imaging using the VLBA is required to spatially resolve gas in the absorbing region.
In this context, NGC 4151, with its large quantities of neutral gas and elongated radio continuum structure, is an ideal candidate for such a study (see Ulrich 2000 for a comprehensive review of the properties of the galaxy and its AGN). NGC 4151 is a Seyfert type 1.5 (e.g., Osterbrock & Koski 1976) in an almost face-on (=21∘), grand-design, weakly-barred spiral host galaxy, Hubble type (R’)SAB(rs)ab (de Vaucouleurs et al. 1991), that contains significant amounts of H i throughout its two optically-faint spiral arms, fat weak bar and nuclear region (Davies 1973; Bosma, Ekers & Lequeux 1977; Pedlar et al. 1992; Mundell et al. 1995; Mundell & Shone 1999; Mundell et al. 1999).
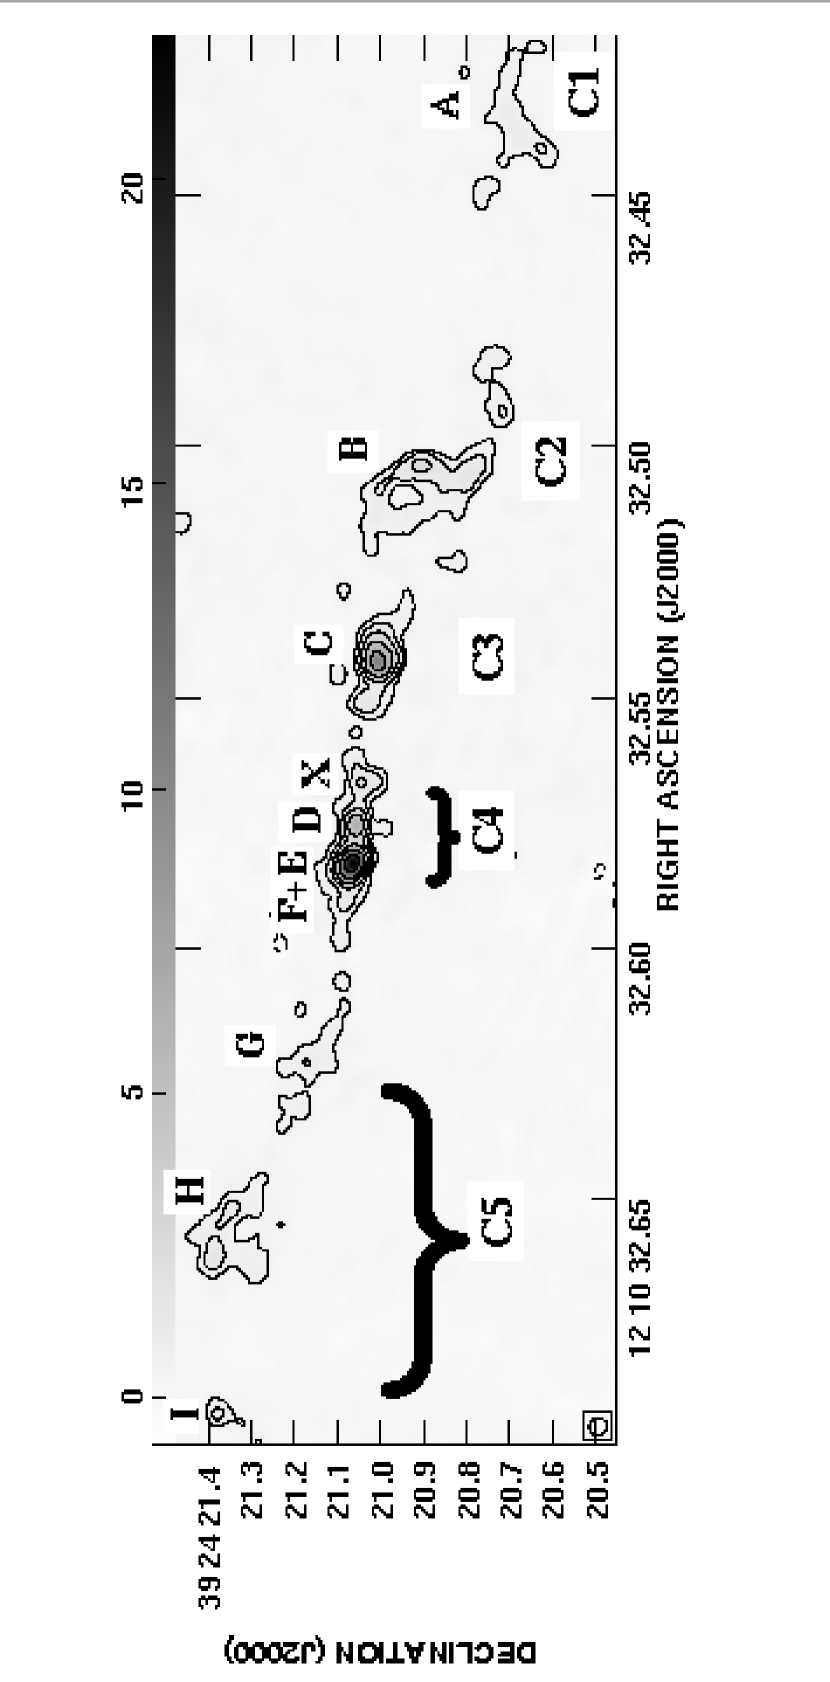
Radio continuum observations of the strong radio continuum nucleus show a linear radio structure in the form of a string of knots, elongated over 35 (230 pc) in average position angle (P.A.) 77∘ (Wilson & Ulvestad 1982; Johnston et al. 1982; Carral, Turner & Ho 1990; Pedlar et al. 1993; Mundell et al. 1995), which is embedded in diffuse emission extending over 105 (680 pc) (Johnston et al. 1982; Pedlar et al. 1993). Carral et al. (1990) identified five main knots in the 3.5-arcsec jet at 15 GHz, annotating them C1 to C5. 21-cm MERLIN observations of this central 4″ region (Mundell et al. 1995) revealed localized and marginally-resolved H i absorption, with a peak column density of 61019 cm-2, against the component (C4) in the radio jet which is thought to contain the AGN; no absorption was detected against the other jet components to a limiting column density of 21019 cm-2. An east-west column density gradient was observed and, in combination with UV column densities and early VLBI images, which showed C4 to consist of two components (C4E and C4W) separated by 7 pc, led Mundell et al. (1995) to suggest that the weaker, western component, C4W, contains the optical/UV nucleus and thus the H i absorption is taking place against the first component of the counterjet (C4E), due to gas in the obscuring torus. Structural and spectral index information obtained from subsequent radio continuum VLBA observations of the jet at 1.6 and 5 GHz led Ulvestad et al. (1998) to suggest a similar model but with the AGN located instead at the emission peak of C4E (component E after Ulvestad et al. 1998); requiring an absence of H i absorption against the AGN, this model predicted H i absorption only against the start of the counterjet, i.e. the tail of emission extending eastwards of the peak in C4E (component F after Ulvestad et al. 1998).
In this paper we re-open the discussion on the possible location of the AGN based on new spectral line observations, but whatever the precise location of AGN, NGC 4151 appears to be unusual in having neutral gas located close to the nucleus, unlike other Seyferts that show H i absorption associated with gas located in dust disks on scales of 100200 pc aligned with the host galaxy disk (e.g., Cole et al. 1998; Gallimore et al. 1999); in this respect NGC 4151 seems more similar to Compact Symmetric Objects (CSO) and Steep Spectrum Core (SSC) objects (e.g., Conway 1996; Peck 1999; Peck & Taylor 2001).
We present sensitive new, high resolution 21-cm continuum imaging, using the VLBA and phased VLA, of the entire 35 radio jet in NGC 4151 at an angular resolution of 40 mas (2.6 pc), along with higher resolution images of individual components with angular resolutions down to 5 mas (0.3 pc). In addition we present analysis of the first spatially-resolved images of the associated H i absorbing gas with an angular resolution of 10.5 mas (0.7 pc) and confirm that the neutral gas, although clumpy, is located across the whole of component C4W (E+F after Ulvestad et al. 1998). Section 2 details the observational parameters and data reduction performed; in Section 3 we present the results of both the sensitive, high resolution continuum imaging of the jet and the H i distribution and kinematics. In Section 4 we present the arguments for the location of the AGN being associated with component D and discuss the relationship between the radio jet and the narrow line region. We discuss the H i absorption in comparison with Ly absorption measurements and present our conclusions in Section 5.
As discussed in Mundell et al. (1999) the heliocentric radial velocity of NGC 4151 is 1000 km s-1, but distance estimates vary depending on the assumed value of H0 and whether the Virgocentric correction and the relative velocity of the Local Group with respect to the Virgo cluster are taken into account. Distance estimates lie in the range 10D30.5 Mpc for 50H0100 km s-1 kpc-1 and 1000V1523 km s-1, but since the uncertainty in the value of H0 is as large as the Virgocentric correction, for the purposes of this paper we assume a distance to NGC 4151 of 13.3 Mpc, using H0=75 km s-1 kpc-1 and the heliocentric velocity of 998km s-1, giving a linear scale of 0.065 pc mas-1 in the galaxy.
2 Observations and Data Reduction
The observations were obtained with the 10 element Very Long Baseline Array (VLBA - Napier et al., 1994) plus the 27 antennas of the Very Large Array (VLA - Thompson et al. 1980) used in phased-array mode at 1.4 GHz, during a 14-hour observing run on 19 March 1996. Phased-array mode involves the analog sums of the sampled and delayed intermediate frequency (IF) signals from the VLA antennas along each arm; the combination of the amplified and filtered signals from the three VLA arms is then recorded by the VLBI data acqusition system in VLBA format. When used in phased-array mode to augment the VLBA, the VLA offers the equivalent sensitivity of a single 115-m antenna and an improvement in image sensitivity by a factor of 2.4 compared with the VLBA alone. Although dual circular polarizations (right and left) were recorded, only the parallel hands (RR and LL) were correlated. The correlated data, using two bit sampling, consisted of two intermediate frequencies (IF) each with an 8 MHz bandwidth, 2 polarizations and 512 channels, resulting in a maximum spectral resolution of 15.6 kHz (3.3 km s-1) per channel. The first IF was centered near the redshifted H i line of NGC 4151 at 1415.19 MHz corresponding to the recession velocity 1100 km s-1 (radio convention with respect to the Local Standard of Rest) while the second IF was shifted by 8 MHz relative to the center of IF1 (center at 1423.19 MHz) to provide a sensitive measure of continuum emission. The simultaneous VLA data, obtained with the array in C-configuration, were observed with a 25 MHz bandwidth centered at 1419.19 MHz encompassing the total 16-MHz VLBA bandwidth.
Data editing and calibration followed standard methods111See E. W. Greisen & P. P. Murphy 1998, The AIPS Cookbook, on-line at http://www.cv.nrao.edu/aips/cook.html. and used the NRAO222The National Radio Astronomy Observatory is a facility of the National Science Foundation operated under cooperative agreement by Associated Universities, Inc. Astronomical Image Processing Software (van Moorsel, Kemball & Greisen 1996). VLBA amplitude scales were determined from standard VLBA antenna gain tables, maintained by NRAO staff, and measurements of made throughout the run; the integrated total flux density of NGC 4151, as measured by the VLA, was determined in the standard way from observations of 3C286. Observations of J1310+32 (VLBA antennas) were used to provide a check for relative amplitude differences between antennas and IFs, while J1642+39 provided manual pulse and bandpass calibrations. Full phase referencing was not performed thus allowing the maximum possible observing time to be spent on NGC 4151, which is bright enough for self-calibration. However short, regular observations of J1209+41 were interleaved through NGC 4151 scans with a cycle time of (11+2) minutes to provide a check on the delay-rate corrections; after imaging and phase/amplitude self-calibration, the amplitude-only corrections from J1209+41 were applied to NGC 4151. A single-channel pseudo-continuum dataset for NGC 4151, which was produced by averaging together the central 75% of both IFs, was then imaged and used as the input starting model for subsequent cycles of self-calibration and data editing (e.g. Walker 1995). The range covered by the data is large, 70 k 40.8 M at 21 cm, so the data are sensitive to a wide range of spatial frequencies. Using a combination of different data weightings and tapers, it is therefore possible to produce a variety of images at different angular resolutions in order to show fully the complex structures present in the jet (Figures 1, 2, 3). Continuum images were formed with angular resolutions from 40 mas (2.6 pc) to 5 mas (0.33 pc) and are discussed more fully in Section 3. Due to the lack of full phase referencing, absolute positions from J1209+41 were not transferred to NGC 4151 and the R.A. and Dec axes are therefore provided by the pointing centre assumed correlation position, derived from earlier MERLIN observations; however, measured positions for E and D that are very close to those derived from the fully phase-referenced continuum images of Ulvestad et al. (1998), with the position of the peak flux density in component E measured, from our 5-mas uniformly weighted continuum image (Figure 3), to be .5821, compared with .5822, from Ulvestad et al. (1998).
The additional data editing and corrections derived from the self-calibration of the continuum emission of NGC 4151 were finally applied to the NGC 4151 spectral line data and all subsequent processing concentrated on IF1. The continuum contribution in IF1 (formed from the line-free channels 32-182 and 350-450) was subtracted in the plane using aips task uvlin and the corresponding ‘pure continuum’ dataset was formed from the same line-free channels in the plane using avspc. Concentrating on the region of the source where absorption is expected (i.e., components D, E, F), the pure continuum and line datasets extracted from IF 1 were then Fourier transformed with uniform and natural weighting (with 1-mas pixels), deconvolved and added together to form the corresponding absorption cube (256 256 512) with the correct continuum level adjacent to the line. It should be noted that although a combination of data from IF1 and IF2 were used to produce maximum-sensitivity continuum images of the whole jet, this continuum image is not suitable for addition to the spectral line dataset (from IF1) to form optical depth maps because small errors in the bandpass calibration (5%) between the two IFs produce significant errors in optical depth spectra (Faison et al. 1998); therefore only continuum emission from line-free channels in IF1 were used to produce the optical depth maps. A full spectral-resolution cube (spectral resolution 3.3 km s-1) with 512 channels was produced, whilst spectral averaging was used to increase the channel sensitivity in spectral line cubes imaged with 128 and 256 channels. The intermediate spectral-resolution natural cube with 256 channels (6.6 km s-1 per channel) was used as a consistency check to confirm the presence of multiple narrow components detected in the 128- and 512-channel cubes (Figure 4). The more sensitive 128-channel cube (spectral resolution 13.2 km s-1) was imaged and used to construct optical depth maps (see Figure 5), which were created using only absorption stronger that 1.5 mJy beam-1 (3). In Figure 5, structures much smaller than the beam are an artefact of the data processing and are compatible with the signal-to-noise of the spectra; trends on scales larger than or comparable to the beamsize are real. Spectra extracted from a higher angular resolution, uniformly-weighted cube indicates clumping of the gas on scales 6 mas, but the signal-to-noise of the spectral was insufficient for reliable moment analysis.
3 Results
3.1 21-cm Radio Continuum Emission
As discussed in Section 2, the 21-cm (1.4-GHz) VLBA+VLA data are sensitive to a wide range of spatial scales, allowing a variety of images at different angular resolutions to be produced, fully probing the structures in the jet. Figure 1 shows continuum emission from the entire 32-long jet (210 pc) imaged at 40 mas (2.6 pc) resolution. For the first time, weak emission from a highly-collimated radio jet is seen underlying the five discrete components, or knots (C1C5), seen in previous lower resolution MERLIN and VLA images (e.g., Carral et al. 1990; Pedlar et al. 1993). These five knots are now spatially resolved and can be clearly seen, in the the 25-mas resolution image (Figure 3 - upper panel), to coincide with changes in direction of the jet.
Due to the large number of features visible along the jet in the VLBI images, the “C1C5” labeling scheme used for MERLIN and VLA images, as noted by Ulvestad et al. (1998), is no longer adequate; we therefore adopt the nomenclature introduced by Ulvestad et al. (1998) in which the components are labeled from west to east with letters from A to H. We identify two new additional components, I (east of H) and X (between C and D). Table 1 lists the correspondence between the component designations used in Mundell et al. (1995) and Ulvestad et al. (1998).
Connecting components I and A with a single straight line gives an average jet P.A. of 77∘, as found in lower resolution studies (e.g. Pedlar et al. 1993). However, the jet structure is more complex than suggested by a single P.A and, as can be seen in Figures 1 and 3(a), several sections of the jet point in a predominantly east-west direction, along P.A. 89∘, i.e. sections connecting components A to the lower tip of B, F to the lower tip of G and the eastern end of H to I; finally and most obviously, the peaks of the three subcomponents in D (Figures 2, 3(b)) lie along a line in P.A. 84∘ and connect with X. However, these almost horizontal sections are not colinear, as the jet exhibits abrupt and almost step-like, direction changes. These changes are most obvious in Figure 1 at components B, G and H, and in Figures 2 and 3(b) at component E. The subarcsecond-scale jet structures therefore do not align with the average P.A. 77∘ and it is clear from Figure 1 that the final, ‘emergent’ P.A. for both eastern and western ends of the jet after it has finished its various deviations is indeed in P.A. 90∘.
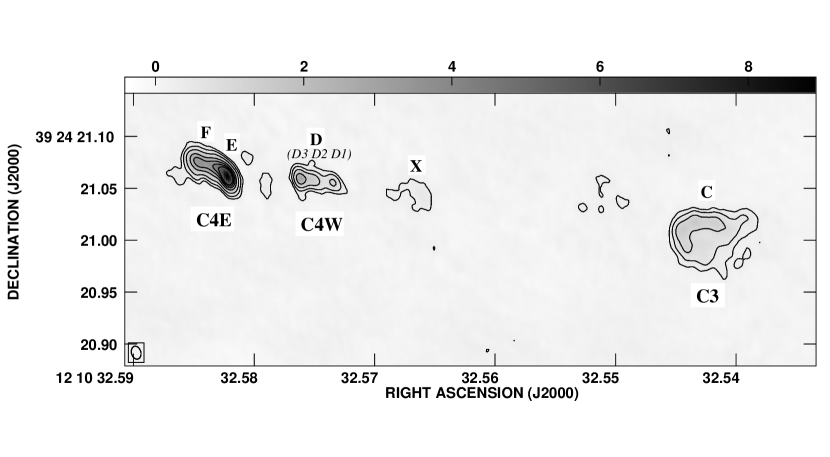
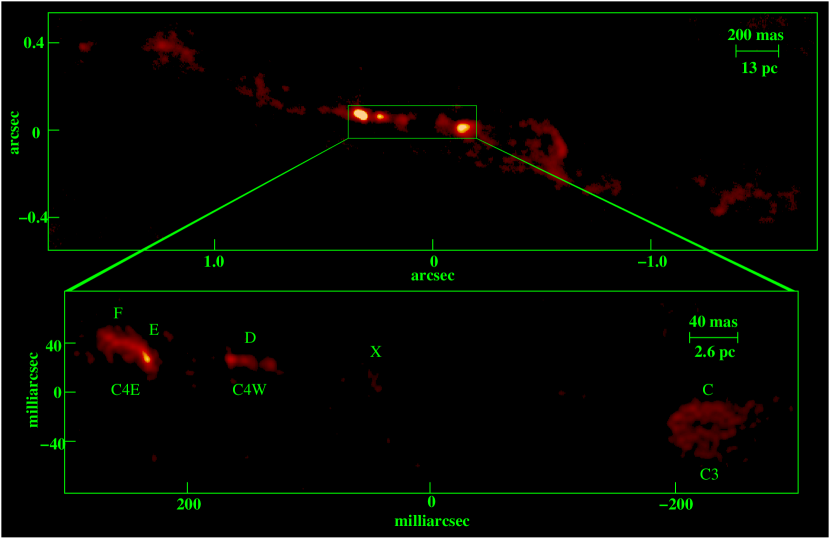
Although the exact location of the AGN between F and C is not known (see Section 4 for discussion), the jet appears initially very well-collimated in the vicinity of the components associated with D (Figure 2). Despite deviating quite abruptly at E, the eastern jet (through components F, G, H, I) remains more highly collimated along its length than the western jet (through components C, B, A), which contains more diffuse and extended components. No emission is detected in the region between component X and the eastern tail of C; to a 3- detection threshold of 0.15 mJy beam-1, which corresponds to brightness temperature upper limit of TB 2.8105 K at 21 cm in the 40-mas resolution image.
3.2 Parsec-Scale Neutral Hydrogen Absorption
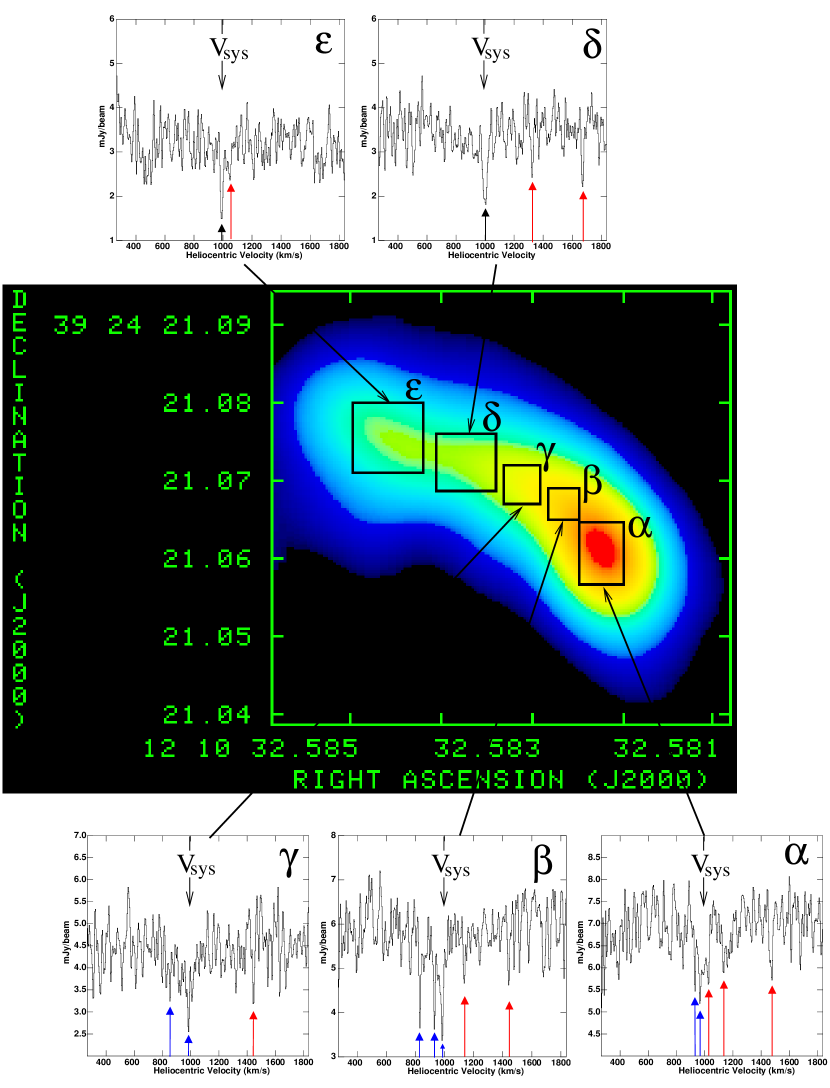
Neutral hydrogen absorption is only detected against continuum components E+F; no H i absorption is detected against component D to a limiting 3- absorption depth of 1.5 mJy beam-1, i.e. a maximum column density 1.11019 cm-2 (per 13.2 km s-1 channel), assuming a constant column density across D (see Section 4 for discussion). Figure 4 shows some representative absorption spectra taken at five locations (labelled to ) across the 3-pc-long continuum structure of the ‘banana-shaped’ component, E+F; the spectra were extracted from the 512-channel naturally-weighted cube with angular resolution 10.5 mas (0.7 pc) and spectral resolution 3.3 km s-1. For the purposes of moment analysis, we derived the distribution of column density and corresponding gas kinematics from a spectrally-averaged, 128-channel (spectral resolution 13.2 km s-1), naturally-weighted cube with a restoring beamsize 11.59.0 mas (0.750.59 pc) in P.A. 0∘. Only absorption stronger than the 3- absorption depth of 1.5 mJy beam-1 per channel was included in the moment analysis.
3.2.1 Column Densities, Gas Distribution and Kinematics
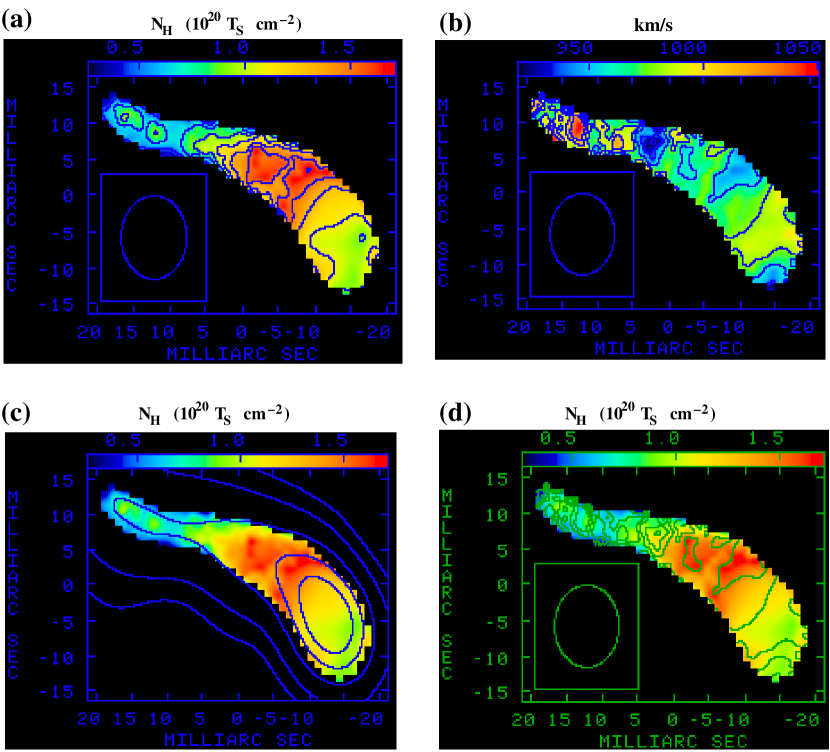
The distribution of H i column density () per unit spin temperature across components E+F is shown in Figure 5(a). As can be seen in Figures 4 and 5, H i absorption is detected against the whole extent of E+F (C4W) and is spatially and kinematically complex; across E+F, average column densities lie in the range 2.7 1019 1.7 1020 cm-2 K-1, where is the spin temperature for which the value is unknown but is typically 102104 K in the Galaxy (Heiles & Kulkarni, 1988) and average radial velocities lie in the range 920 Vr 1050 km s-1. These values are consistent with the lower resolution (01601526.3 km s-1) MERLIN absorption study in which Mundell et al. (1995) reported an E-W column density gradient, across the marginally resolved component C4, 3 1019 6 1019 cm-2 K-1 and an absorption line with Full Width at Half Maximum (FWHM) 91 km s-1 centered at 998 km s-1. The higher column density values measured in the VLBA datacube confirms that the absorption is spatially resolved and occurs on scales significantly smaller than the MERLIN beam.
The mean column density gradient decreases towards the NE, along the tail of F, but higher column-density clumps are present throughout this region, as measured from a higher resolution uniformly-weighted cube (not shown); in particular, the peak column density 1.7 1020 cm-2 does not occur at the location of the continuum emission peak (E) but instead occurs 15 mas (1 pc) NE of the southern tip of the ‘banana’ (or 0.5 pc from the continuum emission peak). Column densities in the region of the continuum peak are still significant, but lower at 9 1019 1.2 1020 cm-2 (Figure 5(c)).
Figure 5(b) shows the mean velocity field derived from single Gaussian moment analysis. Although useful to show the general trend in velocity across the ‘banana’, this velocity field represents only the main velocity component close to the galaxy systemic value. As can be seen in Figure 4, multiple, narrow velocity components are present at different positions across the continuum structure. At this high spectral and spatial resolution one can see a family of complex absorption lines (e.g. location ), multiple velocity components (e.g. location ) and narrow single lines (e.g. locations , ) at different locations across the continuum structure. The velocity components are indicated in Figure 4 and their properties are listed in Table 2.
4 Discussion
4.1 The Location of the AGN
The location of the AGN in NGC 4151 is broadly accepted to be in component C4 (e.g. Pedlar et al. 1993; Mundell et al. 1995). However, as discussed previously, it is now known that C4 consists of a number of subcomponents and the precise association of the AGN with one of these subcomponents is still a matter of debate. In this study, we use the characteristics of the radio continuum structure and the H i absorption to argue for the AGN located in component D.
4.1.1 Radio Continuum Structures
Components C and (E+F) share some structural similarities having a ‘banana’-like ridge on their northern half, but with the tail of (E+F) pointing eastwards (i.e. counterjet) and that of C pointing westwards (forward jet); if these opposed arc-like structures are due to interactions of the radio jet with dense clouds in the circumnuclear environment, making each component an impact site, their similar shapes and opposing directions suggest that the AGN lies somewhere between the two. The greater flux density of E+F suggests that the AGN is located closer E+F than to C, or that C is an older component. In addition, as described in Section 3, the continuum structure of component D shows a high degree of collimation; indeed the structure resembles radio core-jet structures seen in higher power AGN such as radio loud quasars. If the AGN corresponds to one of the components in D (possibly D3), as originally suggested by Mundell et al. (1995), this would explain the very linear, core-jet-like, structure of D and the greater brightness of E+F relative to C.
Assuming that D delineates the well-collimated jet before it has suffered any interference, a jet diameter of approximately 1.4 pc is inferred. A small dense gas cloud that wanders into the path of the radio plasma flow would disrupt or deviate the jet flow. The amount of disruption depends on the impact parameter of the jet with the cloud, assuming the cloud diameter is less than that of the jet (1.4 pc). Component E+F can then be understood as a grazing encounter with a small dense cloud, so the (counter-)jet is deflected at E but continues to flow over the cloud to F and outwards through G, and retaining some degree of collimation through to I.
To the west of D, the similar but more diffuse, but clearly shell-like structure of component C (Figure 2) can be explained by the jet flow to the south-west of the AGN impacting a cloud more directly and so being more disrupted. With a cloud diameter smaller than the jet diameter, the jet flow is not terminated at C but continues to flow around the cloud and onwards to components B and A, but with significantly more disruption and poorer collimation than its counterpart to the north-east. Indeed, the flattening of the northern half of the shell structure of C might be explained by the containment effect of a dense bounding cloud to the north of C. As shown by HST studies of ionized gas clouds in the NLR of NGC 4151 (e.g., Wingé et al. 1997; Hutchings et al. 1998; Kaiser et al. 2000), a large number of gas clouds exist in the inner regions of the galaxy, so the chance of the radio jet intercepting and being affected by gas clouds is high. In addition, the relatively flat radio spectrum of component E might be explained by re-acceleration of synchrotron-emitting electrons in the shock produced by the interaction with the cloud, rather than the AGN-interpretation suggested by Ulvestad et al. (1998).
4.1.2 Distribution of H i Absorption
Mundell et al. (1995) originally suggested that the discrepancy between the high column densities and systemic gas velocity inferred from MERLIN radio H i absorption measurements (peak 6.0 1021 cm-2 at 998 km s-1 for =100 K ) and much lower columns inferred from UV observations of Ly absorption (Kriss et al. 1992) with significant blueshifts (6 1017 6 1020 cm-2) could be interpreted as support for the presence of the putative obscuring torus invoked in Unification Schemes (e.g. Antonucci & Miller 1985). In this interpretation, the lower column densities of blueshifted gas seen in the UV are interpreted as outflowing ionised gas seen along the line of sight to the AGN; the higher column densities and lower gas velocity seen in the radio are interpreted as absorption through gas in the obscuring torus along the line of sight towards the first component of the counterjet. Component C4W (or D) was then assigned as the true optical/UV nucleus with C4E (E+F) representing the first radio component in the counterjet against which the H i absorption was occurring (Mundell et al. 1995).
Ulvestad et al. (1998) used the VLBA to image, at high angular resolution, the bright components (C, D, E, F) at 18 cm and 6 cm and set upper limits for the emission at 2 cm. They revised the model of Mundell et al. by suggesting an alternative location for the AGN in E (as discussed above) and predicted that H i absorption would only be detected against subcomponents of F (F3F5 in Ulvestad et al. 1998), with subcomponents EF2 lying behind fully ionized gas and therefore resulting in no H i absorption against these components. This prediction is easily testable with the present data and found to be inconstent; H i absorption is detected across the whole extent of E+F (see Section 3 and Figures 3, 4), ruling E out as the location for the AGN.
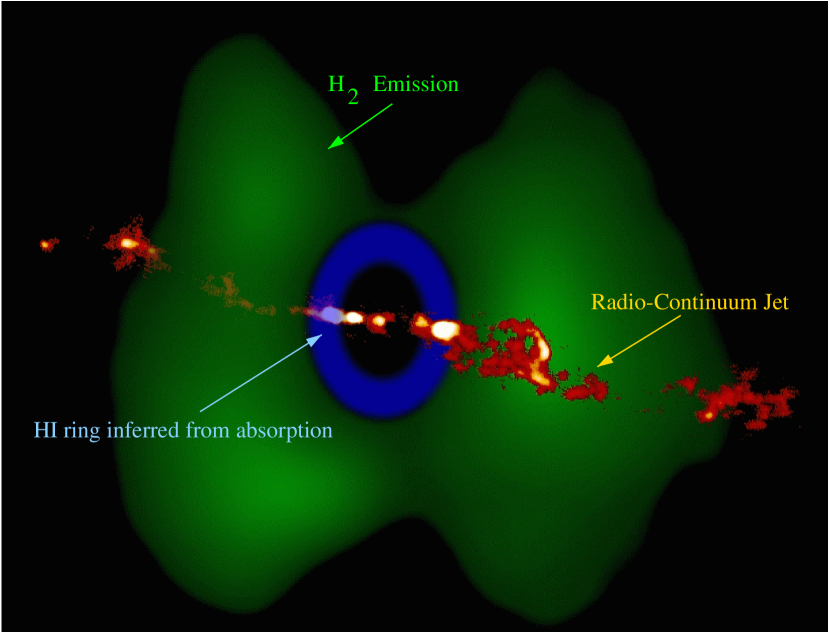
Considering both the H i absorption results and the radio continuum structures (as discussed above), component D remains the most likely location for the AGN. Assuming an ionized/neutral/molecular ‘onion-skin’ model for the torus, component D would then lie behind the ionized inner skin of the torus with E+F lying behind the neutral (dissociated) gas layer and molecular gas would be further out. The geometry of such a model is illustrated in Figure 6. In this model, the weak diffuse component X, which is resolved out at higher resolutions and radio frequencies, has been placed at the centre of the torus since it also lies along the collimation axis defined by D and so could be an alternative location for the AGN; the jet can be shifted relative to the H2 image (relative astronometry is poor) to place whichever radio component contains the AGN at the torus centre, with the condition that component E+F must lie behind the neutral gas layer. If subcomponent D3 contains the AGN and ionized gas fills the inner region of the torus between D3 and the neutral gas layer starting at E, the radius (RI) of the ionized gas sphere interior to the neutral layer would be approximately RI 3.3(sin-1) pc (where is the angle between the jet axis and the line of sight). For an ionizing flux of 1.51054 photons per second (Kriss et al. 1995; Ulvestad et al. 1998), the electron density in Strömgren radius RI 3.3(sin-1) pc is ne3.8104 (sin3/2) cm-3 (where is the filling factor); this electron density is intermediate between the densities expected for Seyfert narrow-line regions (103 cm-3) and broad-line regions (109 cm-3) and similar to values inferred from free-free absorption in Mrk 231 and Mrk 348 (Ulvestad et al. 1999) and thermal bremsstrahlung emission upper limits in NGC 4388 (Mundell et al. 2000).
Sensitive radio imaging over a range of wavelengths to derive radio spectra of the subcomponents in D would help to identify a flat-spectrum, high brightness temperature component indicative of an AGN and characterise the quantity of ionized, free-free absorbing foreground gas. Alternatively, the nucleus itself may not be visible at centimetric radio wavelengths if significant quantities of ionized gas lie along our line of sight and free-free absorb radio photons (e.g. the absence of 21-cm continuum emission between components X and C can be seen in Figure 1 and is described in Section 3); sensitive, high frequency radio observations, radio proper motion studies and improved HST and VLBA relative astrometry will be important in determining the true location of the AGN.
4.2 The Relationship between the Narrow Line Region and the Radio Jet
Ionized gas in the narrow line region of NGC 4151 is distributed in a clumpy, biconical structure, extending over 2″ north-east and south-west of the bright nucleus, and has been modelled as gas outflowing at a constant velocity of 350 km s-1 along the surface of a bicone with total opening angle of 80∘, viewed at 10∘ outside the cones (Hutchings et al. 1998). The blueshifted gas southwest of the nucleus is approaching (see also Schultz 1990; Evans et al. 1993; Robinson et al. 1994; Boksenberg et al. 1995).
A key question in the study of the energetics and kinematics of gas in NLR regions of Seyferts is the importance of the radio jet. Competing models to explain optical line emission from the NLR advocate two main excitation mechanisms; direct photoionisation by the central continuum source (e.g., Binette et al., 1996) or shock ionisation caused by the passage of the radio jet through the ISM (e.g., Dopita & Sutherland, 1995, 1996; Bicknell et al., 1998). Wedge-shaped morphologies observed in some NLR’s (e.g., Evans et al., 1991; Wilson et al., 1993; Wilson & Tsvetanov, 1994; Simpson et al., 1997) are consistent with photoionisation by a cone of UV radiation from the central engine. Alternatively, the correlation between radio power and [Oiii] luminosity and line-width (de Bruyn & Wilson 1978; Wilson & Willis 1980; Whittle, 1985, 1992), and the approximate spatial coincidence between radio and optical structures in other NLRs suggest that the radio jets may be responsible for some of the optical line emission.
Radio observations of powerful quasars and radio galaxies have shown evidence for bulk relativistic (non-thermal) flows in the radio jets (e.g. Pohl et al. 1995; Hough, Zensus & Porcas 1996 ), but it remains controversial whether ejected radio plasma in Seyfert galaxies has bulk relativistic motion (e.g. Ulvestad et al. 1999; Brunthaler et al. 2000). Bicknell et al. (1997) suggest that Seyfert jets may be mildly relativistic close to the black hole and become increasingly dominated by thermal plasma on larger scales, as they entrain material from the ISM. They argue that the energetic importance of Seyfert radio jets has been underestimated and that jets may provide the energy input to drive the optical emission in the NLR, with jet energy fluxes (based on a study of NGC 1068) being greater than previously supposed. Nevertheless, a direct causal relationship between the radio jet and NLR emission has not yet been established and the relative contributions of direct photoionisation of emission line regions by the central continuum source, and strong interaction of the emission-line gas with radio plasma remains controversial.
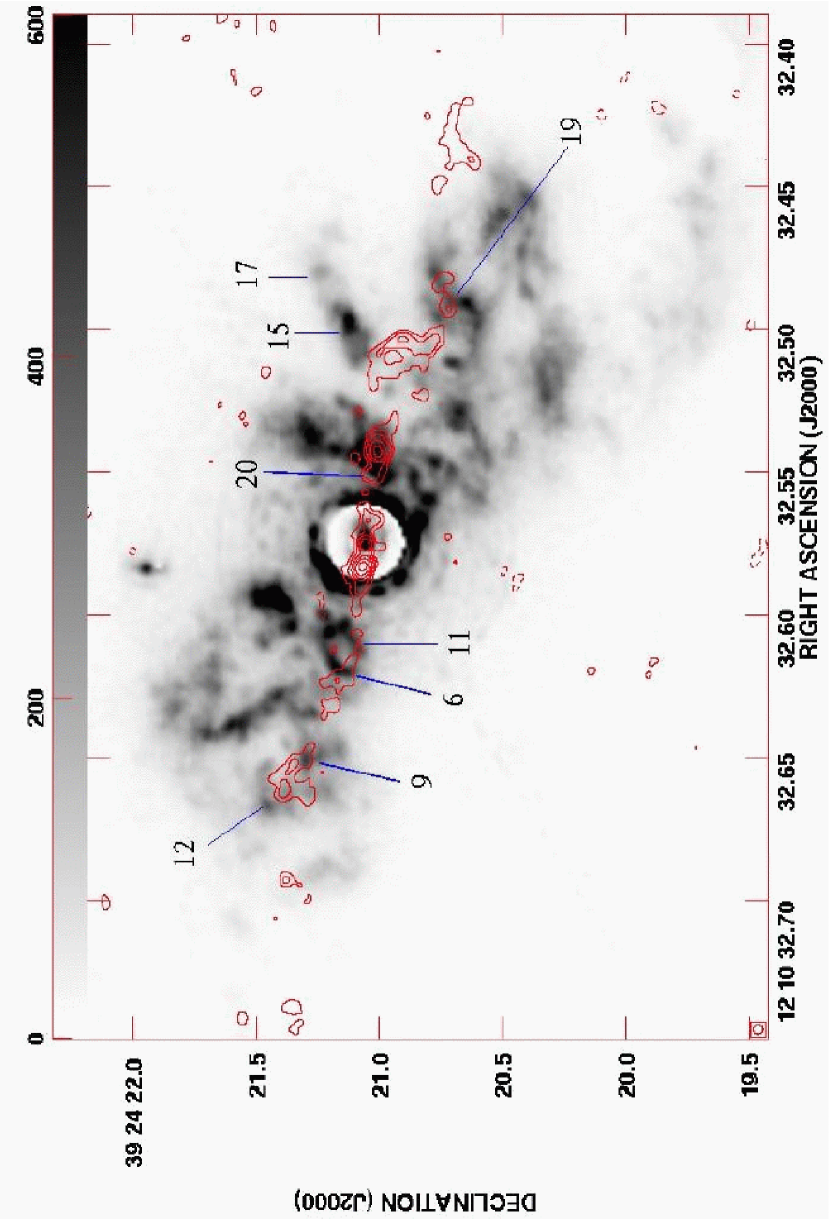
Until now, the relatively small angular extent ( few arcsecs) of Seyfert radio jets has limited the detail visible in VLA and MERLIN images and, radio images at even 01 angular resolution, have proven insufficient to identify a clear association between NLR clouds and radio jet components (e.g. Mundell et al. 1995; Kaiser et al 2000). Now however, the improved sensitivity of new radio VLBI studies is revolutionising the study of Seyfert radio jets. Figure 7 shows our 40-mas resolution image of the radio jet in NGC 4151 (from Figure 1) overlaid on the F501N narrow-band image taken with the Faint Object Camera (FOC) on board the Hubble Space Telescope (HST) (image courtesy of R. Catchpole; see also Wingé et al. 1997). The FOC image with 00143 pixels has been resampled to match the 00175 pixel size of this radio image and, since relative astrometry between the HST and VLBA images is insufficient for accurate ‘blind’ alignment, the peak of the optical nuclear emission (assumed originate from the AGN) was aligned with the peak of radio emission in component D, assumed to contain the AGN. A reliable comparison of the projected location of the optical line-emitting clouds and radio jet features is now possible, although any physical association along the line of sight is still unknown.
The misalignment of the radio jet and NLR supports photoionization of the NLR by the AGN as the dominant excitation mechanism. A similar misalignment is present between soft X-ray emission imaged with Chandra (Yang, Wilson & Ferruit 2001) and the radio jet. However, a small number of bright [Oiii]-emitting clouds appear to be closely associated with the jet, lying close to and appearing to bound the radio jet emission; these clouds are labelled 6, 9, 11, 12, 15, 17, 19, 20 in Figure 7. Kaiser et al. (2000) classify all of these clouds as low velocity ( 400 km s-1) but high velocity dispersion ( 130 km s-1) and suggest that they may be intrinsically high-velocity clouds with smaller projected components of velocity along the line of sight. In addition, Kaiser et al. (2000) note that clouds 15, 19 and 20 also have high velocity, blueshifted clouds ( 1000 km s-1) associated with them that are too faint to be visible in their labelled WFPC2 images. It is therefore likely that the radio jet might have cleared a channel through the NLR and suffered disturbance as a consequence; remaining NLR clouds then act to gently deviate the plasma flow. Alternatively, as modelled by Steffen et al. (1997), the enhanced optical emission from the clouds bounding the radio jet might arise due to compression by a cocoon around the radio jet; a structure of cylindrical nested shells are produced around the radio jet due to pressure stratification in the jet bow shock and the brightest compressed clouds then surround the cloud-free channel of the radio jet (see Figure 2 in Steffen et al. 1997). Numerical simulations, by Steffen et al., of this jet propagating through an inhomogeneous NLR-like medium show optical linewidths as high as 500 km s-1, and large variations in the cloud radial velocities, qualitatively similar to those observed for NGC 4151.
4.3 Complex H i Absorption and the Obscuring Torus
4.3.1 Comparison with UV/X-ray Absorption
Absorption by gas along the line of sight to AGN is observed at a variety of wavelengths, with X-ray and UV absorption occurring predominantly in ionized gas and radio absorption in neutral and molecular gas. The nature of the “warm” (or ionized) absorbing gas detected in X-ray spectra of the nuclei of nearby AGN is still unknown. As many as 50% of nearby AGN show absorption by ionized gas (e.g. George et al. 1998) with many also show associated UV absorption by highly ionized species such as C iv (Crenshaw et al. 1999; Kraemer et al. 2001). In NGC 4151 broad, saturated Ly absorption lines are detected in the UV (Kriss et al. 1995; Espey et al. 1998) and, when considered along with the properties of strong absorption lines due to other species such as Nv Civ Si iv, indicate that the absorber does not fully cover the source of background emission (Kraemer et al. 2001). The ionized gas appears to be outflowing from the nucleus with radial velocities as high as 1680 km s-1 (Kraemer et al. 2001) and cannot account for the observed X-ray absorption (e.g. George et al. 1998; Yang et al. 2001). Kraemer et al. (2001) suggest a model in which the UV absorber covers the BLR, with the X-ray absorber closer to the central source and obscuring a smaller X-ray emitting region.
The H i column densities in NGC 4151 derived from Ly absorption (e.g. Kriss et al. 1992, 1995; Espey et al. 1998), 3 1015(Ly) 61020 cm-2, are significantly lower than those derived from the present 21-cm observations (see Section 3), and although the UV continuum is known to be highly variable, the UV-measured column densities remain lower than the radio values. This confirms that the neutral gas obscuring the radio continuum emission is distinct from the UV-absorbing gas and we re-propose our geometrical model (Figure 6) in which the 21-cm H i absorbing gas is located in a neutral, photo-dissociated layer of the obscuring torus, detected in front of the first radio component in the radio counterjet (E+F), while the UV-absorbing gas is outflowing, ionized gas (possibly blown from the torus walls) along the line of sight to the nucleus.
4.3.2 A Clumpy Torus?
The total absorption spectrum across E+F is consistent with that detected in the MERLIN study (Mundell et al. 1995), but the presence of additional narrow absorption lines with higher velocities (Figure 4, Table 2) across E+F argues for dense clumps of gas within the circumnuclear disk or torus, and may indicate turbulence within the gas. Clumpiness of torus gas is predicted theoretically (e.g. Krolik & Begelman 1988), with cloud covering factors close to or greater than unity, and recent X-ray determinations of column density variations of 20%80% over timescales of months to years (e.g. Risalti, Elvis & Nicastro 2002) in Seyfert 2 nuclei support clumping of torus material on scales less than 1 pc. Clouds drifting across the background continuum source would then explain observed column density variations. Sub-parsec scale radio monitoring of the H i absorption across component E in NGC 4151 is required to determine if the neutral gas columns vary, and might therefore be associated with drifting cloud cores, or remain constant, suggesting H i it is the primary torus volume filler in which denser clouds are embedded.
4.3.3 NGC 4151 as a Nearby Radio Galaxy?
A similar scenario to that suggested for NGC 4151 has been proposed for H i absorption detected in the nuclear regions of the compact symmetric object 1946+708 (Peck, Taylor & Conway 1999), in which complex H i absorption is detected against the counterjet (see also Taylor 1996; Taylor et al 1999). Indeed the higher rate of detection of H i absorption in AGN with two-sided, non-boosted radio jets such as compact symmetric objects (CSO) and compact steep spectrum objects (CSS) compared with core-dominated radio sources, with Doppler-dimmed counterjets, provides support for the Unification Scheme in which objects seem close to the plane of the sky have a more favourable geometry and orientation for the detection of HI absorption against the counterjet due to gas in a nuclear obscuring torus (e.g. van Gorkom et al. 1989; Pihlström 2001). NGC 4151 is an unusual Seyfert in having neutral gas located close to the nucleus, unlike other Seyferts that show H i absorption associated with gas located in dust disks on scales of 100200 pc aligned with the host galaxy disk (e.g., Cole et al. 1998; Gallimore et al. 1999); in this respect, the H i absorption, and indeed the well-collimated radio jet in NGC 4151, closely resemble parsec-scale structures in CSO and CSS.
5 Conclusions
We have used the VLBA and phased VLA at 21 cm to study the parsec-scale radio continuum emission and distribution and kinematics of neutral hydrogen in absorption in the Seyfert galaxy NGC 4151. We find:
-
•
A faint, highly collimated radio jet, diameter 1.4 pc, underlying brighter radio knots, seen in lower resolution MERLIN and VLA images, that appear to be shock-like features associated with changes in direction as the jet interacts with small gas clouds within the central 100 pc of the galaxy.
-
•
H i absorption across the whole of component C4W (E+F), as predicted by Mundell et al. (1995), with complex spatial and kinematic structure.
-
•
The location and distribution of the HI absorption and the structure of the radio continuum emission argue for the AGN being located in component D, rather than component E as argued by Ulvestad et al. (1998).
-
•
We suggest the absorbing gas lies in a thin photo-dissociated layer of clumpy neutral gas in between the molecular and ionized gas in the circumnuclear torus, with an inner radius 3.3 (sin-1) pc.
-
•
The location of the absorbing gas close to the AGN is unusual for a Seyfert galaxy and we argue that the H i and continuum properties of NGC 4151 are similar to those seen in compact symmetric objects and compact steep spectrum objects.
-
•
Spatial association of the radio jet knots and optical line-emitting clouds with high velocity dispersion in the narrow line region suggest some interaction between the radio jet and the clumpy interstellar medium, but photoionization remains the dominant excitation mechanism for the NLR.
References
- Baum (1960) Baum, W.A. & Minkowski, R. 1960 AJ, 65, 483
- Blandford (1974) Blandford, R.D. & Rees, M.J. 1974 MNRAS, 169, 395
- Boksenberg (1995) Boksenberg, A. et al. 1995 ApJ, 440, 151
- Bosma (1977) Bosma, A., Ekers, R.D. & Lequeux, J. 1977 A&A, 57, 97
- Bridle (1984) Bridle, A. H., & Perley, R. A. 1984 ARA&A, 22, 319
- Bridle (1994) Bridle, A.H., Hough, D.H., Lonsdale, C.J., Burns, J.O. & Laing, R.A. 1994 AJ, 108, 766
- (7) Brunthaler, A. et al. 2000 A&A 357, L45
- Carral (1990) Carral, P., Turner, J.L. & Ho, P.T.P 1990 ApJ, 362, 434
- Cole (1998) Cole, G.H.J., Pedlar, A., Mundell, C.G., Gallimore, J.F. & Holloway, A.J. 1998 MNRAS, 301, 782
- Conway (1996) Conway, J.E. 1996, in The Second Workshop on Gigahertz Peaked Spectrum and Compact Steep Spectrum Radio Sources, eds. I.A.G. Snellen, R.T. Schilizzi, H.J.A. Rottering & M.N. Bremer [Leiden Observatory], 198
- Crenshaw (1999) Crenshaw, D.M., Kraemer, S.B., Boggess, A., Maran, S.P., Mushotzky, R.F. & Wu, C.C. 1999 ApJ, 516, 750
- Davies (1973) Davies, R.D 1973 MNRAS, 161, 25P
- de Bruyn (1978) de Bruyn, A.G. & Wilson, A.S. 1978 A&A, 64, 433
- Espey (1998) Espey, B.R., Kriss, G.A., Krolik, J.H., Zheng, W., Tsvetanov, Z. & Davidsen, A.F. 1998 ApJ, 500, L13
- Evans (1993) Evans, I.N., Tsvetanov, Z.I., Kriss, G.A., Ford, H.C., Caganoff, S. & Koratkar, A.P. 1993 ApJ, 417, 82
- Faison (1998) Faison, M.D., Goss, W.M., Diamond, P.J. & Taylor, G.B. 1998, AJ, 116, 2916
- Fanaroff & Riley (1974) Fanaroff, B. L., & Riley, J. M. 1974 MNRAS, 167, 31P
- (18) Fernandes, R.C. Jr., & Terlevich, R. 1995 MNRAS, 272, 423
- Fernandez (1999) Fernandez, B.R., Holloway, A.J., Meaburn, J., Pedlar, A. & Mundell, C.G. 1999 MNRAS, 305, 319
- Gallimore (1999) Gallimore, J.F., Baum, S.A., O’Dea, C.P., Pedlar, A. & Brinks, E. 1999 ApJ, 524, 684
- George (1998) George, I.M., Turner, T.J., Netzer, H., Nandra, K., Mushotzky, R.F. & Yaqoob, T. 1998 ApJS, 114, 73
- Goldschmidt (1999) Goldschmidt, P., Kukula, M.J., Miller, L. & Dunlop, J.S. 1999 ApJ, 511, 612
- Hagiwara (2000) Hagiwara, Y., Diamond, P.J., Nakai, N. & Kawabe, R. 2000 A&A, 360, 49
- Harrison (1986) Harrison, B.A., Pedlar, A., Unger, S.W., Burgess, P., Graham, D.A. & Preuss, E. 1986 MNRAS, 218, 775
- Hazard (1963) Hazard, C., Mackey, M.B. & Shimmins, A.J. 1963, Nature, 197, 1037
- Heiles (1988) Heiles, C. & Kulkarni, S. 1988, in Galactic and Extragalactic Radio Astronomy, ed. K. Kellerman & G. Verschuur (2nd ed.;Berlin:Kluwer), 95
- Ho, Filippenko, & Sargent (1997) Ho, L. C., Filippenko, A. V., & Sargent, W. L. W. 1997 ApJ, 487, 568
- Hough (1996) Hough, D.H., Zensus, J.A. & Porcas, R.W. 1996 ApJ, 464, 715
- Huchra & Burg (1992) Huchra, J., & Burg, R. 1992, ApJ, 393, 90
- Hutchings (1998) Hutchings, J.B. et al. 1998 ApJ, 492, L115
- Johnston (1982) Johnston, K.J., Elvis, M., Kjer, D. & Shen, B.S.P. 1982 ApJ, 262, 61
- Kaiser (2000) Kaiser, M.E. et al. 2000 ApJ, 528, 260
- Kraemer (2001) Kraemer, S.B. et al. 2001 ApJ, 551, 671
- Kriss (1992) Kriss, G.A. et al. 1992 ApJ, 392, 485
- Kriss (1995) Kriss, G.A., Davidsen, A.F., Zheng, W., Kruk, J.W. & Espey, B.R. 1995 ApJ, 454, L7
- Krolik,Bege (1986) Krolik, J.H. & Begelman, M.C. 1988 ApJ, 329, 702
- Krolik (1989) Krolik, J.H. & Lepp 1989 ApJ, 347, 179
- Kukula (1999) Kukula, M.J., Ghosh, T., Pedlar, A.& Schilizzi, R.T. 1999 ApJ, 518, 117
- (39) Mundell, C.G., Pedlar, A., Baum, S.A., O’Dea, C.P., Gallimore, J.F. & Brinks, E. 1995 MNRAS, 272, 355
- Mund (1999) Mundell, C.G. & Shone, D.L. 1999 MNRAS, 304, 475
- Mundell (1999) Mundell, C.G., Pedlar, A., Shone, D.L. & Robinson, A. 1999 MNRAS, 304, 481
- Mundell (2000) Mundell, C.G., Wilson, A.S., Ulvestad, J.S. & Roy, A.L. 2000 ApJ, 529, 816
- Nagar (1999) Nagar, N.M, Wilson, A.S., Mulchaey, J.S. & Gallimore, J.F. 1999 ApJS, 120, 209
- Peck (1999) Peck, A. 1999, Ph.D. Thesis, New Mexico Institute of Mining and Technology
- PeckTC (1999) Peck, A.B., Taylor, G.B. & Conway, J.E. 1999 ApJ, 521, 103
- Peck (2001) Peck, A. & Taylor, G.B. 2001 ApJ, 554, L150
- Peck (2002) Peck, A. & Taylor, G.B. 2002 New Astronomy Reviews, 46, 273
- Pedlar (1992) Pedlar, A., Howley, P., Axon, D.J. & Unger, S.W., 1992 MNRAS, 259, 369
- Pedlar (1993) Pedlar, A., Kukula, M.J., Longley, D.P.T., Muxlow, T.W.B., Axon, D.J., Baum, S., O’Dea, C. & Unger, S.W. 1993 MNRAS, 263, 471
- Pier (1995) Pier, E.A. & Voit, G.M. 1995 ApJ, 450, 628
- (51) Pilström, Y.M. 2001 Ph.D. thesis, Chalmers Univ.
- Pohl (1995) Pohl, M. et al. 1995 A&A, 303, 383
- Ris (2002) Risalti, G., Elvis, M. & Nicastro, F. 2002 ApJ, 571, 234
- (54) Robinson, A. et al. 1994 A&A, 291, 351
- Scheuer (1974) Scheuer, P.A. 1974 MNRAS, 166, 51
- (56) Schultz, H. 1990 AJ, 99, 1442
- Steffen (1997) Steffen, W., Gomez, J.L., Raga, A.C. & Williams, R.J.R. 1997 ApJ, 491, L76
- Taylor (1996) Taylor, G.B. 1996 ApJ, 470, 394
- Taylor (1999) Taylor, G.B., O’Dea, C.P., Peck, A.B. & Koekemoer, A.M. 1999 ApJ, 512, L27
- Thompson (1980) Thompson, A.R., Clark, B.G., Wade, C.M. & Napier, P.J. 1980, ApJS, 44, 151
- Ulrich (2000) Ulrich, M.-H. 2000, A&A Reviews, 10, 135
- Ulvestad & Wilson (1989) Ulvestad, J. S., & Wilson, A. S. 1989, ApJ, 343, 659
- Ulvestad (1998) Ulvestad, J.S., Roy, A.L., Colbert, E.J.M. & Wilson, A.S. 1998 ApJ, 496, 196
- ulvestad (1999) Ulvestad, J.S., Wrobel, J.M. & Carilli, C.L. 1999 ApJ, 516, 127
- Ulvestad (1999) Ulvestad, J.S., Wrobel, J.M., Roy, A.L., Wilson, A.S., Falcke, H. & Krichbaum, T.P. 1999 ApJ, 517, L81
- Urry (1995) Urry, C.M. & Padovani, P. 1995 PASP, 107, 803
- (67) van Moorsel, G., Kemball, A., & Greisen, E. 1996, in Astronomical Data Analysis Software and Systems V, ASP Conf. Series 101, eds., Jacoby, G.H. & Barnes, J., 37
- Walker (1995) Walker, R.C. 1995, in ASP Conf. Ser. 82, Very Long Baseline Interferometry and the VLBA, ed.J.A. Zensus, P.J. Diamond, & P.J. Napier (San Francisco: ASP), 247
- Whittle (1985) Whittle, M. 1985 MNRAS, 213, 33
- Whittle (1992) Whittle, M. 1992 ApJ, 387, 109
- Wilson (1982) Wilson, A.S. & Willis, A.G. 1980 ApJ, 240, 429
- Wilson (1982) Wilson, A.S. & Ulvestad, J.S. 1982 ApJ, 263, 576
- Wilson (1991) Wilson, A. S. 1991, in The Interpretation of Modern Synthesis Observations of Spiral Galaxies, ASP Conf. Ser. 18, ed. N. Duric & P. C. Crane (San Francisco: ASP), 227
- Winge (1997) Wingé, C., Axon, D.J., Macchetto, F.D. & Capetti, A. 1997 ApJ, 487, L121
- Yang (2001) Yang, Y., Wilson, A.S. & Ferruit, P. 2001 ApJ, 563, 124
| Mundell et al. (1995) | Ulvestad et al. 1998 |
| and This Paper | |
| C1 . . . . . . . . . . . . . . . . . . . . | A |
| C2 . . . . . . . . . . . . . . . . . . . . | B |
| C3 . . . . . . . . . . . . . . . . . . . . | C |
| C3-C4, eastern bridge. . . . . . . . . | X† |
| C4W. . . . . . . . . . . . . . . . . . . | D |
| C4E, peak. . . . . . . . . . . . . . . . | E |
| C4E, eastern ‘tail’. . . . . . . . . . . | F |
| C5, western extension. . . . . . . . . | G |
| C5 . . . . . . . . . . . . . . . . . . . . | H |
| C5, eastern extension . . . . . . . . . | I† |
| †New component identified in this paper |
| Box Label | Component Velocity | Width | Mean /TS |
| (see Fig. 4) | (Optical Heliocentric km s-1) | (km s-1) | (1019 cm-2 K-1) |
| 928.7 | 16 | 0.7 | |
| 962.2 | 20 | 1.1 | |
| 1022.3 | 26 | 1.0 | |
| 1132.5 | 20 | 0.6 | |
| 1476.6 | 33 | 1.2 | |
| 825.2 | 20 | 1.8 | |
| 925.4 | 20 | 1.8 | |
| 978.9 | 20 | 2.1 | |
| 1132.5 | 20 | 0.9 | |
| 1443.2 | 20 | 0.9 | |
| 848.6 | 13 | 0.8 | |
| 982.2 | 20 | 2.0 | |
| 1443.2 | 20 | 1.2 | |
| 1002.2 | 40 | 4.8 | |
| 1323.0 | 20 | 1.4 | |
| 1673.7 | 20 | 1.7 | |
| 988.9 | 26 | 3.6 | |
| 1045.7 | 20 | 1.1 | |
| 1209.4 | 20 | 1.1 |