11email: mercurio,girardi,boschin@ts.astro.it 22institutetext: INAF - Osservatorio Astronomico di Capodimonte, via Moiariello 16, I80100- Napoli, Italy
22email: merluzzi,busarello@na.astro.it
Structure and Evolution of Galaxy Clusters: Internal Dynamics of ABCG 209 at z0.21. ††thanks: Based on observations collected at the European Southern Observatory, Chile (Proposal ESO N 68.A-0116)
We study the internal dynamics of the rich galaxy cluster ABGC 209 on the basis of new spectroscopic and photometric data. The distribution in redshift shows that ABCG 209 is a well isolated peak of 112 detected member galaxies at , characterised by a high value of the line–of–sight velocity dispersion, – km s-1, on the whole observed area (1 Mpc from the cluster center), that leads to a virial mass of –within the virial radius, assuming the dynamical equilibrium. The presence of a velocity gradient in the velocity field, the elongation in the spatial distribution of the colour–selected likely cluster members, the elongation of the X–ray contour levels in the Chandra image, and the elongation of cD galaxy show that ABCG 209 is characterised by a preferential NW–SE direction. We also find a significant deviation of the velocity distribution from a Gaussian, and relevant evidence of substructure and dynamical segregation. All these facts show that ABCG 209 is a strongly evolving cluster, possibly in an advanced phase of merging.
Key Words.:
Galaxies: clusters: general – Galaxies: clusters: individual: ABCG 209 – Galaxies: distances and redshifts – intergalactic medium – Cosmology: observations1 Introduction
The investigation of clusters of galaxies offers a rare possibility to link many aspects of astrophysics and cosmology and, in particular, to understand the processes that lead to the formation of structures.
In hierarchical clustering cosmological scenarios galaxy clusters form from the accretions of subunits. Numerical simulations show that clusters form preferentially through anisotropic accretion of subclusters along filaments (West et al. wes91 (1991); Katz & White kat93 (1993); Cen & Ostriker cen94 (1994); Colberg et al col98 (1998), col99 (1999)). The signature of this anisotropic cluster formation is the cluster elongation along the main accretion filaments (e.g., Roettiger et al. roe97 (1997)). Therefore the knowledge of the properties of galaxy clusters, plays an important role in the study of large–scale structure (LSS) formation and in constraining cosmological models.
By studying the structure of galaxy clusters it is possible to discriminate between different cosmological models (e.g., Richstone et al. ric92 (1992); Lacey & Cole lac94 (1994); Thomas et al. tho98 (1998)). In fact, in a low–density universe the clustering tends to freeze at (z+1) = , while in a high–density universe it continues to grow to the present day. This implies that clusters in a low–density universe are expected to be dynamically more relaxed and to have less subsystems, called substructures.
On small scales, clusters appear as complex systems involving a variety of interacting components (galaxies, X–ray emitting gas, dark matter). A large fraction of clusters (30%-40%) contain substructures, as shown by optical and X–ray studies (e.g., Baier & Ziener bai77 (1977); Geller & Beers gel82 (1982); Girardi et al. gir97 (1997); Jones & Forman jon99 (1999)) and by recent results coming from the gravitational lensing effect (e.g., Athreya et al. ath02 (2002); Dahle et al. dah02 (2002)), suggesting that they are still in the dynamical relaxation phase. Indeed, there is growing evidence that these subsystems arise from merging of groups and/or clusters (cf. Buote buo02 (2002); and Girardi & Biviano gir02 (2002) for reviews).
Very recently, it was also suggested that the presence of radio halos and relics in clusters is indicative of a cluster merger. Merger shocks, with velocities larger than 103 km s-1, convert a fraction of the shock energy into acceleration of pre–existing relativistic particles and provide the large amount of energy necessary for magnetic field amplification (Feretti fer00 (2000)). This mechanism has been proposed to explain the radio halos and relics in clusters (Brunetti et al. bru01 (2001)).
The properties of the brightest cluster members (BCMs) are related to the cluster merger. Most BCMs are located very close to the center of the parent cluster. In many cases the major axis of the BCM is aligned along the major axis of the cluster and of the surrounding LSS (e.g., Binggeli bin82 (1982); Dantas et al. dan97 (1997); Durret et al. dur98 (1998)). These properties can be explained if BCMs form by coalescence of the central brightest galaxies of the merging subclusters (Johnstone et al. joh91 (1991)).
The optical spectroscopy of member galaxies is the most powerful tool to investigate the dynamics of cluster mergers, since it provides direct information on the cluster velocity field. However this is often an ardue investigation due to the limited number of galaxies usually available to trace the internal cluster velocity. To date, at medium and high redshifts (z 0.2), only few clusters are really well sampled in the velocity space (with 100 members; e.g., Carlberg et al car96 (1996); Czoske et al. czo02 (2002)).
In order to gain insight into the physics of the cluster formation, we carried out a spectroscopic and photometric study of the cluster ABCG 209, at z0.2 (Kristian et al. kri78 (1978); Wilkinson & Oke wil78 (1978); Fetisova fet81 (1981)), which is a rich, very X–ray luminous and hot cluster (richness class , Abell et al. abe89 (1989); erg , Ebeling et al. ebe96 (1996); keV, Rizza et al. riz98 (1998) ) . The first evidence for its complex dynamical status came from the significant irregularity in the X–ray emission with a trimodal peak (Rizza et al. riz98 (1998)). Moreover, Giovannini et al. (gio99 (1999)) have recently found evidence for the presence of a possible extended Radio–emission.
The paper is organised as follows. In Sect. 2 we present the new spectroscopic data and the data reduction. The derivation of the redshifts is presented in Sect. 3. In Sect. 4 we analyse the dynamics of the cluster, and in Sect. 5 we complete the dynamical analysis with the information coming either from optical imaging or from X–ray data. In Sect. 6 we discuss the results in terms of two pictures of the dynamical status of ABCG 209. Finally, a summary of the main results is given in Sect. 7.
Throughout the paper, we assume a flat cosmology with and . For the sake of simplicity in rescaling, we adopt a Hubble constant of 100 h km sMpc-1. In this assumption, 1 arcmin corresponds to 0.144 Mpc. Unless otherwise stated, we give errors at the 68% confidence level (hereafter c.l.).
2 Observations and data reduction
The data were collected at the ESO New Technology Telescope (NTT) with the ESO Multi Mode Instrument (EMMI) in October 2001.
2.1 Spectroscopy
Spectroscopic data have been obtained with the multi–object spectroscopy (MOS) mode of EMMI. Targets were randomly selected by using preliminary R–band images (Texp=180 s) to construct the multislit plates. We acquired five masks in four fields (field of view ), with different position angles on the sky, allocating a total of 166 slitlets (alligment stars included). In order to better sample the denser cluster region, we covered this region with two masks and with the overlap of the other three masks. We exposed the masks with integration times from 0.75 to 3 hr with the EMMI–Grism#2, yielding a dispersion of Å/pix and a resolution of ÅFWHM, in the spectral range 385 – 900 nm.
Each scientific exposure (as well as flat fields and calibration lamps) was bias subtracted. The individual spectra were extracted and flat field corrected. Cosmic rays were rejected in two steps. First, we removed the cosmic rays lying close to the objects by interpolation between adjacent pixels, then we combined the different exposures by using the IRAF111IRAF is distributed by the National Optical Astronomy Observatories, which are operated by the Association of Universities for Research in Astronomy, Inc., under cooperative agreement with the National Science Foundation. task IMCOMBINE with the algorithm CRREJECT (the positions of the objects in different exposures were checked before). Wavelength calibration was obtained using He–Ar lamp spectra. The typical r.m.s. scatter around the dispersion relation was 15 km s. The positions of the objects in the slits were defined interactively using the IRAF package APEXTRACT. The exact object position within the slit was traced in the dispersion direction and fitted with a low order polynomial to allow for atmospheric refraction. The spectra were then sky subtracted and the rows containing the object were averaged to produce the one–dimensional spectra.
The signal–to–noise ratio per pixel of the one–dimensional galaxy spectra ranges from about 5 to 20 in the region 380–500 nm.
2.2 Photometry
A field of (1.2 1.1 Mpc2 at z=0.209) was observed in B–, V– and R–bands pointed to the center of the cluster. Two additional adjacent fields were observed in V–band in order to sample the cluster at large distance from the center (out to 1.5 Mpc). The reduction of the photometric data will be described elsewhere (Mercurio et al. mer02 (2002), in preparation). In order to derive magnitudes and colours we used the software SExtractor (Bertin & Arnouts ber96 (1996)) to measure the Kron magnitude (Kron kro80 (1980)) in an adaptive aperture equal to , where is the Kron radius and a is a constant. Following Bertin & Arnouts (ber96 (1996)), we chose , for which it is expected that the Kron magnitude encloses of the total flux of the source. We use the photometric data to investigate the colour segregation in Sect. 5.
3 Redshifts measurements
Redshifts were derived using the cross–correlation technique (Tonry & Davis ton81 (1981)), as implemented in the RVSAO package. We adopted galaxy spectral templates from Kennicutt (ken92 (1992)), corresponding to morphological types EL, S0, Sa, Sb, Sc, Ir. The correlation was computed in the Fourier domain.
Out of the 166 spectra, 112 turned out to be cluster members (seven of which observed twice), 22 are stars, 8 are nearby galaxies, 1 is foreground and 6 are background galaxies. In 10 cases we could not determine the redshift.
In order to estimate the uncertainties in the redshift measurements, we considered the error calculated with the cross–correlation technique, which is based on the width of the peak and on the amplitude of the antisymmetric noise in the cross correlation. The wavelength calibration errors ( 15 km s) turned out to be negligible in this respect. The errors derived from the cross–correlation are however known to be smaller than the true errors (e.g., Malumuth et al. mal92 (1992); Bardelli et al. bar94 (1994); Quintana et al. qui00 (2000)). We checked the error estimates by comparing the redshifts computed for the seven galaxies for which we had duplicate measurements. The two data sets agree with one–to–one relation, but a reasonable value of for the fit was obtained when the errors derived from the cross–correlation were multiplied by a correction factor (). A similar correction was obtained by Malumuth et al. (mal92 (1992); 1.6), Bardelli et al. (bar94 (1994); 1.87), and Quintana et al. (qui00 (2000); 1.57). External errors, which are however not relevant in the study of internal dynamics, cannot be estimated since only two previous redshifts are available for ABCG 209.
The catalogue of the spectroscopic sample is presented in Table 1, which includes: identification number of each galaxy, ID (Col. 1); right ascension and declination (J2000), and (Col. 2 and 3); V magnitude (Col. 4); B–R colour (Col. 5); heliocentric corrected redshift (Col. 6) with the uncertainty (Col. 7);
Our spectroscopic sample is 60% complete for V20 mag and drops steeply to 30% completeness at V21 mag; these levels are reached both for the external and the internal cluster regions. The spatial distribution of galaxies with measured redshifts does not show any obvious global bias. Only around the brightest cluster member (cD galaxy; c.f. La Barbera et al. lab02 (2002) in preparation) the spatial coverage is less complete because of geometrical restrictions. This does not affect our dynamical analysis because we investigate structures at scales larger than 0.1 Mpc .
4 Dynamical analysis
4.1 Member selection and global properties
ABCG 209 appears as a well isolated peak in the redshift space. The analysis of the velocity distribution based on the one–dimensional adaptive kernel technique (Pisani pis93 (1993), as implemented by Fadda et al. fad96 (1996) and Girardi et al. gir96 (1996)) confirms the existence of a single peak at .
Fig. 1 shows the redshift distribution of the 112 cluster members. The mean redshift in the present sample is , as derived by the biweight estimator (Beers et al. bee90 (1990)).

In order to determine the cluster center, we applied the two–dimensional adaptive kernel technique to galaxy positions. The center of the most dense peak (= 01 31 52.70, = -13 36 41.9) is close to the position of cD galaxy (= 01 31 52.54, = -13 36 40.4).
We estimated the line–of–sight (LOS) velocity dispersion, , by using the biweight estimator (ROSTAT package; Beers et al. bee90 (1990)). By applying the relativistic correction and the usual correction for velocity errors (Danese et al. dan80 (1980)), we obtained km s-1, where errors were estimated with the bootstrap method.
In order to check for possible variation of and with increasing radius we plot the integrated mean velocity and velocity dispersion profiles in Fig. 2. The measure of mean redshift and velocity dispersion sharply vary in the internal cluster region although the large associated errors do not allow to claim for a statistically significant variation. On the other hand, in the external cluster regions, where the number of galaxies is larger, the estimates of and are quite robust.

Assuming that the system is in dynamical equilibrium, the value of leads to a value of the radius of the collapsed, quasi–virialized region Mpc (cf. Eq. (1) of Girardi & Mezzetti 2001). Therefore our spectroscopic data sample about half of the virial region ( 1 Mpc). Under the same assumption, we estimated the mass of the system by applying the virial method. In particular, for the surface term correction to the standard virial mass we assumed a value of (cf. Girardi & Mezzetti gir01 (2001)), obtaining .
4.2 Possible contamination effects
We further explored the reliability of related to the possibility of contamination by interlopers.
The cluster rest–frame velocity vs. projected clustercentric distance is shown in Fig. 3. Although no obvious case of outliers is present, we applied the procedure of the “shifting gapper” by Fadda et al. (fad96 (1996)). This procedure rejects galaxies that are too far in velocity from the main body of galaxies of the whole cluster within a fixed bin, shifting along the distance from the cluster center. According to the prescriptions in Fadda et al. (fad96 (1996)), we used a gap of km sand a bin of 0.4 Mpc, or large enough to include at least 15 galaxies.

In this way we rejected three galaxies (indicated by squares in Fig. 3). However, for ABCG 209 the results are too much sensitive to small changes of the adopted parameters. For instance, with a bin of Mpc no galaxy was rejected, while seven galaxies were rejected with a bin of Mpc (cf. crosses in Fig. 3). In the last case, we obtained a value of km s-1, which is slightly smaller than– (although fully consistent with–) the value computed in Sect. 4.1 (cf. also the velocity dispersion profile in Fig. 2). With this value of the velocity dispersion, the computation for the mass within Mpc leads to a value of total mass .
We determined the galaxy density and the integrated LOS velocity dispersion along the sequence of galaxies with decreasing density beginning with the cluster center (Kittler kit76 (1976); Pisani pis96 (1996)). As shown in Fig. 4 the density profile has only two minor peaks, possibly due to non complete sampling, and their rejection leads to a small variation in the estimate of and in the behaviour of velocity dispersion profile (cf. with Figure 2 of Girardi et al. gir96 (1996) where the large effect caused by a close system is shown).

We conclude that the contamination by interlopers cannot explain the high value of velocity dispersion, which is therefore connected to the peculiarity of the internal dynamics of the cluster itself. In fact, a high value of is already present in the internal cluster region, namely within 0.2–0.3 Mpc (cf. Fig. 2), where the contamination is expected to be negligible.
4.3 Velocity distribution
In order to better characterise the velocity distribution, we considered its kurtosis , skewness , scaled tail index , and the probability associated to the W–test , (cf. Shapiro & Wilk sha65 (1965)).
For the kurtosis and the skewness we found , , respectively, i.e. values that are consistent with a Gaussian distribution (reference value =3, =0). The indicates the amount of the elongation in a sample relative to the standard Gaussian. This is an alternative to the classical kurtosis estimator, based on the data set percentiles as determined from the order statistics (e.g., Rosenberger & Gasko ros83 (1983)). The Gaussian, which is by definition neutrally elongated, has . Heavier–tailed distributions have 1.25 (see, e.g., Beers et al. bee91 (1991)). For our data , indicating a heavier–tailed distribution, with 95%-99% c.l. (cf. Table 2 of Bird & Beers bir93 (1993)). On the other hand, the W–test rejected the null hypothesis of a Gaussian parent distribution, with only a marginal significance at c.l.
In order to detect possible subclumps in the velocity distribution, we applied the KMM algorithm (cf. Ashman et al ash94 (1994) and refs. therein). By taking the face value of maximum likelihood statistics, we found a marginal evidence that a mixture of three Gaussians (of , , and members at mean redshift , , and ) is a better description of velocity distribution (at c.l.). For the clumps we estimated a velocity dispersion of km s, km s, and km s. Fig. 5 shows the spatial distributions of the three clumps. The second and the third clumps are clearly spatially segregated.

4.4 Velocity field
The above result suggested to investigate the velocity field in more detail. To this aim, we divided galaxies into a low– and a high–velocity sample (with respect to the mean redshift). Fig. 5 shows that low– and high–velocity galaxies are clearly segregated in the E–W direction, the two distributions being different at the c.l., according to the two–dimensional Kolmogorov–Smirnov test (hereafter 2DKS–test; cf. Fasano & Franceschini fas87 (1987), as implemented by Press et al. pre92 (1992)).
We then looked for a possible velocity gradient by means of a multi–linear fit (e.g., implemented by NAG Fortran Workstation Handbook, nag86 (1986)) to the observed velocity field (cf. also den Hartog & Katgert den96 (1996); Girardi et al. gir96 (1996)). We found marginal evidence (c.l. ) for the presence of a velocity gradient in the direction SE–NW, at position angle PA degrees (cf. Fig. 6). In order to assess the significance of the velocity gradient, we performed 1000 Monte Carlo simulations by randomly shuffling the galaxy velocities and determined the coefficient of multiple determination () for each of them. We then defined the significance of the velocity gradient as the fraction of times in which the of the simulation was smaller than the observed .

4.5 3D substructure analysis
In order to check for the presence of substructure, we combined velocity and position information by computing the –statistics 222For each galaxy, the deviation is defined as , where subscript l denotes the average over the 10 neighbours of the galaxy. is the sum of the of the individual galaxies. devised by Dressler & Schectman (dre88 (1988)) . We found a value of 162 for the parameter, which gives the cumulative deviation of the local kinematical parameters (velocity mean and velocity dispersion) from the global cluster parameters. The significance of substructure was checked by running 1000 Monte Carlo simulations, randomly shuffling the galaxy velocities, obtaining a significance level of .
This indicates that the cluster has a complex structure.
The technique by Dressler & Schectman does not allow a direct identification of galaxies belonging to the detected substructure; however it can roughly identify the positions of substructures. To this aim, in Fig. 7 the galaxies are marked by circles whose diameter is proportional to the deviation of the individual parameters (position and velocity) from the mean cluster parameters.
A group of galaxies with high velocity is the likely cause of large values of in the external East cluster region. The other possible substructure lies in the well sampled cluster region, closer than arcmin SW to the cluster center .

5 Galaxy populations and the hot gas
5.1 Luminosity and colour segregation
In order to unravel a possible luminosity segregation, we divided the sample in a low and a high–luminosity subsamples by using the median V–magnitude (53 and 54 galaxies, respectively), and applied them the standard means test and F–test (Press et al. pre92 (1992)). We found no significant difference between the two samples.

We also looked for possible colour segregation, by dividing the sample in a blue and a red subsamples relative to the median colour B–R of the spectroscopic sample (41 and 44 galaxies, respectively). There is a slight differences in the peaks of the velocity distributions, and , which gives a marginal probability of difference according to the means test (). The velocity dispersions are different being km slarger than km s(at the c.l., according to the F–test), see also Fig. 8. Moreover, the two subsamples differ in the distribution of galaxy positions ( according to the 2DKS test), with blue galaxies lying mainly in the SW–region (cf. Fig. 9).

The reddest galaxies (B–R) are characterised by a still smaller velocity dispersion (732 km s-1) and the bluest (B–R) by a larger velocity dispersion (1689 km s-1). Fig. 10 plots velocities vs. clustercentric distance for the four quartiles of the colour distribution: the reddest galaxies appear well concentrated around the mean cluster velocity. From a more quantitative point of view, there is a significant negative correlation between the B–R colour and the absolute value of the velocity in the cluster rest frame at the c.l. (for a Kendall correlation coefficient of ).

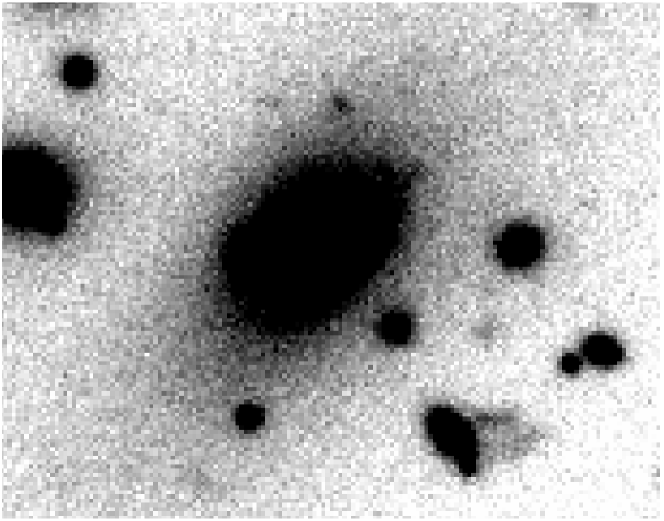
The velocity of the cD galaxy (z) shows no evidence of peculiarity according to the Indicator test by Gebhardt & Beers (geb91 (1991)). Moreover, the cD galaxy shows an elongation in the NE–SW direction (cf. Fig. 11, see La Barbera et al. lab02 (2002), in preparation, for more details)
5.2 Substructures with photometric data
We performed a two–dimensional analysis to detect subclumps using the photometric sample of galaxies for which we have B–R colours. This allows us to take advantage of the larger size of the photometric sample compared to the spectroscopic one. Galaxies were selected within mag of the B–R vs. R colour–magnitude relation and within the completeness limit magnitude R mag. The colour–magnitude relation was determined on the N=85 spectroscopically confirmed cluster members, for which we have B–R colours. The above selection leads to 3.68 (B–R) + 0.097 R 4.68, with a sample size of N=392 galaxies.

Fig. 12 shows the B–R vs. R colour–magnitude diagram for the 596 galaxies detected in the R–band in the ABCG 209 central field. The sample includes also the 85 member galaxies with known redshift. The colour–magnitude relation was derived by using a linear regression based on the biweight estimator (see Beers et al. 1990).
Fig. 13 – upper panel – shows the projected galaxy distribution is clustered and elongated in the SE–NW direction. Notice that there is no clear clump of galaxies perfectly centered on the cD galaxy, whose position is coincident with the center determined in Sect. 4.1 from redshift data only. In order to investigate this question, we noted that galaxies with redshift data are brighter than 22 R–mag, being the of them brighter than 19.5 mag. We give the distributions of 110 galaxies and 282 galaxies brighter and fainter than 19.5 mag, respectively, in central and lower panels (Fig. 13). Brighter galaxies are centered around the cD, while fainter galaxies show some clumps aligned in the SE–NW direction; in particular the main clump, Eastern with respect the cD galaxies, coincides with the secondary peak found in our analysis of Chandra X–ray data (see below).


5.3 Analysis of X–ray data
The X–ray analysis of ABCG 209 was performed by using the Chandra ACIS–I observation 800030 (exposure ID#522) stored in the Chandra archive333http://asc.harvard.edu/cda/. The pointing has an exposure time of 10 ksec.
Data reduction was performed by using the package CIAO444CIAO is freely available at http://asc.harvard.edu/ciao/(Chandra Interactive Analysis of Observations). First, we removed events from the level 2 event list with a status not equal to zero and with grades one, five and seven. Then, we selected all events with energy between 0.3 and 10 keV. In addition, we cleaned bad offsets and examined the data on a chip by chip basis, filtering out bad columns and removing times when the count rate exceeded three standard deviations from the mean count rate per 3.3 second interval. We then cleaned each chip for flickering pixels, i.e. times where a pixel had events in two sequential 3.3 second intervals. The resulting exposure time for the reduced data is 9.86 ks.
The temperature of the ICM was computed extracting the spectrum of the cluster within a circular aperture of 3 arcminutes radius around the cluster center. Freezing the absorbing galactic hydrogen column density at 1.64 1020 cm-2, computed from the HI maps by Dickey & Lockman (dic90 (1990)), we fitted a Raymond–Smith spectrum using the CIAO package Sherpa with a statistics. We found a best fitting temperature of keV.
In order to detect possible substructures in ABCG 209 we ran the task CIAO/Wavdetect on a subimage of 1600 by 1600 pixels containing the cluster. The task was run on different scales in order to search for substructure with different sizes. The significance threshold was set at .
The results are shown in Fig. 14. Two ellipses are plotted representing two significant substructures found by Wavdetect. The principal one, located at = 01 31 52.7 and = -13 36 41, is centered on the cD galaxy, the left one is a secondary structure located at = 01 31 55.7 and = -13 36 54, about 50 arcseconds (120 kpc) East of the cD (cf. also Fig. 13). The secondary clump is well coincident with the Eastern clump detected by Rizza et al. (riz98 (1998)) by using ROSAT HRI X–ray data, while we do not find any significant substructure corresponding to their Western excess.
6 Formation and evolution of ABCG 209
The value we obtained for the LOS velocity dispersion km s(Sect. 4.1) is high compared to the typical, although similar values are sometimes found in clusters at intermediate redshifts (cf. Fadda et al. fad96 (1996); Mazure et al. maz96 (1996); Girardi & Mezzetti gir01 (2001)). In Sect. 4.2 we show that this high value of is not due to obvious interlopers: also a very restrictive application of the “shifting gapper” or the rejection of minor peaks in galaxy density lead to only a slightly smaller value of km s-1. The high global value of – km sis consistent with the high value of keV coming from the X–ray analysis (which, assuming , would correspond to km s, cf. Fig. 2) and with the high value of erg (Ebeling et al. ebe96 (1996); cf. with – relation by e.g., Wu et al. wu99 (1999); Girardi & Mezzetti gir01 (2001)).
Therefore, on the basis of the global properties only, one could assume that ABCG 209 is not far from dynamical equilibrium and rely on large virial mass estimate here computed Mpc or Mpc .
On the other hand, the analysis of the integral velocity dispersion profile shows that a high value of is already reached within the central cluster region of 0.2–0.3 Mpc. This suggests the possibility that a mix of clumps at different mean velocity causes the high value of the velocity dispersion.
A deeper analysis shows that ABCG 209 is currently undergoing a dynamical evolution. We find evidence for a preferential SE–NW direction as indicated by: a) the presence of a velocity gradient; b) the elongation in the spatial distribution of the colour–selected likely cluster members; c) the elongation of the X–ray contour levels in the Chandra image; d) the elongation of the cD galaxy.
In particular, velocity gradients are rarely found in clusters (e.g., den Hartog & Katgert den96 (1996)) and could be produced by rotation, by presence of internal substructures, and by presence of other structures on larger scales such as nearby clusters, surrounding superclusters, or filaments (e.g., West wes94 (1994); Praton & Schneider pra94 (1994)).
The elongation of the cD galaxies, aligned along the major axis of the cluster and of the surrounding LSS (e.g., Binggeli bin82 (1982); Dantas et al. dan97 (1997); Durret et al. dur98 (1998)), can be explained if BCMs form by coalescence of the central brightest galaxies of the merging subclusters (Johnstone et al. joh91 (1991)).
Other evidence that this cluster is far from dynamical equilibrium comes out from deviation of velocity distribution from Gaussian, spatial and kinematical segregation of members with different B–R colour, and evidence of substructure as given by the Dressler–Schectman test (dre88 (1988)). In particular, although a difference in between blue and red members is common in all clusters (e.g., Carlberg et al. car97 (1997)), a displacement in mean velocity or in position center is more probably associated with a situation of non equilibrium (e.g., Bruzendorf & Meusinger bru99 (1999)).
Possible subclumps, if any, cannot be easily separated by using 112 cluster members only. The separation in three clumps by using one–dimensional KMM test and the visual inspection of Dressler–Schectman map of Fig. 7 represent only two tentative approaches (cf. Sects. 4.3 and 4.5).
A further step in the detection of possible subclumps is achieved by using the two–dimensional complete sample of all colour–selected cluster members. In fact, several clumps appear well aligned in the SE–NW direction, and, in particular, the main clump revealed by faint galaxies (R mag) coincides with the secondary X–ray peak as found in our analysis of Chandra data (cf. also Rizza et al. riz98 (1998)). This result suggests that one or several minor clumps are merging along the SE–NW direction, with a main clump hosting the cD galaxy. In particular, the presence of a significant velocity gradient suggests that the merging plane is not parallel to the plane of the sky.
The presence of a secondary clump as a well distinct unit in X–ray data suggests that this clump and maybe the whole cluster might be in a pre–merger phase.
The strong luminosity segregation found for colour–selected galaxies could however suggests a possible alternative dynamical scenario. In fact, very appealingly, galaxies of different luminosity could trace the dynamics of cluster mergers in a different way. A first evidence was given by Biviano et al. (biv96 (1996)): they found that the two central dominant galaxies of the Coma cluster are surrounded by luminous galaxies, accompanied by the two main X–ray peaks, while the distribution of faint galaxies tend to form a structure not centered with one of the two dominant galaxies, but rather coincident with a secondary peak detected in X–ray. The observational scenario of ABCG 209 has some similarities with the situation of Coma: bright galaxies (R mag) are concentrated around the cD galaxy, which coincides with the primary X–ray peak, while faint galaxies (R mag) show several peaks, the main of which, Eastern with respect the cD galaxy, is confirmed by the position of the secondary X–ray peak. Therefore, following Biviano et al., we might speculate that the merging is in an advanced phase, where faint galaxies trace the forming structure of the cluster, while more luminous galaxies still trace the remnant of the core–halo structure of a pre–merging clump, which could be so dense to survive for a long time after the merging (as suggested by numerical simulations González–Casado et al. gon94 (1994)). An extended Radio–emission would support an advanced merging phase, but its presence is still uncertain due to the existence of strong discrete sources (Giovannini et al. gio99 (1999)). The comparison of present Radio–image with our galaxy distribution shows that the diffuse source is located around the central cD galaxy with an extension toward North.
Unfortunately, redshift data are available only for luminous galaxies and we cannot investigate the nature of subclumps inferred from the two–dimensional distribution of faint galaxies. At the same time, available X–ray data are not deep enough to look for possible variations of temperature in the region of interest.
7 Summary
In order to study the internal dynamics of the rich galaxy cluster ABCG 209, we obtained spectra for 159 objects in the cluster region based on MOS observations carried out at the ESO New Technology Telescope. Out of these spectra, we analysed 119 galaxies: 112 turn out to be cluster members, 1 is foreground and 6 are background galaxies.
ABCG 209 appears as a well isolated peak in the redshift distribution centered at , characterized by a very high value of the LOS velocity dispersion: – km s-1, that results in a virial mass of –within Rvir. The analysis of the velocity dispersion profile show that such high value of is already reached in the central cluster region (–0.3 Mpc).
The main results of the present study may be summarised as follows.
-
•
ABCG 209 is characterised by a preferential SE–NW direction as indicated by: a) the presence of a velocity gradient in the velocity field; b) the elongation in the spatial distribution of colour–selected likely cluster members; c) the elongation of the X–ray contour levels in the Chandra image; d) the elongation of the cD galaxy.
-
•
We find significant deviations of velocity distribution from Gaussian.
-
•
Red and blue members are spatially and kinematically segregated.
-
•
There is significant evidence of substructure, as shown by the Dressler & Schectman test.
-
•
The two–dimensional distribution of the colour–selected likely members shows a strong luminosity segregation: bright galaxies are centered around the cD galaxy, while faint galaxies show some clumps. The main one, Eastern with respect to the cD galaxy, is well coincident with the secondary X–ray peak.
This observational scenario suggests that ABCG 209 is presently undergoing strong dynamical evolution. Present results suggest the merging of two or more subclumps along the SE–NW direction in a plane which is not parallel to the plane of sky, but cannot discriminate between two alternative pictures. The merging might be in a very early dynamical status, where clumps are still in the pre–merging phase, or in a more advanced status, where luminous galaxies trace the remnant of the core–halo structure of a pre–merging clump hosting the cD galaxy.
The connection between the dynamics and the properties of galaxy populations will be discussed in a forthcoming paper.
Acknowledgements.
We thank Rafael Barrena, Andrea Biviano, Francesco La Barbera, Michele Massarotti and Massimo Ramella, for useful discussions and suggestions. We thank the anonymous referee for useful remarks and comments. A. M. thanks Massimo Capaccioli for the hospitality at the Osservatorio Astronomico di Capodimonte and Francesca Matteucci for support during this work. This research has made use of the NASA/IPAC extragalactic Database (NED), which is operated by the Jet Propulsion Laboratory, California Institute of Technology, under contract to the National Aeronautics and Space Administration. the X–ray data used in this work have been obtained from the Chandra data archive at the NASA Chandra X–ray center. This work has been partially supported by the Italian Ministry of Education, University, and Research (MIUR) grant COFIN2001028932: Clusters and groups of galaxies, the interplay of dark and baryonic matter, and by the Italian Space Agency (ASI).References
- (1) Abell, G. O., Corwin, H. G. Jr., & Olowin, R. P. 1989, ApJs, 70, 1
- (2) Ashman, K. M., Bird, C. M., & Zepf, S. E. 1994, AJ, 108,2348
- (3) Athreya, R. M., Mellier, Y., van Waerbeke, L., et al. 2002, A&A, 384, 743
- (4) Baier, F. W., & Ziener, R. 1977, Astron. Nachr., 298, 87
- (5) Bardelli, S., Zucca, E., Vettolani, G., et al. 1994, MNRAS, 267, 665
- (6) Beers, T.C., Flynn, K., & Gebhardt, K. 1990, AJ, 100, 32
- (7) Beers, T. C., Forman, W., Huchra, J. P., Jones, C., & Gebhardt, K. 1991, AJ, 102, 1581
- (8) Bertin, E., & Arnouts, S. 1996, A&AS, 117, 393 Gebhardt, K. 1991, AJ, 102, 1581
- (9) Binggelli, B. 1982, A&A, 107, 338
- (10) Bird, C. M., & Beers, T. C. 1993, AJ, 105, 1596
- (11) Biviano, A., Durret, F., Gerbal, D., et al. 1996, A&A, 311, 95.
- (12) Brunetti, G., Setti, G., Feretti, L., & Giovannini, G. 2001, MNRAS, 320, 365
- (13) Bruzendorf, J., & Meusinger, H. 1999, A&ASS, 139, 141
- (14) Buote, D. A. 2002, in “Merging Processes in Galaxy Clusters ”, eds. L. Feretti, I. M. Gioia, & G. Giovannini, Kluwer Ac. Pub., The Netherlands, Vol. 272, p. 79–107
- (15) Carlberg, R. G., Yee, H. K. C., Ellingson, E., et al. 1996, ApJ, 462, 32
- (16) Carlberg, R. G., Yee, H. K. C., Ellingson, E., et al. 1997, ApJ, 476, L7
- (17) Cen, R., & Ostriker, J. P. 1994, ApJ, 429, 4
- (18) Colberg, J. M., White, S. D. M., Macfarland, T. J. et al. 1998, in Wide Field Surveys in Cosmology (Edition Frontiers), p. 247
- (19) Colberg, J. M., White, S. D. M., Jenkins, A., & Pearce, F. R. 1999, MNRAS, 308, 593
- (20) Czoske O., Moore, B., Kneib, J. P.& Soucail, G. 2002, A&A, 386, 31
- (21) Dahle, H., Kaiser, N. Irgens, R. J., Lilje, P. B., & Maddox, S. J. 2002, ApJS, 139, 313
- (22) Danese, L., De Zotti, C., & di Tullio, G. 1980, A&A, 82, 322
- (23) Dantas, C. C., de Carvalho, R. R., Capelato, H. V., & Mazure, A. 1997, ApJ, 485, 447
- (24) den Hartog, R., & Katgert, P. 1996, MNRAS, 279, 349
- (25) Dickey, J. M., & Lockman, F. J. 1990, A&AR, 28, 215
- (26) Dressler, A., & Shectman, S.A. 1988, AJ, 95, 985
- (27) Durret, F., Forman, W., Gerbal, D., Jones, C., & Vikhlinin, A. 1998, A&A, 335, 41
- (28) Ebeling, H., Voges, W., Böhringer, H., et al. 1996, MNRAS, 281, 799
- (29) Fadda, D., Girardi, M., Giuricin, G., Mardirossian, F., & Mezzetti, M. 1996, ApJ, 473, 670
- (30) Fasano, G., & Franceschini, A. 1987, MNRAS, 225, 155
- (31) Feretti, L. 2000, ASP Conf. Series, preprint astro-ph/0006379
- (32) Fetisova, T. S. 1981, Astron. Zh., 58, 1137
- (33) Gebhardt, K., & Beers, T. C. 1991, ApJ, 383, 72
- (34) Geller, M. J., & Beers, T. C. 1982, PASP, 94, 421
- (35) Giovannini, G., Tordi, M., & Feretti, L. 1999, New Astronomy, 4, 141
- (36) Girardi, M., Fadda, D., Giuricin, G., Mardirossian, F., Mezzetti, M., & Biviano, A. 1996, ApJ, 457, 61
- (37) Girardi, M., Escalera, E., Fadda, D. et al. 1997, ApJ, 482, 41
- (38) Girardi, M., & Mezzetti, M., 2001, ApJ, 548, 79
- (39) Girardi, M., & Biviano, A. 2002, in “Merging Processes in Galaxy Clusters”, eds. L. Feretti, I. M. Gioia, & G. Giovannini, Kluwer Ac. Pub., Vol. 272, p. 39-77
- (40) González–Casado, G., Mamon, G., & Salvador–Solé, E. 1994, ApJ, 433, L61
- (41) Johnstone, R. M., Naylor, T., & Fabian, A. C. 1991, MNRAS, 248, 18
- (42) Jones, C., & Forman, W. 1999, ApJ, 511, 65
- (43) Katz, N., & White, S. D. M. 1993, ApJ, 412, 455
- (44) Kennicutt, R. C. 1992, ApJS, 79, 225
- (45) Kittler, J. 1976, Pattern Recognition, 8, 23
- (46) Kristian, J., Sandage, A., & Westphal, J. A. 1978 ApJ, 221, 383
- (47) Kron, R. G. 1980, ApJS, 43, 305
- (48) La Barbera, F., Busarello, G., Massarotti, M., Merluzzi, P., & Mercurio A. 2002, A&A, in preparation
- (49) Lacey, C., & Cole, S. 1994, MNRAS
- (50) Malumuth, E. M., Kriss, G. A., Van Dyke Dixon, W., Ferguson, H. C., & Ritchie, C. 1992, AJ, 104, 495
- (51) Mazure, A., Katgert, P., den Hartog, P., et al. 1996, A&A, 310, 31
- (52) Mercurio, A., Massarotti, M., Merluzzi, P., Girardi, M., Busarello, G., & La Barbera, F. 2002, A&A in preparation
- (53) NAG Fortran Workstation Handbook, 1986 (Downers Grove, IL: Numerical Algorithms Group)
- (54) Pisani, A. 1993, MNRAS, 265, 706
- (55) Pisani, A. 1996, MNRAS, 278, 697
- (56) Praton, E. A., & Schneider, S. E. 1994, ApJ, 422, 46
- (57) Press, W. H., Teukolsky, S. A., Vetterling, W. T., & Flannery, B. P. 1992, in Numerical Recipes (Second Edition), (Cambridge University Press)
- (58) Quintana, H., Carrasco, E. R., & Reisenegger, A. 2000 AJ, 120, 511
- (59) Richstone, D., Loeb, A., & Turner, E. L. 1992, ApJ, 393, 477
- (60) Rizza, E., Burns, J. O., Ledlow, M. J., et al. 1998, MNRAS, 301, 328
- (61) Roettiger, K., Loken, C., & Burns, J. O. 1997, ApJS, 109, 307
- (62) Rosenberger, J. L., & Gasko, M. 1983, in Understanding Robust and Exploratory Data analysis (Wiley, New York), p.297
- (63) Shapiro, S. S., & Wilk, M. B. 1965, Biometrika, 52, 591
- (64) Thomas, P. A., Colberg, J. M., Couchman, H. M. P. et al. 1998, MNRAS, 296, 1061
- (65) Tonry, J., & Davis, M. 1981, ApJ, 1511
- (66) West, M. J., Villumsen, J. V., & Dekel, A. 1991, ApJ, 369, 287
- (67) West, M. J. 1994, in Clusters of Galaxies, eds. F.Durret, A.Mazure, and J.Tran Thanh Van, p.23
- (68) Wilkinson, A., & Oke, J. B. 1978, ApJ, 220, 376
- (69) Wu, X.-P., Xue, Y.-J., Fang, L.-Z. 1999, ApJ, 524, 22
-
a
Background galaxy.
-
b
Foreground galaxy.