Heavy elements in Galactic and Magellanic Cloud H ii regions: recombination-line versus forbidden-line abundances
Abstract
We have obtained deep optical, long-slit spectrophotometry of the Galactic H ii regions M 17, NGC 3576 and of the Magellanic Cloud H ii regions 30 Doradus, LMC N11B and SMC N66, recording the optical recombination lines (ORLs) of C ii, N ii and O ii. A spatial analysis of 30 Doradus is performed, revealing that the forbidden-line [O iii] electron temperature is remarkably constant across the nebula. The forbidden-line O2+/H+ abundance mapped by the [O iii] 4959 collisionally excited line (CEL) is shown to be consistently lower than the recombination-line abundance mapped by the O ii V 1 multiplet at 4650 Å. In addition, the spatial profile of the C2+/O2+ ratio derived purely from recombination lines is presented for the first time for an extragalactic nebula. Temperature-insensitive ORL C2+/O2+ and N2+/O2+ ratios are obtained for all nebulae except SMC N66. The ORL C2+/O2+ ratios show remarkable agreement within each galactic system, while also being in agreement with the corresponding CEL ratios. The disagreement found between the ORL and CEL N2+/O2+ ratios for M 17 and NGC 3576 can be attributed to the N ii V 3 and V 5 ORLs that were used being affected by fluorescent excitation effects.
For all five nebulae, the O2+/H+ abundance derived from multiple O ii ORLs is found to be higher than the corresponding value derived from the strong [O iii] 4959, 5007 CELs, by factors of 1.8–2.7 for four of the nebulae. The LMC N11B nebula exhibits a more extreme discrepancy factor for the O2+ ion, 5. Thus these H ii regions exhibit ORL/CEL abundance discrepancy factors that are similar to those previously encountered amongst planetary nebulae.
Our optical CEL O2+/H+ abundances agree to within 20-30 per cent
with published O2+/H+ abundances that were obtained from
observations of infrared fine-structure lines. Since the low excitation
energies of the latter make them insensitive to variations about typical
nebular temperatures, fluctuations in temperature are ruled out
as the cause of the observed ORL/CEL O2+ abundance discrepancies. We
present evidence that the observed O ii ORLs from these H ii regions
originate from gas of very similar density ( 3500 cm-3) to that
emitting the observed
heavy-element optical and infrared CELs, ruling out models that employ
high-density ionized inclusions in order to explain the abundance
discrepancy. We consider a scenario whereby much of the heavy-element ORL
emission originates from cold ( 500 K) metal-rich ionized regions.
These might constitute halos that are being evaporated from much denser
neutral cores. The origin of these metal-rich inclusions is not clear –
they may have been ejected into the nebula by evolved, massive Of and
Wolf-Rayet stars, although the agreement found between heavy element ion
ratios derived from ORLs with the ratios derived from CELs provides no
evidence for nuclear-processed material in the ORL-emitting regions.
Key Words: ISM: abundances – H ii regions: general – stars:individual R 139, R 140, P 3157
1 Introduction
In recent years deep spectroscopic studies, coupled with new theoretical results in atomic physics, have cast new light on a well established field of modern astrophysics: the study of elemental abundances in H ii regions (ionized gas clouds marking the birthplaces of stars within the galaxy and in external galaxies) and planetary nebulae (PNe; ionized ejected envelopes of evolved low- to intermediate-mass stars). On the one hand, an accurate knowledge of abundances in galactic and extragalactic H ii regions is of paramount importance for constraining galactic chemical evolution models (e.g. Shields 2002). On the other hand, abundance studies of PNe provide useful constraints on nucleosynthetic theories and our understanding of the late stages of stellar evolution (Kingsburgh & Barlow 1994; Henry, Kwitter & Bates 2000). Nebular abundances of heavy elements such as C, N, O and Ne, relative to H, have traditionally been derived from observations of strong, and thus easy to measure, collisionally-excited ionic lines (CELs); e.g. C iii] 1906, 1909 [N ii] 6548, 6584, [O iii] 4959, 5007 and [Ne iii] 3869, 3967. However, the analysis of observations of weak heavy-element optical recombination lines (ORLs) from PNe, including publications by Peimbert, Storey & Torres-Peimbert (1993), Liu et al. (1995a; 2000; 2001b), Luo, Liu & Barlow (2001), Garnett & Dinerstein (2001), and the recent work of Tsamis et al. (2002a for observations and CEL analysis; 2002b for ORL analysis), have yielded CNONe abundances for PNe that are systematically higher than those derived using the standard CEL method. The most promising explanation for these results, at least for PNe, posits the existence within nebulae of a hitherto unknown, low-temperature component enhanced in heavy elements and emitting mostly in ORLs, intermingled with a hot component of more normal composition from which the CEL emission originates (Liu et al. 2000; Liu 2002a,b; Péquignot et al. 2002a, b). The exact nature and origin of the putative ORL-emitting component is currently a matter of intense debate.
The ORL results for PNe become a matter of concern for nebular abundance studies, all the more so because nebular CEL abundances have been long plagued by lingering doubts about their reliability, arising from their exponential sensitivity to the adopted nebular electron temperature and their dependence on the adopted nebular electron density (for lines of low critical density, ; Rubin 1989). On the other hand, elemental abundances relative to hydrogen derived from ratios of ORLs [e.g. from the (C ii 4267)/(H) intensity ratio for the derivation of C2+/H+, as opposed to using the CEL/ORL (1908)/(H) ratio] are nearly independent of both the adopted temperature and density; this means that abundance determinations employing ORLs should be more accurate than those using CELs, since in real nebulae much of the emission of CELs can be biased towards regions of high electron temperature, as well as towards regions having electron densities less than the critical density of the CEL. As a result, ORL abundance studies of ionized nebulae are now coming to the fore, thanks also to rapid progress in detector technology.
To date, deep abundance studies of PNe (summarised by Liu 2002b) have yielded ORL abundances for C, N, O and Ne which, for the majority (90–95%) of nebulae, are typically a factor of 2–3 larger than those obtained from UV, optical or infrared CELs. For the remaining 5-10% of PNe, even larger discrepancy factors (5–80) are found between the heavy element abundances derived from ORLs and CELs. The situation for H ii regions is less clear thus far than for PNe, mainly on account of the small number of H ii regions so far observed specifically for the purpose of detecting heavy element ORLs and deriving abundances from them. Peimbert et al. (1993) found ORL O2+/H+ abundances for M 42 and M 17 that were a factor of two larger than those found from the [O iii] optical CELs, while Esteban et al. (1998, 1999) found ORL O2+ abundances that were larger than the CEL values by a factor of 1.5 for M 42 and a factor of two for M 8. Clearly, if H ii regions are generally found to yield heavy element abundances from ORLs that exceed those from CELs by similar factors to those summarised above for PNe and for M 8, M 17 and M 42, then this could have serious implications for our understanding of the chemical evolution of galaxies, which to date has relied to a large extent on CEL abundance analyses of H ii regions located in our own and other galaxies. The current contribution aims to increase the number of H ii regions with ORL abundance analyses, by presenting deep, medium-resolution, long-slit optical spectrophotometry of the bright Galactic H ii regions M 17 and NGC 3576, and the Magellanic Cloud H ii regions 30 Doradus, LMC N11B and SMC N66. These nebulae were selected to be of relatively high excitation for H ii regions, with O2+ being the dominant ion stage of oxygen. In Section 2 we describe our optical spectroscopic observations and present a thorough list of emission line fluxes and dereddened intensities. In Section 3 we describe the extinction corrections and the plasma temperature and density analysis. In Section 4 we present an abundance analysis using optical collisionally excited lines. In Section 5 we present an abundance study using optical recombination lines, discussing the relative intensities of O ii ORLs and complications arising from the presence of bright dust-scattered starlight within the nebulae. In Section 6 high-resolution long-slit spectra of 30 Doradus are used to map the electron temperature and density, and the ionic abundances across the nebular surface. Finally, we discuss the implications of the results from this extensive study in Section 7 and state our conclusions in Section 8.
| H ii region | Date | -range | FWHM | PA | RA | DEC | Exp. |
| (UT) | (Å) | (Å) | (deg) | (2000) | (2000) | (sec) | |
| ESO 1.52-m | |||||||
| M 17 | 07/7/96 | 3995–4978 | 1.5 | 21 | 18 20 40.0 | 16 09 29 | 31200 |
| M 17 | 13/7/96 | 3535–7400 | 4.5 | 21 | ” | ” | 60, 300, 600 |
| NGC 3576 | 11/2/97 | 3995–4978 | 1.5 | 50 | 11 11 56.9 | 61 17 25 | 61800 |
| AAT 3.9-m | |||||||
| NGC 3576 | 08/02/95 | 3509–3908 | 1 | 50 | 11 12 00.5 | 61 18 24 | 300, 1800 |
| NGC 3576 | ” | 3908–4305 | 1 | 50 | ” | ” | 21800 |
| NGC 3576 | ” | 3635–7360 | 8.5 | 50 | ” | ” | 120, 300, 600 |
| NTT 3.5-m | |||||||
| 30 Doradus | 15/12/95 | 3635–4145 | 2 | 76 | 05 38 45.6 | 69 05 24 | 31200 |
| 30 Doradus | ” | 4060–4520 | 2 | 76 | ” | ” | 31200 |
| 30 Doradus | ” | 4515–4975 | 2 | 76 | ” | ” | 300, 41200 |
| 30 Doradus | ” | 6507–7828 | 3.8 | 76 | ” | ” | 31200 |
| 30 Doradus | ” | 3800–8400 | 11 | 76 | ” | ” | 60, 300, 600 |
| LMC N11B | 16/12/95 | 3635–4145 | 2 | 57 | 04 56 47.0 | 66 25 11 | 600 |
| LMC N11B | ” | 4060–4520 | 2 | 57 | ” | ” | 21800 |
| LMC N11B | ” | 4515–4975 | 2 | 57 | ” | ” | 21800 |
| LMC N11B | ” | 6507–7828 | 3.8 | 57 | ” | ” | 600 |
| LMC N11B | ” | 3800–8400 | 11 | 57 | ” | ” | 600 |
| SMC N66 | 16/12/95 | 3635–4145 | 2 | 57 | 00 58 55.2 | 72 12 32 | 600 |
| SMC N66 | ” | 4060–4520 | 2 | 57 | ” | ” | 21800 |
| SMC N66 | ” | 4515–4975 | 2 | 57 | ” | ” | 21800 |
| SMC N66 | ” | 6507–7828 | 3.8 | 57 | ” | ” | 600 |
| SMC N66 | ” | 3800–8400 | 11 | 57 | ” | ” | 300, 600 |
2 Observations and data reduction
The observational dataset consists of long-slit spectra obtained during runs at the European Southern Observatory (ESO) using the 1.52-m telescope and the 3.5-m New Technology Telescope (NTT). Additional long-slit spectroscopy for one target was performed at the 3.9-m Anglo-Australian Telescope (AAT). The journal of observations is presented in Table 1.
The Galactic H ii regions M 17 and NGC 3576 were observed at ESO with the B&C spectrograph on the 1.52-m telescope. The detector was a Loral , 15m 15m CCD in July 1996 and in February 1997. A 2 arcsec wide, 3.5 arcmin long slit was employed. The CCDs were binned by a factor of two along the slit direction, in order to reduce the read-out noise. The spatial sampling was 1.63 arcsec per pixel projected on the sky. Two wavelength regions of M 17 were observed in July 1996: a 2400 lines mm-1 holographic grating was used in first order to cover the 3995–4978 Å range at a spectral resolution of 1.5 Å (FWHM); a second grating in first order, along with a WG345 order sorting filter, was used to cover the 3535–7400 Å range at a resolution of 4.5 Å. The shortest integration time was chosen so as to ensure that strong emission lines like H and [O iii] 4959, 5007 would not be saturated. NGC 3576 was observed in February 1997, in the 3995–4978 Å range only, at a resolution of 1.5 Å. Additional spectra of NGC 3576 were taken at the AAT with the RGO spectrograph and a TEK , 24m 24m CCD. A 1200 lines mm-1 grating was used in second order with two settings to cover the 3509–3908, 3908–4305 Å ranges, at a resolution of 1 Å, while a 250 lines mm-1 grating was used to cover the 3655–7360 Å range in first order at a resolution of 8.5 Å. The CCD was again binned by a factor of two along the slit direction, yielding a plate scale of 1.54 arcsec per pixel.
The Magellanic Cloud H ii regions 30 Doradus, LMC N11B and SMC N66 were observed with the NTT 3.5-m telescope in December 1995. The ESO Multi Mode Instrument was used in the following modes: red imaging and low dispersion grism spectroscopy (RILD) and dichroic medium dispersion spectroscopy (DIMD). The detector was a TEK , 24m 24m CCD (no. 31), used for blue-arm DIMD observations, and a TEK , 24m 24m CCD (no. 36), used for red-arm DIMD and RILD observations. Both cameras were in use when observing in DIMD mode. In this case, a dichroic prism was inserted into the beam path so that light was directed to the blue and red grating units in synchronization, allowing simultaneous exposures to be obtained in the blue and red part of the optical spectrum. For all exposures, both CCDs were binned by a factor of two in both directions. The spatial sampling was thus 0.74 and 0.54 arcsec per pixel projected on the sky, for CCDs no. 31 and no. 36, respectively. Five wavelength regions were observed with two different gratings (#3, #7) and a grism (#3), yielding spectral resolutions of approximately 2 Å (3635–4145, 4060–4520, 4515–4975), 3.8 Å (6507–7828), and 11 Å FWHM (3800–8400), respectively. An OG530 filter was used when observing in DIMD mode. The slits used were 5.6 arcmin long and 1.0 and 1.5 arcsec wide. Relevant exposure times, position angles and target coordinates are listed in Table 1.
The two-dimensional spectra were reduced with the midas software package, following standard procedures. They were bias-subtracted, flat-fielded via division by normalized flat field frames, cosmic-ray cleaned, and then wavelength calibrated using exposures of He-Ar, Th-Ar and Cu-Ar calibration lamps. During the 1995 and 1997 runs, twilight sky flat-fields were also obtained, in order to correct the small variations in illumination along the slit. The ESO 1.52-m spectra were reduced to absolute intensity units using wide-slit (8 arcsec) observations of the HST standard stars Feige 110 and the nucleus of the planetary nebula NGC 7293 (Walsh 1993), as well as the CTIO standards LTT 4364 and LTT 6248 (Hamuy et al. 1994). All NTT spectra were flux-calibrated using wide-slit (5 arcsec) observations of Feige 110. The AAT spectra were flux-calibrated using observations of the standard star LTT 3218. In all cases, flux-calibration was done using the iraf software package. Sky-subtraction was not attempted since in no case could any nebular emission-free windows be extracted from the long-slit CCD frames.
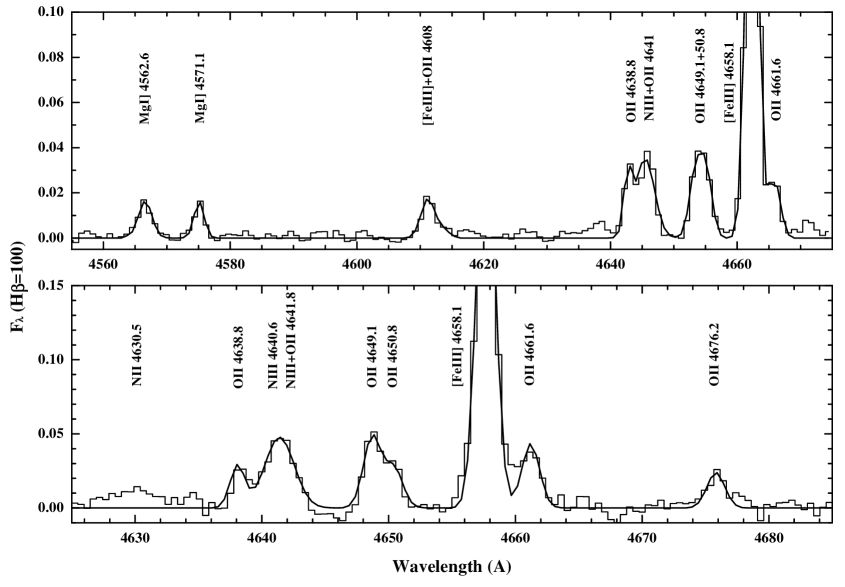
Most of the line fluxes – and certainly all those of heavy element recombination lines – were derived using Gaussian line profile fitting techniques, apart from the strongest ones, for which their fluxes were measured by simply integrating over the line profiles. In order to deconvolve features affected by blending, multiple Gaussian fitting was employed. In such cases a successful estimate of the continuum emission level was deemed to be an important first step. After subtracting the local continuum, line fluxes were retrieved by fitting multiple Gaussians of appropriate central wavelength and usually equal FWHM. The FWHM was taken to be the same as that of nearby unblended lines of similar strength to the ones fitted. Their relative wavelength spacings were constrained to be the same as those from laboratory wavelengths. This procedure assured accurate flux retrieval and aided line identification in the case of ambiguous features. In Fig. 1 we present high-resolution, continuum-subtracted spectra of 30 Doradus and NGC 3576 covering the spectral region around the O ii V 1 multiplet at 4650 Å, along with multiple Gaussian fits to the observed emission lines.
A complete list of observed emission lines and their fluxes for all nebulae can be found in Table 2. All fluxes are on a scale where (H) = 100, with the dereddened flux given by,
The amount of interstellar extinction is given by c(H) which is the logarithm of the ratio of the dereddened and observed H fluxes, while f() is the adopted extinction curve in each case (see below) normalized such that f(H) = 0. A ratio of total to selective extinction, = = 3.1 was assumed. All dereddened line intensities quoted in the remainder of this paper are on a scale where (H) = 100.
| M 17 | |||||
|---|---|---|---|---|---|
| ID | Mult | ||||
| * | * | * | H 14 | 3721.94 | H14 |
| * | * | [S III] | 3721.63 | F2 | |
| 3726.99 | 3.11(1) | 9.24(1) | [O II] | 3726.03 | F1 |
| * | * | [O II] | 3728.82 | F1 | |
| 3749.86 | 1.13 | 3.32 | H 12 | 3750.15 | H12 |
| 3770.34 | 1.31 | 3.78 | H 11 | 3770.63 | H11 |
| 3797.30 | 1.61 | 4.53 | H 10 | 3797.90 | H10 |
| 3819.01 | 4.13(1) | 1.14 | He I | 3819.62 | V22 |
| 3834.78 | 2.41 | 6.59 | H 9 | 3835.39 | H9 |
| 3868.84 | 6.91 | 1.83(1) | [Ne III] | 3868.75 | F1 |
| 3889.14 | 6.23 | 1.62(1) | He I | 3888.65 | V2 |
| 3967.56 | 8.24 | 2.01(1) | [Ne III] | 3967.46 | F1 |
| 4009.31 | 1.26(1) | 2.97(1) | He I | 4009.26 | V55 |
| 4026.29 | 9.73(1) | 2.25 | He I | 4026.21 | V18 |
| 4069.00 | 2.60(1) | 5.79(1) | [S II] | 4068.60 | F1 |
| 4076.23 | 7.05(2) | 1.56(1) | [S II] | 4076.35 | F1 |
| 4101.76 | 1.19(1) | 2.57(1) | H 6 | 4101.74 | H6 |
| 4119.71 | 5.44(2) | 1.15(1) | O II | 4119.22 | V20 |
| 4121.33 | 9.00(2) | 1.91(1) | He I | 4120.84 | V16 |
| 4143.87 | 1.35(1) | 2.80(1) | He I | 4143.76 | V53 |
| 4267.19 | 2.61(1) | 4.81(1) | C II | 4267.15 | V6 |
| 4317.27 | 6.36(2) | 1.12(1) | O II | 4317.14 | V2 |
| 4319.48 | 1.89(2) | 3.30(2) | O II | 4319.63 | V2 |
| 4340.43 | 2.79(1) | 4.77(1) | H 5 | 4340.47 | H5 |
| 3.93(2) | 6.70(2) | O II | 4345.56 | V2 | |
| 4349.01 | 6.30(2) | 1.07(1) | O II | 4349.43 | V2 |
| 4363.22 | 6.11(1) | 1.02 | [O III] | 4363.21 | F2 |
| 4388.02 | 4.06(1) | 6.63(1) | He I | 4387.93 | V51 |
| 4437.83 | 5.37(2) | 8.33(2) | He I | 4437.55 | V50 |
| 4471.49 | 3.28 | 4.91 | He I | 4471.50 | V14 |
| 4607.46 | 4.56(2) | 5.95(2) | N II | 4607.16 | V5 |
| 4630.76 | 5.22(2) | 6.02(2) | N II | 4630.54 | V5 |
| 4634.26 | 3.42(2) | 4.34(2) | N III | 4634.14 | V2 |
| 4638.98 | 8.36(2) | 1.06(1) | O II | 4638.49 | V1 |
| 4640.76 | 2.77(2) | 3.48(2) | N III | 4640.64 | V2 |
| 4641.93 | 1.28(1) | 1.52(1) | O II | 4641.44 | V1 |
| 4649.38 | 1.10(1) | 1.38(1) | O II | 4649.13 | V1 |
| 4651.09 | 6.99(2) | 8.71(2) | O II | 4650.84 | V1 |
| 4658.49 | 2.25(1) | 2.79(1) | [Fe III] | 4658.10 | F3 |
| 4662.02 | 8.47(2) | 1.04(1) | O II | 4661.63 | V1 |
| 4676.91 | 5.19(2) | 6.30(2) | O II | 4676.24 | V1 |
| 4711.60 | 7.01(2) | 8.20(2) | [Ar IV] | 4711.37 | F1 |
| 4713.40 | 4.51(1) | 5.26(1) | He I | 4713.17 | V12 |
| 4740.37 | 6.20(2) | 7.04(2) | [Ar IV] | 4740.17 | F1 |
| 4803.20 | 2.85(2) | 3.04(2) | N II | 4803.29 | V20 |
| 4861.55 | 1.00(2) | 1.00(2) | H 4 | 4861.33 | H4 |
| 4881.20 | 1.04(1) | 1.02(1) | [Fe III] | 4881.11 | F2 |
| 4906.87 | 5.42(2) | 5.17(2) | O II | 4906.83 | V28 |
| 4922.27 | 1.42 | 1.34 | He I | 4921.93 | V48 |
| 4931.47 | 4.49(2) | 4.18(2) | [O III] | 4931.80 | F1 |
| 4959.13 | 1.30(2) | 1.17(2) | [O III] | 4958.91 | F1 |
| 5006.43 | 4.13(2) | 3.55(2) | [O III] | 5006.84 | F1 |
| 5198.36 | 4.04(1) | 2.84(1) | [N I] | 5199.84 | F1 |
| 5517.48 | 8.73(1) | 4.54(1) | [Cl III] | 5517.66 | F1 |
| 5537.71 | 7.75(1) | 3.97(1) | [Cl III] | 5537.60 | F1 |
| 5666.60 | 1.23(1) | 5.70(2) | N II | 5666.53 | V3 |
| 5676.11 | 3.68(2) | 1.70(2) | N II | 5676.02 | V3 |
| 5679.62 | 1.18() | 5.44(2) | N II | 5679.56 | V3 |
| 5754.74 | 7.40(1) | 3.24(1) | [N II] | 5754.60 | F3 |
| 5875.44 | 3.61(1) | 1.45(1) | He I | 5875.66 | V11 |
| 6312.09 | 4.77 | 1.43 | [S III] | 6312.10 | F3 |
| 6548.71 | 3.52(1) | 9.15 | [N II] | 6548.10 | F1 |
| 6563.11 | 1.17(3) | 3.01(2) | H 3 | 6562.77 | H3 |
| M 17 | |||||
|---|---|---|---|---|---|
| ID | Mult | ||||
| 6583.91 | 1.08(2) | 2.74(1) | [N II] | 6583.50 | F1 |
| 6678.59 | 1.62(1) | 3.89 | He I | 6678.16 | V46 |
| 6717.02 | 1.72(1) | 4.04 | [S II] | 6716.44 | F2 |
| 6731.39 | 1.76(1) | 4.11 | [S II] | 6730.82 | F2 |
| 7065.48 | 1.81(1) | 3.51 | He I | 7065.25 | V10 |
| 7135.90 | 5.74(1) | 1.07(1) | [Ar III] | 7135.80 | F1 |
| 7280.02 | 5.49 | 9.50(1) | He I | 7281.35 | V45 |
| 7319.06 | 6.61 | 1.12 | [O II] | 7318.92 | F2 |
| 7329.62 | 5.17 | 8.72(1) | [O II] | 7329.67 | F2 |
| NGC 3576 (AAT) | |||||
| ID | Mult | ||||
| 3531.25 | 3.98(1) | 9.70(1) | He I | 3530.50 | V36 |
| 3553.94 | 1.55(1) | 3.71(1) | He I | 3554.42 | V34 |
| 3566.73 | 4.25(1) | 1.00 | ? | 3566.95 | |
| 3613.22 | 2.17(1) | 4.92(1) | He I | 3613.64 | V6 |
| 3634.00 | 2.30(1) | 5.13(1) | He I | 3634.25 | V28 |
| 3671.17 | 2.34(1) | 5.13(1) | H 24 | 3671.48 | H24 |
| 3673.39 | 2.24(1) | 4.90(1) | H 23 | 3673.74 | H23 |
| 3676.01 | 2.80(1) | 6.11(1) | H 22 | 3676.36 | H22 |
| 3679.01 | 2.87(1) | 6.26(1) | H 21 | 3679.36 | H21 |
| 3682.46 | 3.17(1) | 6.92(1) | H 20 | 3682.81 | H20 |
| 3686.48 | 3.70(1) | 8.04(1) | H 19 | 3686.83 | H19 |
| 3691.21 | 4.42(1) | 9.59(1) | H 18 | 3691.56 | H18 |
| 3696.80 | 4.91(1) | 1.06 | H 17 | 3697.15 | H17 |
| 3703.50 | 6.09(1) | 1.31 | H 16 | 3703.86 | H16 |
| 3704.66 | 3.01(1) | 6.49(1) | He I | 3705.02 | V25 |
| 3711.61 | 7.40(1) | 1.58 | H 15 | 3711.97 | H15 |
| 3721.49 | 1.31 | 2.79 | H 14 | 3721.94 | H14 |
| 3725.66 | 3.52(1) | 7.51(1) | [O II] | 3726.03 | F1 |
| 3728.45 | 2.58(1) | 5.49(1) | [O II] | 3728.82 | F1 |
| 3733.99 | 1.05 | 2.23 | H 13 | 3734.37 | H13 |
| 3749.77 | 1.38 | 2.90 | H 12 | 3750.15 | H12 |
| 3770.25 | 1.80 | 3.76 | H 11 | 3770.63 | H11 |
| 3797.52 | 2.51 | 5.16 | H 10 | 3797.90 | H10 |
| 3819.21 | 5.86(1) | 1.18 | He I | 3819.62 | V22 |
| 3835.00 | 3.75 | 7.54 | H 9 | 3835.39 | H9 |
| 3855.69 | 1.22(1) | 2.44(1) | Si II | 3856.02 | V1 |
| 3862.27 | 1.43(1) | 2.83(1) | Si II | 3862.60 | V1 |
| 3868.34 | 1.04(1) | 2.06(1) | [Ne III] | 3868.75 | F1 |
| 3871.33 | 8.97(2) | 1.76(1) | He I | 3871.82 | V60 |
| 3888.64 | 8.45 | 1.64(1) | He I | 3888.65 | V2 |
| 3912.83 | 3.95(2) | 7.59(2) | ? | 3912.83 | |
| 3914.02 | 3.39(2) | 6.52(2) | ? | 3914.02 | |
| 3918.66 | 5.39(2) | 1.03(1) | C II | 3918.98 | V4 |
| 3920.37 | 4.83(2) | 9.24(2) | C II | 3920.69 | V4 |
| 3926.03 | 8.01(2) | 1.52(1) | He I | 3926.54 | V58 |
| 3964.36 | 4.81(1) | 8.97(1) | He I | 3964.73 | V5 |
| 3967.04 | 3.20 | 5.95 | [Ne III] | 3967.46 | F1 |
| 3969.70 | 8.03 | 1.49(1) | H 7 | 3970.07 | H7 |
| 4008.84 | 1.27(1) | 2.31(1) | He I | 4009.26 | V55 |
| 4025.83 | 1.11 | 2.00 | He I | 4026.21 | V18 |
| 4037.19 | 1.24(2) | 2.22(2) | ? | 4037.19 | |
| 4042.91 | 2.56(2) | 4.54(2) | ? | 4042.91 | |
| 4059.17 | 1.37(2) | 2.41(2) | ? | 4059.17 | |
| 4060.28 | 9.18(3) | 1.61(2) | [F IV] | 4060.23 | F1 |
| 4065.35 | 2.37(2) | 4.14(2) | ? | 4065.35 | |
| 4068.21 | 7.35(1) | 1.28 | [S II] | 4068.60 | F1 |
| 4069.37 | 8.08(2) | 1.41(1) | O II | 4069.62 | V10 |
| * | * | O II | 4069.89 | V10 | |
| 4071.77 | 6.93(2) | 1.21(1) | O II | 4072.16 | V10 |
| 4075.47 | 5.81(2) | 1.01(1) | O II | 4075.86 | V10 |
| 4075.96 | 2.53(1) | 4.40(1) | [S II] | 4076.35 | F1 |
| 4080.81 | 1.95(2) | 3.38(2) | ? | 4080.81 | |
| NGC 3576 (AAT) | |||||
|---|---|---|---|---|---|
| ID | Mult | ||||
| 4084.90 | 9.84(3) | 1.70(2) | O II | 4085.11 | V10 |
| 4086.93 | 2.40(2) | 4.15(2) | O II | 4087.15 | V48c |
| 4089.07 | 1.85(2) | 3.20(2) | O II | 4089.29 | V48a |
| 4096.94 | 3.79(2) | 6.50(2) | N III | 4097.33 | V1 |
| 4101.33 | 1.50(1) | 2.56(1) | H 6 | 4101.74 | H6 |
| 4118.83 | 1.61(2) | 2.71(2) | O II | 4119.22 | V20 |
| 4120.45 | 1.26(1) | 2.13(1) | He I | 4120.84 | V16 |
| 4132.64 | 3.12(2) | 5.23(2) | O II | 4132.80 | V19 |
| 4143.33 | 1.85(1) | 3.07(1) | He I | 4143.76 | V53 |
| 4152.88 | 2.18(2) | 3.61(2) | O II | 4153.30 | V19 |
| 4156.11 | 1.26(2) | 2.08(2) | O II | 4156.53 | V19 |
| 4168.62 | 4.03(2) | 6.58(2) | He I | 4168.97 | V52 |
| 4170.28 | 1.94(2) | 3.16(2) | ? | 4170.28 | |
| 4185.44 | 2.04(2) | 3.30(2) | O II | 4185.45 | V36 |
| 4189.78 | 1.95(2) | 3.14(2) | O II | 4189.79 | V36 |
| 4253.66 | 2.72(2) | 4.20(2) | O II | 4254.00 | V101 |
| 4266.73 | 2.12(1) | 3.24(1) | C II | 4267.15 | V6 |
| 4276.78 | 8.81(2) | 1.34(1) | O II | 4275.55 | V67a |
| 4287.00 | 7.39(2) | 1.11(1) | [Fe II] | 4287.40 | 7F |
| 4340.04 | 3.27(1) | 4.76(1) | H 5 | 4340.47 | H5 |
| 4345.30 | 7.48(2) | 1.08(1) | O II | 4345.56 | V2 |
| 4349.17 | 5.38(2) | 7.77(2) | O II | 4349.43 | V2 |
| 4357.14 | 5.26(2) | 7.56(2) | O II | 4357.25 | V63a |
| 4358.98 | 8.28(2) | 1.18(1) | ? | 4358.98 | |
| 4362.80 | 1.05 | 1.51 | [O III] | 4363.21 | F2 |
| 4368.06 | 7.49(2) | 1.06(1) | C II? | 4368.14 | V45 |
| 4387.49 | 3.91(1) | 5.50(1) | He I | 4387.93 | V51 |
| 4413.23 | 7.58(2) | 1.04(1) | [Fe II] | 4413.78 | 7F |
| 4471.07 | 3.66 | 4.84 | He I | 4471.50 | V14 |
| 4603.76 | 3.33(2) | 4.01(2) | ? | 4603.76 | |
| 4606.98 | 4.78(2) | 5.75(2) | N II | 4607.16 | V5 |
| 4608.66 | 4.45(2) | 5.34(2) | ? | 4608.66 | |
| 4610.02 | 4.50(2) | 5.40(2) | O II | 4610.20 | V92c |
| 4614.92 | 4.04(2) | 4.83(2) | ? | 4614.92 | |
| 4620.88 | 3.82(2) | 4.55(2) | N II | 4621.39 | V5 |
| 4638.46 | 5.89(2) | 6.92(2) | O II | 4638.86 | V1 |
| 4640.24 | 2.19(2) | 2.57(2) | N III | 4640.64 | V2 |
| 4641.42 | 9.22(2) | 1.08(1) | O II | 4641.81 | V1 |
| 4648.60 | 1.38(1) | 1.60(1) | O II | 4649.13 | V1 |
| 4650.31 | 1.31(1) | 1.52(1) | O II | 4650.84 | V1 |
| 4661.23 | 7.46(2) | 8.61(2) | O II | 4661.63 | V1 |
| 4675.84 | 5.12(2) | 5.85(2) | O II | 4676.24 | V1 |
| 4696.03 | 2.80(2) | 3.16(2) | O II | 4696.35 | V1 |
| 4701.16 | 1.92(1) | 2.16(1) | [Fe III] | 4701.62 | F3 |
| 4705.72 | 3.76(2) | 4.21(2) | O II | 4705.35 | V25 |
| 4861.50 | 1.00(2) | 1.00(2) | H 4 | 4861.33 | H4 |
| 4958.86 | 1.31(2) | 1.22(2) | [O III] | 4958.91 | F1 |
| 5006.82 | 4.12(2) | 3.71(2) | [O III] | 5006.84 | F1 |
| 5200.35 | 8.17(1) | 6.40(1) | [N I] | 5199.84 | F1 |
| 5270.91 | 4.51(1) | 3.36(1) | [Fe III] | 5270.40 | 1F |
| 5518.20 | 7.41(1) | 4.70(1) | [Cl III] | 5517.66 | F1 |
| 5538.14 | 8.49(1) | 5.33(1) | [Cl III] | 5537.60 | F1 |
| 5577.88 | 4.18 | 2.57 | [O I] | 5577.34 | F3 |
| 5666.60 | 6.00(2) | 3.58(2) | N II | 5666.53 | V3 |
| 5676.11 | 2.67(1) | 1.59(2) | N II | 5676.02 | V3 |
| 5679.60 | 1.12(1) | 6.70(2) | N II | 5679.56 | V3 |
| 5754.86 | 1.05 | 5.92(1) | [N II] | 5754.60 | F3 |
| 5875.76 | 2.59(1) | 1.38(1) | He I | 5875.66 | V11 |
| 5913.00 | 6.56(2) | 3.42(2) | ? | 5913.00 | |
| 5931.52 | 2.11(1) | 1.09(1) | N II | 5931.52 | V28 |
| 5957.35 | 2.87(1) | 1.46(1) | Si II | 5957.35 | |
| 5978.71 | 1.99(1) | 1.01(1) | Si II | 5978.71 | |
| 6548.11 | 4.03(1) | 1.58(1 | [N II] | 6548.10 | F1 |
| 6562.97 | 7.40(2) | 2.88(2) | H 3 | 6562.77 | H3 |
| NGC 3576 (AAT) | |||||
|---|---|---|---|---|---|
| ID | Mult | ||||
| 6583.66 | 1.36(2) | 5.25(1) | [N II] | 6583.50 | F1 |
| 6678.74 | 9.91 | 3.68 | He I | 6678.16 | V46 |
| 6717.02 | 1.90(1) | 6.94 | [S II] | 6716.44 | F2 |
| 6731.40 | 2.41(1) | 8.76 | [S II] | 6730.82 | F2 |
| 7065.67 | 1.70(1) | 5.45 | He I | 7065.25 | V10 |
| 7136.12 | 4.87(1) | 1.51(1) | [Ar III] | 7135.80 | F1 |
| NGC 3576 (ESO) | |||||
| ID | Mult | ||||
| 4008.73 | 1.41(1) | 2.52(1) | He I | 4009.26 | V55 |
| 4025.77 | 1.07 | 1.89 | He I | 4026.21 | V18 |
| 4068.12 | 8.95(1) | 1.54 | [S II] | 4068.60 | F1 |
| 4075.73 | 3.30(1) | 5.65(1) | [S II] | 4076.35 | F1 |
| 4101.16 | 1.50(1) | 2.53(1) | H 6 | 4101.74 | H6 |
| 4120.36 | 1.26(1) | 2.10(1) | He I | 4120.84 | V16 |
| 4143.17 | 1.04(1) | 1.71(1) | He I | 4143.76 | V53 |
| 4266.58 | 2.06(1) | 3.12(1) | C II | 4267.15 | V6 |
| 4276.29 | 4.80(2) | 7.21(2) | O II | 4275.99 | V67b |
| 4286.98 | 7.73(2) | 1.15(1) | O II | 4285.69 | V78b |
| 4316.94 | 1.23(1) | 1.80(1) | O II | 4317.14 | V2 |
| 4339.87 | 3.25(1) | 4.68(1) | H 5 | 4340.47 | H5 |
| 4349.02 | 3.38(2) | 4.84(2) | O II | 4349.43 | V2 |
| 4362.64 | 8.61(1) | 1.22 | [O III] | 4363.21 | F2 |
| 4367.45 | 8.59(2) | 1.21(1) | O II | 4366.89 | V2 |
| 4387.39 | 3.18(1) | 4.44(1) | He I | 4387.93 | V51 |
| 4412.28 | 5.20(2) | 7.13(2) | Ne II | 4413.22 | V65 |
| 4413.96 | 4.55(2) | 6.22(2) | O II | 4414.90 | V5 |
| 4416.03 | 5.81(2) | 7.94(2) | O II | 4416.97 | V5 |
| 4437.45 | 5.83(2) | 7.84(2) | He I | 4437.55 | V50 |
| 4449.91 | 2.49(2) | 3.33(2) | ? | 4449.91 | |
| 4451.61 | 4.05(2) | 5.40(2) | O II | 4452.37 | V5 |
| 4470.93 | 3.24 | 4.27 | He I | 4471.50 | V14 |
| 4630.03 | 2.34(2) | 3.09(2) | N II | 4630.54 | V5 |
| 4638.79 | 4.34(2) | 5.09(2) | O II | 4638.49 | V1 |
| 4640.57 | 3.61(2) | 4.22(2) | N III | 4640.64 | V2 |
| 4641.74 | 7.54(2) | 8.80(2) | O II | 4641.44 | V1 |
| 4648.70 | 8.00(2) | 9.29(2) | O II | 4649.13 | V1 |
| 4650.41 | 4.76(2) | 5.53(2) | O II | 4650.84 | V1 |
| 4657.68 | 5.10(1) | 5.89(1) | [Fe III] | 4658.10 | F3 |
| 4661.21 | 7.95(2) | 9.16(2) | O II | 4661.63 | V1 |
| 4675.90 | 4.91(2) | 5.60(2) | O II | 4676.24 | V1 |
| 4701.14 | 1.60(1) | 1.79(1) | [Fe III] | 4701.62 | F3 |
| 4710.98 | 7.82(2) | 8.70(2) | [Ar IV] | 4711.37 | F1 |
| 4712.78 | 4.43(1) | 4.91(1) | He I | 4713.17 | V12 |
| 4733.55 | 4.13(2) | 4.52(2) | [Fe III] | 4733.93 | |
| 4739.65 | 6.92(2) | 7.54(2) | [Ar IV] | 4740.17 | F1 |
| 4754.43 | 1.01(1) | 1.09(1) | [Fe III] | 4754.83 | |
| 4860.93 | 1.00(2) | 1.00(2) | H 4 | 4861.33 | H4 |
| 4880.75 | 2.26(1) | 2.23(1) | [Fe III] | 4881.11 | F2 |
| 4921.62 | 1.12 | 1.07 | He I | 4921.93 | V48 |
| 4924.22 | 6.68(2) | 6.39(2) | O II | 4924.53 | V28 |
| 4930.97 | 8.22(2) | 7.82(2) | [O III] | 4931.80 | F1 |
| 4958.53 | 1.25(2) | 1.17(2) | [O III] | 4958.91 | F1 |
| 30 Doradus | |||||
| ID | Mult | ||||
| 3729.15 | 3.80(1) | 5.02(1) | [O II] | 3726.03 | F1 |
| 3731.94 | 4.21(1) | 5.54(1) | [O II] | 3728.82 | F1 |
| 3753.37 | 2.69 | 3.52 | H 12 | 3750.15 | H12 |
| 3773.87 | 3.29 | 4.28 | H 11 | 3770.63 | H11 |
| 3801.17 | 4.35 | 5.61 | H 10 | 3797.90 | H10 |
| 3822.94 | 9.27(1) | 1.18 | He I | 3819.62 | V22 |
| 3838.69 | 6.48 | 8.26 | H 9 | 3835.39 | H9 |
| 3871.99 | 3.07(1) | 3.87(1) | [Ne III] | 3868.75 | F1 |
| 30 Doradus | |||||
|---|---|---|---|---|---|
| ID | Mult | ||||
| 3892.31 | 1.55(1) | 1.94(1) | He I | 3888.65 | V2 |
| 3970.79 | 9.37 | 1.14(1) | [Ne III] | 3967.46 | F1 |
| 3973.40 | 1.40(1) | 1.71(1) | H 7 | 3970.07 | H7 |
| 4072.50 | 4.71(1) | 5.61(1) | [S II] | 4068.60 | F1 |
| 4073.66 | 1.11(1) | 1.33(1) | O II | 4069.62 | V10 |
| 4076.06 | 5.73(2) | 6.83(2) | O II | 4072.16 | V10 |
| 4080.26 | 1.90(1) | 2.27(1) | [S II] | 4076.35 | F1 |
| 4082.75 | 2.73(2) | 3.24(2) | O II | 4078.84 | V10 |
| 4087.98 | 9.11(3) | 1.08(2) | O II | 4083.90 | V48b |
| 4089.20 | 2.17(2) | 2.58(2) | O II | 4085.11 | V10 |
| 4091.24 | 1.56(2) | 1.85(2) | O II | 4087.15 | V48c |
| 4093.38 | 1.77(2) | 2.10(2) | O II | 4089.29 | V48a |
| 4105.56 | 2.20(1) | 2.60(1) | H 6 | 4101.74 | H6 |
| 4114.32 | 2.74(2) | 3.22(2) | O II | 4110.78 | V20 |
| 4124.62 | 1.77(1) | 2.08(1) | He I | 4120.84 | V16 |
| 4136.45 | 4.33(2) | 5.08(2) | O II | 4132.80 | V19 |
| 4147.48 | 2.52(1) | 2.94(1) | He I | 4143.76 | V53 |
| 4156.82 | 5.22(2) | 6.09(2) | O II | 4153.30 | V19 |
| 4160.05 | 1.99(2) | 2.32(2) | O II | 4156.53 | V19 |
| 4172.75 | 5.74(2) | 6.66(2) | O II | 4169.22 | V19 |
| 4270.73 | 8.11(2) | 9.19(2) | C II | 4267.15 | V6 |
| 4279.08 | 6.94(2) | 7.85(2) | O II | 4275.55 | V67a |
| 4307.40 | 4.62(2) | 5.19(2) | O II | 4303.61 | V65a |
| 4314.99 | 2.64(2) | 2.96(2) | O II | 4312.11 | V78a |
| 4315.49 | 3.42(2) | 3.83(2) | O II | 4313.44 | V78a |
| 4317.45 | 2.46(2) | 5.33(2) | O II | 4315.40 | V63c |
| 4319.19 | 6.30(2) | 7.05(2) | O II | 4317.14 | V2 |
| 4321.68 | 7.83(2) | 8.76(2) | O II | 4319.63 | V2 |
| 4344.22 | 4.35(1) | 4.84(1) | H 5 | 4340.47 | H5 |
| 4367.00 | 3.03 | 3.35 | [O III] | 4363.21 | F2 |
| 4391.79 | 4.87(1) | 5.36(1) | He I | 4387.93 | V51 |
| 4412.55 | 2.83(2) | 3.10(2) | Ne II | 4409.30 | V55e |
| 4418.15 | 3.03(2) | 3.32(2) | O II | 4414.90 | V5 |
| 4420.23 | 3.98(2) | 4.36(2) | O II | 4416.97 | V5 |
| 4441.41 | 5.71(2) | 6.22(2) | He I | 4437.55 | V50 |
| 4475.44 | 4.03 | 4.35 | He I | 4471.50 | V14 |
| 4566.56 | 4.77(2) | 5.06(2) | Mg I] | 4562.60 | |
| 4575.32 | 5.39(2) | 5.70(2) | Mg I] | 4571.10 | |
| 4611.30 | 4.82(2) | 5.06(2) | [Fe III] | 4607.13 | 3F |
| 4613.96 | 1.99(2) | 2.09(2) | O II | 4609.44 | V92a |
| 4638.92 | 9.71(3) | 1.01(2) | N III | 4634.14 | V2 |
| 4643.03 | 6.13(2) | 6.40(2) | O II | 4638.49 | V1 |
| 4645.99 | 8.19(2) | 8.54(2) | O II | 4641.81 | V1 |
| 4653.38 | 6.16(2) | 6.42(2) | O II | 4649.13 | V1 |
| 4655.09 | 6.16(2) | 6.41(2) | O II | 4650.84 | V1 |
| 4662.27 | 6.01(1) | 6.25(1) | [Fe III] | 4658.10 | 3F |
| 4665.18 | 5.44(2) | 5.65(2) | O II | 4661.63 | V1 |
| 4671.08 | 2.26(2) | 2.35(2) | [Fe III] | 4667.00 | 3F |
| 4677.91 | 1.16(2) | 1.20(2) | O II | 4673.73 | V1 |
| 4680.42 | 2.15(2) | 2.24(2) | O II | 4676.24 | V1 |
| 4689.06 | 1.66(2) | 1.71(2) | He II | 4685.68 | 3.4 |
| 4692.90 | 1.09(2) | 1.12(2) | ? | 4692.90 | |
| 4696.27 | 1.71(2) | 1.77(2) | ? | 4696.27 | |
| 4705.74 | 1.83(1) | 1.88(1) | [Fe III] | 4701.62 | 3F |
| 4715.54 | 2.04(1) | 2.10(1) | [Ar IV] | 4711.37 | F1 |
| 4717.34 | 4.67(1) | 4.80(1) | He I | 4713.17 | V12 |
| 4738.18 | 6.17(2) | 6.31(2) | [Fe III] | 4733.93 | 3F |
| 4744.40 | 1.77(1) | 1.81(1) | [Ar IV] | 4740.17 | F1 |
| 4753.57 | 1.87(2) | 1.91(2) | ? | * | |
| 4758.89 | 1.35(1) | 1.38(1) | [Fe III] | 4754.83 | 3F |
| 4773.70 | 6.67(2) | 6.79(2) | [Fe III] | 4769.60 | 3F |
| 4781.58 | 3.16(2) | 3.21(2) | [Fe III] | 4777.88 | 3F |
| 4800.53 | 1.85(2) | 1.87(2) | ? | * | |
| 4819.44 | 3.05(2) | 3.07(2) | [Fe II] | 4814.55 | 20F |
| 30 Doradus | |||||
|---|---|---|---|---|---|
| ID | Mult | ||||
| 4865.59 | 1.00(2) | 1.00(2) | H 4 | 4861.33 | H4 |
| 4885.14 | 1.83(1) | 1.83(1) | [Fe III] | 4881.11 | 2F |
| 4893.48 | 1.72(2) | 1.71(2) | [Fe II] | 4889.63 | 4F |
| 4907.18 | 3.37(2) | 3.35(2) | [Fe IV] | 4903.50 | -F |
| 4910.38 | 3.72(2) | 3.69(2) | O II | 4906.83 | V28 |
| 4926.27 | 1.16 | 1.14 | He I | 4921.93 | V48 |
| 4935.46 | 7.03(2) | 6.94(2) | [O III] | 4931.80 | F1 |
| 4967.44 | 1.71(2) | 1.68(2) | [O III] | 4958.91 | F1 |
| 5015.56 | 5.18(2) | 5.05(2) | [O III] | 5006.84 | F1 |
| 5279.65 | 2.99(1) | 2.79(1) | [Fe II] | 5273.38 | 18F |
| 5315.59 | 1.71(1) | 1.58(1) | ? | * | |
| 5526.27 | 5.28(1) | 4.76(1) | [Cl III] | 5517.66 | F1 |
| 5546.24 | 4.10(1) | 3.69(1) | [Cl III] | 5537.60 | F1 |
| 5762.29 | 2.35(1) | 2.06(1) | [N II] | 5754.60 | F3 |
| 5883.20 | 1.48(1) | 1.27(1) | He I | 5875.66 | V11 |
| 6238.42 | 1.75(1) | 1.45(1) | [Ni III] | 6231.09 | |
| 6261.66 | 1.53(1) | 1.26(1) | [Fe II] | 6254.30 | |
| 6306.34 | 1.30 | 1.07 | [O I] | 6300.34 | F1 |
| 6318.12 | 2.37 | 1.94 | [S III] | 6312.10 | F3 |
| 6562.58 | 4.04 | 3.22 | [N II] | 6548.10 | F1 |
| 6576.15 | 3.80(2) | 3.03(2) | H 3 | 6562.77 | H3 |
| 6595.37 | 1.09(1) | 8.73 | [N II] | 6583.50 | F1 |
| 6685.50 | 4.64 | 3.65 | He I | 6678.16 | V46 |
| 6722.67 | 7.66 | 6.00 | [S II] | 6716.44 | F2 |
| 6736.74 | 6.94 | 5.43 | [S II] | 6730.82 | F2 |
| 7074.23 | 4.69 | 3.55 | He I | 7065.25 | V10 |
| 7146.92 | 1.80(1) | 1.35(1) | [Ar III] | 7135.80 | F1 |
| 7166.65 | 4.65(2) | 3.49(2) | [Fe II] | 7155.14 | 14F |
| 7247.38 | 3.26(1) | 2.43(1) | C II | 7231.32 | V3 |
| 7252.50 | 3.41(1) | 2.54(1) | C II | 7236.42 | V3 |
| 7296.23 | 9.94(1) | 7.38(1) | He I | 7281.35 | V45 |
| 7335.88 | 2.80 | 2.07 | [O II] | 7318.92 | F2 |
| 7346.65 | 2.30 | 1.70 | [O II] | 7329.67 | F2 |
| LMC N11B | |||||
| ID | Mult | ||||
| 3729.14 | 7.92(1) | 8.27(1) | [O II] | 3726.03 | F1 |
| 3731.94 | 1.05(2) | 1.10(2) | [O II] | 3728.82 | F1 |
| 3872.02 | 1.97(1) | 2.05(1) | [Ne III] | 3868.75 | F1 |
| 3892.03 | 2.15(1) | 2.23(1) | He I | 3888.65 | V2 |
| 3970.38 | 3.38 | 3.50 | [Ne III] | 3967.46 | F1 |
| 3973.23 | 1.35(1) | 1.40(1) | H 7 | 3970.07 | H7 |
| 4072.97 | 8.37(1) | 8.64(1) | [S II] | 4068.60 | F1 |
| 4074.13 | 3.07(1) | 3.17(1) | O II | 4069.62 | V10 |
| 4076.53 | 9.94(2) | 1.03(1) | O II | 4072.16 | V10 |
| 4080.73 | 4.89(1) | 5.05(1) | [S II] | 4076.35 | F1 |
| 4083.22 | 1.61(1) | 1.67(1) | O II | 4078.84 | V10 |
| 4086.71 | 1.36(1) | 1.41(1) | ? | 4086.71 | |
| 4088.71 | 1.49(1) | 1.54(1) | O II | 4083.90 | V48b |
| 4089.92 | 1.05(1) | 1.09(1) | O II | 4085.11 | V10 |
| 4091.97 | 1.10(1) | 1.13(1) | O II | 4087.15 | V48c |
| 4094.11 | 1.26(1) | 1.31(1) | O II | 4089.29 | V48a |
| 4106.03 | 2.68(1) | 2.77(1) | H 6 | 4101.74 | H6 |
| 4114.41 | 1.51(1) | 1.56(1) | O II | 4110.78 | V20 |
| 4116.86 | 1.44(1) | 1.49(1) | ? | 4116.86 | |
| 4125.03 | 2.74(1) | 2.82(1) | He I | 4120.84 | V16 |
| 4135.89 | 1.08(1) | 1.11(1) | O II | 4129.32 | V19 |
| 4139.38 | 1.32(1) | 1.36(1) | O II | 4132.80 | V19 |
| 4147.96 | 3.07(1) | 3.16(1) | He I | 4143.76 | V53 |
| 4157.64 | 9.54(2) | 9.82(2) | O II | 4153.30 | V19 |
| 4160.87 | 1.24(1) | 1.28(1) | O II | 4156.53 | V19 |
| 4164.34 | 2.30(1) | 2.37(1) | ? | 4164.34 | |
| 4169.09 | 2.29(1) | 2.35(1) | ? | 4169.09 | |
| * | * | O II | 4169.22 | V19 | |
| LMC N11B | |||||
|---|---|---|---|---|---|
| ID | Mult | ||||
| 4179.89 | 8.61(2) | 8.85(2) | N II | 4176.16 | V43a |
| 4190.33 | 8.63(2) | 8.87(2) | C III | 4186.90 | V18 |
| 4193.23 | 1.51(1) | 1.55(1) | O II | 4189.79 | V36 |
| 4207.42 | 1.29(1) | 1.32(1) | ? | 4207.42 | |
| 4212.17 | 3.90(1) | 4.00(1) | ? | 4212.17 | |
| 4218.52 | 1.15(1) | 1.18(1) | ? | 4218.52 | |
| 4221.32 | 1.75(1) | 1.79(1) | ? | 4221.32 | |
| 4241.04 | 9.68(2) | 9.93(2) | N II | 4237.05 | |
| 4245.50 | 2.88(1) | 2.95(1) | N II | 4241.78 | V48a |
| 4252.40 | 2.03(1) | 2.08(1) | ? | 4248.15 | |
| 4257.04 | 2.57(1) | 2.64(1) | ? | 4252.73 | |
| 4263.04 | 1.94(1) | 1.99(1) | ? | 4263.04 | |
| 4265.80 | 2.54(1) | 2.60(1) | ? | 4265.80 | |
| 4268.90 | 1.91(1) | 1.95(1) | C II | 4267.15 | V6 |
| 4277.87 | 4.16(1) | 4.26(1) | O II | 4276.28 | V67b |
| 4282.91 | 2.61(1) | 2.67(1) | O II | 4281.32 | V53b |
| 4287.28 | 1.07(1) | 1.09(1) | O II | 4285.69 | V78b |
| 4292.84 | 2.73(1) | 2.79(1) | O II | 4291.25 | V55 |
| 4316.78 | 3.79(1) | 3.87(1) | O II | 4312.11 | V78a |
| 4320.07 | 7.82(1) | 8.00(1) | O II | 4315.40 | V63c |
| 4318.80 | 1.31(1) | 1.34(1) | O II | 4317.14 | V2 |
| 4321.01 | 3.34(1) | 3.41(1) | O II | 4319.63 | V2 |
| 4329.52 | 2.86(1) | 2.92(1) | O II | 4325.76 | V2 |
| 4332.30 | 1.89(1) | 1.93(1) | ? | 4329.08 | |
| 4334.89 | 2.82(1) | 2.88(1) | O II | 4331.13 | V65b |
| 4344.77 | 4.58(1) | 4.67(1) | H 5 | 4340.47 | H5 |
| 4353.52 | 1.31(1) | 8.71(2) | O II | 4349.43 | V2 |
| 4357.68 | 1.31(1) | 1.34(1) | O II | 4353.59 | V76c |
| 4367.56 | 1.65 | 1.68 | [O III] | 4363.21 | F2 |
| 4392.35 | 4.85(1) | 4.95(1) | He I | 4387.93 | V51 |
| 4412.04 | 2.00(1) | 2.04(1) | ? | 4412.00 | |
| 4419.80 | 2.18(1) | 2.22(1) | O II | 4414.90 | V5 |
| 4475.98 | 4.24 | 4.31 | He I | 4471.50 | V14 |
| 4532.10 | 4.14(2) | 4.20(2) | ? | 4541.25 | |
| 4537.53 | 8.80(2) | 8.92(2) | ? | 4537.54 | |
| 4539.73 | 5.77(2) | 5.85(2) | N III | 4534.58 | V3 |
| 4542.95 | 7.87(2) | 7.97(2) | ? | 4542.95 | |
| 4546.93 | 7.77(2) | 7.87(2) | ? | 4546.93 | |
| 4560.15 | 1.49(1) | 1.51(1) | [Fe II] | 4555.00 | |
| 4561.54 | 2.59(2) | 2.63(2) | Fe II | 4556.39 | |
| 4567.55 | 1.92(1) | 1.95(1) | Mg I] | 4562.60 | |
| 4576.06 | 2.01(1) | 2.03(1) | Mg I] | 4571.10 | |
| 4589.35 | 5.92(2) | 5.99(2) | ? | 4584.40 | |
| 4609.38 | 4.64(2) | 4.69(2) | ? | 4604.43 | |
| 4643.65 | 1.15(1) | 1.17(1) | O II | 4638.49 | V1 |
| 4646.29 | 2.73(2) | 2.75(2) | N III | 4640.64 | V2 |
| 4647.08 | 5.26(2) | 5.30(2) | O II | 4641.81 | V1 |
| 4654.05 | 7.55(2) | 7.60(2) | O II | 4649.13 | V1 |
| 4655.76 | 6.27(2) | 6.31(2) | O II | 4650.84 | V1 |
| 4662.81 | 2.69(1) | 2.72(1) | [Fe III] | 4658.10 | 3F |
| 4665.73 | 7.05(2) | 6.40(2) | O II | 4661.63 | V1 |
| 4670.96 | 2.54(2) | 2.56(2) | [Fe III] | 4667.00 | 3F |
| 4677.69 | 3.05(2) | 3.08(2) | O II | 4673.73 | V1 |
| 4686.08 | 5.00(2) | 5.04(2) | ? | 4681.44 | |
| 4695.95 | 8.14(2) | 8.20(2) | ? | 4691.31 | |
| 4700.84 | 3.43(2) | 3.46(2) | O II | 4696.35 | V1 |
| 4706.12 | 9.02(2) | 9.08(2) | [Fe III] | 4701.62 | 3F |
| 4711.25 | 2.60(2) | 2.61(2) | ? | 4706.60 | |
| 4717.81 | 5.06(1) | 5.09(1) | He I | 4713.17 | V12 |
| 4724.58 | 6.19(2) | 6.23(2) | ? | 4719.94 | |
| 4732.73 | 1.83(2) | 1.84(2) | ? | 4728.09 | |
| 4744.92 | 1.12(1) | 1.13(1) | [Ar IV] | 4740.17 | F1 |
| 4749.76 | 2.41(2) | 2.43(2) | [Fe II] | 4745.48 | |
| 4759.60 | 8.73(2) | 8.77(2) | [Fe III] | 4754.83 | 3F |
| LMC N11B | |||||
|---|---|---|---|---|---|
| ID | Mult | ||||
| 4774.42 | 3.93(2) | 3.94(2) | [Fe III] | 4769.60 | 3F |
| 4779.56 | 2.61(2) | 2.62(2) | [Fe II] | 4774.74 | 20F |
| 4795.55 | 7.17(2) | 7.19(2) | ? | * | |
| 4803.51 | 2.18(2) | 2.18(2) | ? | 4798.87 | |
| 4815.88 | 6.52(2) | 6.53(2) | ? | 4815.88 | |
| 4819.93 | 9.96(2) | 9.98(2) | [Fe II] | 4814.55 | 20F |
| 4865.95 | 1.00(2) | 1.00(2) | H 4 | 4861.33 | H4 |
| 4885.52 | 5.33(2) | 5.32(2) | [Fe III] | 4881.11 | 2F |
| 4905.47 | 2.92(2) | 2.91(2) | [Fe IV]? | 4900.50 | -F |
| 4926.64 | 1.08 | 1.07 | He I | 4921.93 | V48 |
| 4929.24 | 1.26(1) | 1.26(1) | O II | 4924.53 | V28 |
| 4935.89 | 7.44(2) | 7.42(2) | [O III] | 4931.80 | F1 |
| 4968.01 | 1.10(2) | 1.09(2) | [O III] | 4958.91 | F1 |
| 5016.07 | 3.32(2) | 3.30(2) | [O III] | 5006.84 | F1 |
| 5052.34 | 1.32(1) | 1.31(1) | ? | 5052.34 | |
| 5060.59 | 4.73(1) | 4.69(1) | ? | 5060.59 | |
| 5526.40 | 5.07(1) | 4.94(1) | [Cl III] | 5517.66 | F1 |
| 5546.37 | 4.94(1) | 4.81(1) | [Cl III] | 5537.60 | F1 |
| 5752.46 | 1.23(1) | 1.19(1) | ? | 5752.46 | |
| 5763.87 | 2.09(1) | 2.02(1) | [N II] | 5754.60 | F3 |
| 5883.90 | 1.52(1) | 1.47(1) | He I | 5875.66 | V11 |
| 6564.36 | 6.11 | 5.79 | [N II] | 6548.10 | F1 |
| 6578.06 | 3.34(2) | 3.16(2) | H 3 | 6562.77 | H3 |
| 6597.40 | 1.75(1) | 1.65(1) | [N II] | 6583.50 | F1 |
| 6687.50 | 3.89 | 3.68 | He I | 6678.16 | V46 |
| 6724.72 | 1.50(1) | 1.42(1) | [S II] | 6716.44 | F2 |
| 6738.76 | 1.11(1) | 1.05(1) | [S II] | 6730.82 | F2 |
| 7076.35 | 2.48 | 2.32 | He I | 7065.25 | V10 |
| 7149.04 | 1.23(1) | 1.15(1) | [Ar III] | 7135.80 | F1 |
| 7158.08 | 2.67(1) | 2.49(1) | ? | * | |
| 7294.45 | 1.83 | 1.71 | He I | 7281.35 | V45 |
| 7338.55 | 4.60 | 4.28 | [O II] | 7318.92 | F2 |
| 7350.41 | 6.26 | 5.84 | [O II] | 7329.67 | F2 |
| SMC N66 | |||||
| ID | Mult | ||||
| 3705.43 | 2.39 | 2.52 | H 16 | 3703.86 | H16 |
| 3713.54 | 1.83 | 1.93 | H 15 | 3711.97 | H15 |
| 3723.31 | 3.55 | 3.73 | [S III] | 3721.63 | F2 |
| 3727.50 | 4.77(1) | 5.02(1) | [O II] | 3726.03 | F1 |
| 3730.29 | 6.80(1) | 7.16(1) | [O II] | 3728.82 | F1 |
| 3736.06 | 2.94 | 3.09 | H 13 | 3734.37 | H13 |
| 3751.70 | 2.83 | 2.97 | H 12 | 3750.15 | H12 |
| 3772.19 | 3.86 | 4.05 | H 11 | 3770.63 | H11 |
| 3799.47 | 5.17 | 5.43 | H 10 | 3797.90 | H10 |
| 3836.98 | 7.27 | 7.62 | H 9 | 3835.39 | H9 |
| 3870.25 | 3.72(1) | 3.89(1) | [Ne III] | 3868.75 | F1 |
| * | * | He I | 3888.65 | V2 | |
| 3890.56 | 1.89(1) | 1.98(1) | H 8 | 3889.05 | H8 |
| 3969.00 | 1.03(1) | 1.07(1) | [Ne III] | 3967.46 | F1 |
| 3971.61 | 1.49(1) | 1.56(1) | H 7 | 3970.07 | H7 |
| 4027.79 | 2.38 | 2.47 | He I | 4026.21 | V18 |
| 4071.28 | 9.37(1) | 9.73(1) | [S II] | 4068.60 | F1 |
| 4076.17 | 1.43(1) | 1.49(1) | ? | 4073.74 | |
| 4079.03 | 2.85(1) | 2.96(1) | [S II] | 4076.35 | F1 |
| 4081.53 | 6.41(2) | 6.65(2) | O II | 4078.84 | V10 |
| 4104.35 | 2.58(1) | 2.67(1) | H 6 | 4101.74 | H6 |
| 4114.66 | 5.04(2) | 5.23(2) | ? | 4112.59 | |
| 4123.59 | 2.51(1) | 2.60(1) | He I | 4120.84 | V16 |
| 4128.30 | 7.48(2) | 7.75(2) | ? | 4125.62 | |
| 4146.25 | 3.07(1) | 3.18(1) | He I | 4143.76 | V53 |
| 4155.79 | 1.07(1) | 1.11(1) | O II | 4153.30 | V19 |
| 4171.46 | 9.24(2) | 9.56(2) | O II | 4169.22 | V19 |
| 4207.77 | 1.05(1) | 1.08(1) | ? | 4204.93 | |
| SMC N66 | |||||
|---|---|---|---|---|---|
| ID | Mult | ||||
| 4342.97 | 4.61(1) | 4.73(1) | H 5 | 4340.47 | H5 |
| 4349.37 | 5.93(2) | 6.08(2) | S II | 4347.20 | |
| 4358.29 | 6.29(2) | 6.45(2) | ? | 4355.74 | |
| 4361.93 | 4.87(2) | 4.99(2) | [Fe II] | 4359.34 | 7F |
| 4365.70 | 6.11 | 6.26 | [O III] | 4363.21 | F2 |
| 4390.47 | 4.61(1) | 4.71(1) | He I | 4387.93 | V51 |
| 4408.60 | 8.33(2) | 8.52(2) | [Fe II] | 4406.38 | |
| 4412.07 | 1.01(1) | 1.03(1) | [Fe II] | 4409.85 | V55e |
| 4416.00 | 8.33(2) | 8.52(2) | [Fe II] | 4413.78 | |
| 4420.38 | 8.33(2) | 8.52(2) | [Fe II] | 4418.15 | |
| 4439.95 | 1.11(1) | 1.13(1) | He I | 4437.55 | V50 |
| 4474.10 | 3.93 | 4.01 | He I | 4471.50 | V14 |
| 4485.62 | 6.49(2) | 6.61(2) | ? | * | |
| 4538.63 | 5.71(2) | 5.80(2) | ? | 4535.96 | |
| 4543.46 | 5.05(2) | 5.13(2) | ? | 4541.59 | |
| 4546.67 | 4.52(2) | 4.59(2) | N III | 4544.80 | V12 |
| 4553.44 | 4.55(2) | 4.62(2) | ? | 4550.76 | |
| 4565.18 | 2.06(1) | 2.09(1) | Mg I] | 4562.60 | |
| 4573.68 | 1.29(1) | 1.31(1) | Mg I] | 4571.10 | |
| 4589.44 | 5.49(2) | 5.56(2) | ? | 4586.75 | |
| 4593.51 | 4.55(2) | 4.61(2) | O II | 4590.97 | V15 |
| 4597.60 | 3.92(2) | 3.97(2) | ? | 4594.90 | V15 |
| 4598.72 | 1.99(2) | 2.02(2) | O II | 4596.18 | V15 |
| 4609.66 | 4.23(2) | 4.29(2) | [Fe III] | 4607.13 | 3F |
| 4633.28 | 3.86(2) | 3.91(2) | N II | 4630.54 | V5 |
| 4641.96 | 3.07(2) | 3.11(2) | O II | 4638.49 | V1 |
| 4644.60 | 6.30(2) | 6.37(2) | N III | 4640.64 | V2 |
| 4652.34 | 5.38(2) | 5.44(2) | O II | 4649.13 | V1 |
| 4654.05 | 5.06(2) | 5.12(2) | O II | 4650.84 | V1 |
| 4654.68 | 7.01(3) | 7.08(3) | ? | 4654.68 | |
| 4658.66 | 9.27(2) | 9.36(2) | ? | 4655.92 | |
| 4661.01 | 1.63(1) | 1.65(1) | [Fe III] | 4658.10 | 3F |
| 4664.28 | 7.91(2) | 8.00(2) | O II | 4661.63 | V1 |
| 4685.79 | 3.89(2) | 3.92(2) | ? | 4683.25 | |
| 4696.16 | 3.84(2) | 3.87(2) | ? | 4693.31 | |
| 4704.42 | 4.37(2) | 4.40(2) | [Fe III] | 4701.62 | 3F |
| 4714.07 | 3.03(1) | 3.05(1) | [Ar IV] | 4711.37 | F1 |
| 4715.87 | 4.87(1) | 4.90(1) | He I | 4713.17 | V12 |
| 4724.87 | 5.66(2) | 5.70(2) | ? | 4722.83 | |
| 4742.99 | 2.05(1) | 2.06(1) | [Ar IV] | 4740.17 | F1 |
| 4744.50 | 5.13(2) | 5.16(2) | O II | 4741.71 | 25 |
| 4757.83 | 5.77(2) | 5.80(2) | [Fe III] | 4754.83 | 3F |
| 4760.61 | 3.71(2) | 3.73(2) | Fe II? | 4757.66 | |
| 4815.82 | 4.86(2) | 4.87(2) | Si III | 4813.20 | |
| 4818.07 | 5.85(2) | 5.86(2) | S II | 4815.45 | V9 |
| 4820.77 | 7.88(2) | 7.90(2) | ? | 4818.10 | |
| 4828.09 | 5.94(2) | 5.95(2) | ? | 4825.61 | |
| 4833.25 | 6.59(2) | 6.60(2) | ? | 4830.55 | |
| 4837.60 | 4.08(2) | 4.08(2) | ? | 4834.70 | |
| 4842.50 | 5.94(2) | 5.94(2) | ? | 4840.03 | |
| 4846.88 | 5.94(2) | 5.94(2) | ? | 4844.15 | |
| 4864.06 | 1.00(2) | 1.00(2) | H 4 | 4861.33 | H4 |
| 4891.36 | 7.93(2) | 7.92(2) | [Fe II] | 4889.63 | 4F |
| 4896.47 | 3.25(2) | 3.24(2) | ? | 4893.75 | |
| 4905.43 | 5.59(2) | 5.57(2) | [Fe IV] | 4903.10 | |
| 4909.17 | 4.44(2) | 4.43(2) | O II | 4906.83 | V28 |
| 4914.39 | 4.50(2) | 4.49(2) | ? | 4914.84 | |
| 4917.57 | 4.50(2) | 4.49(2) | ? | 4921.93 | |
| 4924.75 | 1.07 | 1.06 | He I | 4921.93 | V48 |
| 4927.35 | 7.04(2) | 7.02(2) | O II | 4924.53 | V28 |
| 4933.84 | 4.82(2) | 4.81(2) | [O III] | 4931.80 | F1 |
| 4937.97 | 3.70(2) | 3.68(2) | ? | 4934.52 | |
| 4943.12 | 7.05(2) | 7.02(2) | O II | 4941.07 | V33 |
| 4965.36 | 1.70(2) | 1.69(2) | [O III] | 4958.91 | F1 |
| SMC N66 | |||||
|---|---|---|---|---|---|
| ID | Mult | ||||
| 5013.46 | 5.12(2) | 5.08(2) | [O III] | 5006.84 | F1 |
| 5525.05 | 3.57(1) | 3.46(1) | [Cl III] | 5517.66 | F1 |
| 5545.02 | 4.41(1) | 4.28(1) | [Cl III] | 5537.60 | F1 |
| 5760.62 | 1.31(1) | 1.26(1) | [N II] | 5754.60 | F3 |
| 6142.57 | 5.97(1) | 5.67(1) | ? | 6136.36 | |
| 6172.14 | 5.97(1) | 5.66(1) | [Mn V] | 6166.00 | |
| 6204.09 | 2.57(1) | 2.44(1) | O II | 6197.92 | |
| 6237.22 | 2.16 | 2.04 | [Ni III] | 6231.09 | |
| 6260.46 | 1.65 | 1.56 | [Fe II] | 6254.30 | |
| 6301.05 | 1.56(1) | 1.48(1) | [O I] | 6300.34 | F1 |
| 6312.81 | 1.73 | 1.64 | [S III] | 6312.10 | F3 |
| 6467.49 | 2.05 | 1.93 | C II | 6461.95 | |
| 6499.73 | 2.05 | 1.93 | ? | 6492.97 | |
| 6529.90 | 2.25 | 2.11 | ?WR | 6516.12 | |
| 6543.22 | 2.04 | 1.91 | ? | 6529.41 | |
| 6561.94 | 2.95 | 2.76 | [N II] | 6548.10 | F1 |
| 6574.48 | 3.05(2) | 2.86(2) | H 3 | 6562.77 | H3 |
| 6593.61 | 4.08 | 3.82 | [N II] | 6583.50 | F1 |
| 6683.76 | 3.17 | 2.97 | He I | 6678.16 | V46 |
| 6720.72 | 8.45 | 7.89 | [S II] | 6716.44 | F2 |
| 6735.11 | 6.19 | 5.78 | [S II] | 6730.82 | F2 |
| 7072.20 | 2.46 | 2.28 | He I | 7065.25 | V10 |
| 7144.83 | 9.68 | 8.94 | [Ar III] | 7135.80 | F1 |
| 7166.84 | 1.39 | 1.28 | ? | 7159.07 | |
| 7178.54 | 3.61(1) | 3.34(1) | [Ar IV] | 7070.62 | |
| 7186.58 | 2.50(1) | 2.30(1) | ? | 7186.58 | |
| 7293.51 | 5.73 | 5.27 | He I | 7281.35 | V45 |
| 7333.56 | 1.92 | 1.77 | [O II] | 7318.92 | F2 |
| 7344.32 | 1.68 | 1.55 | [O II] | 7329.67 | F2 |
3 Nebular analysis
3.1 Reddening correction
In the case of the galactic nebulae M 17 and NGC 3576, the galactic reddening law of Howarth (1983) was used to correct for interstellar extinction, with the amount of extinction at H determined by comparing the observed Balmer H/H, H/H and H/H decrements to their Case B theoretical values from Storey & Hummer (1995). For the M 17 and NGC 3576 sightlines, values of c(H) = 1.84 and 1.25 respectively were found.
For the Magellanic Cloud nebulae, the contribution from galactic foreground reddening was estimated from the reddening maps of Burstein & Heiles (1982), using the extinction law of Howarth (1983) in all cases. For the direction to 30 Doradus, c(H) = 0.087 through the Milky Way was found. The remaining extinction due to the immediate 30 Doradus environment was found to be c(H) = 0.32, from the foreground-corrected Balmer decrements, using the LMC extinction law of Howarth (1983). For LMC N11B and SMC N66, no further correction was attempted after foreground Galactic reddenings of c(H) = 0.073 and 0.087, respectively, were corrected for, since the resulting Balmer line ratios were in good agreement with their Case B theoretical values.
3.2 Electron temperatures and densities
| Diagnostic ratio | M 17 | NGC 3576 | 30 Doradus | LMC N11B | SMC N66 |
|---|---|---|---|---|---|
| (K) | |||||
| [O iii] (4959+5007)/4363 | 8200 | 8850 | 10100 | 9400 | 12400 |
| [N ii] (6548+6584)/5754 | 9100 | 9000 | 12275 | 9250 | 14825 |
| 7900a | 8500a | 11600a | * | * | |
| [S ii] 4068/(6717+6730) | 8850 | 7900 | 7500 | 6950 | 11050 |
| BJ/H 11 | 7700 | 8070 | * | * | * |
| 7840 | 8300 | * | * | * | |
| 0.011 | 0.017 | * | * | * | |
| (cm-3) | |||||
| [Ar iv] 4740/4711 | 1500 | 1700 | 1800 | * | 100 |
| [Cl iii] 5537/5517 | 1050 | 2700 | 480 | 1700 | 3700 |
| [S ii] 6731/6716 | 600 | 1350 | 390 | 80 | 60 |
| [O ii] 3729/3726 | * | 1300 | 370 | 110 | 50 |
- a
-
[N ii] temperatures after correction for recombination excitation contributions.
Nebular electron temperatures and densities were derived from several CEL diagnostic ratios by solving the equations of statistical equilibrium using the multi-level ( 5) atomic model equib and are presented in Table 3. The atomic data sets used for this purpose, as well as for the derivation of abundances, are the same as those used by Liu et al. (2000) in the study of the planetary nebula NGC 6153. The procedure was as follows: a representative initial of 9000 K was assumed in order to derive (Cl iii) and (Ar iv); the mean electron density derived from these diagnostics was then used to derive (O iii), and we then iterated once to get the final values. In a similar manner, (N ii) was derived in conjunction with (O ii) and (S ii). The Balmer jump (BJ) electron temperatures of M 17 and NGC 3576 were derived from the ratio of the H i recombination continuum Balmer discontinuity at 3646 Å to the H 11 3770 line. These temperatures are presented in Table 3, along with the mean nebular temperature, , and temperature fluctuation parameter, (Peimbert 1967) implied by the BJ and [O iii] temperatures.
The electron temperatures deduced from the [N ii] nebular to auroral line ratio are higher than those of the corresponding [O iii] line ratio—except for LMC N11B, where the derived values are probably consistent within the errors. The differences exceed 2000 K for 30 Doradus and SMC N66. Using photoionization models of metal-rich H ii regions, Stasińska (1980) has argued that the electron temperature increases outward as a function of radius, probably due to a combination of hardening of the radiation field with increasing optical depth, plus stronger cooling from fine-structure lines of [O iii] in the inner parts of the nebulae where O2+ dominates; thus the temperature in zones where singly ionized species exist is predicted to be higher than ([O iii]).
However, the contribution of recombination to the excitation of the [N ii] 5754 line (Rubin 1986), coupled with the potential presence of high-density inclusions in nebulae (Viegas & Clegg 1994), may cause deceptively high temperatures to be derived from the [N ii] nebular to auroral line ratio, as well as from the corresponding [O ii] 3727/(7320 + 7330) ratio. We have therefore estimated corrections to the [N ii] temperatures of M 17, NGC 3576 and 30 Doradus, making use of the derived ORL N2+/H+ fractions presented later in Table 6 and Eq. 1 of Liu et al. (2000). The revised [N ii] temperatures for these three nebulae respectively, are 7900, 8500 and 11600 K; improved agreement with the corresponding [O iii] temperatures of 8200, 8850 and 10100 K is found in all cases. Given the inherent uncertainties, the (N ii)’s were not used in the abundance analysis that follows.
Regarding the derived electron densities, it is found that in four out of five nebulae the densities deduced from the [S ii] 6731/6716 ratio are in good agreement with those derived from the [O ii] 3729/3726 ratio (the spectral resolution was not adequate to allow the determination of the [O ii] doublet ratio in M 17), but are lower than the values given by the [Ar iv] and [Cl iii] diagnostics. This can be seen especially in LMC N11B and SMC N66 where the [O ii] and [S ii] doublet ratios approach the low-density limit, and certainly imply ’s an order of magnitude less than from the doubly ionized species (Table 3). This behaviour is consistent with the presence of strong density variations in the nebulae, so that diagnostic line ratios from lines with higher critical densities111For [Cl iii] 5517, 5537, = 6400 and 34000 cm-3; for [Ar iv] 4711, 4740, = 14 000 and 130,000 cm-3; for [O ii] 3726, 3729, = 4300 and 1300 cm-3; and for [S ii] 6716, 6730, = 1200 and 3300 cm-3 respectively; the quoted values are for an electron temperature of 10000 K. yield higher derived nebular electron densities (see Rubin 1989, Liu et al. 2001a).
4 Ionic and total elemental abundances from CELs
We used the statistical equilibrium code equib to derive ionic abundances from nebular CELs. The ionic abundances deduced are presented in Table 4. For each nebula, the electron temperature derived from the [O iii] nebular to auroral line ratio was adopted for all ionic species, following the discussion detailed in the previous section. Regarding the choice of electron densities, we adopted the mean of the values deduced from the [O ii] and [S ii] doublet ratios in order to derive abundances of singly ionized species, while the mean electron densities from the [Ar iv] and [Cl iii] ratios were used to derive abundances for doubly and triply ionized species.
| M 17 | NGC 3576 | 30 Doradus | LMC N11B | SMC N66 | ||
|---|---|---|---|---|---|---|
| 4471 | He+/H+ | 0.0955(1) | 0.0949(1) | 0.0874(1) | 0.0856(1) | 0.0791(1) |
| 5876 | He+/H+ | 0.0959(4) | 0.0926(4) | 0.0910(3) | 0.1022(4) | 0.1006(4) |
| 6678 | He+/H+ | 0.0909(1) | 0.0879(1) | 0.0926(1) | 0.0906(1) | 0.0756(1) |
| Avg. | He/H | 0.0950 | 0.0922 | 0.0906 | 0.0975 | 0.0928 |
| 3727 | O+/H+ | 9.28(5) | 1.10(4) | 4.13(5) | 1.12(4) | 3.35(5) |
| 7320+7330 | … | 1.18(4): | 2.06(4): | 5.77(5): | 3.79(4): | 8.77(6): |
| 4931 | O2+/H+ | 2.23(4): | 3.31(4): | * | 2.36(4): | 6.30(5): |
| 4959 | … | 2.66(4) | 2.21(4) | 1.76(4) | 1.47(4) | 9.41(5) |
| icf(O) | 1.00 | 1.00 | 1.00 | 1.00 | 1.00 | |
| O/H | 3.59(4) | 3.31(4) | 2.17(4) | 2.59(4) | 1.28(4) | |
| 6548+6584 | N+/H+ | 8.14(6) | 1.17(5) | 1.48(6) | 3.66(6) | 5.37(7) |
| icf(N) | 3.87 | 3.01 | 5.25 | 2.31 | 3.82 | |
| N/H | 3.15(5) | 3.52(5) | 7.77(6) | 8.45(6) | 2.05(6) | |
| 3868+3967 | Ne2+/H+ | 7.17(5) | 3.46(5) | 3.71(5) | 2.40(5) | 1.72(5) |
| icf(Ne) | 1.39 | 1.50 | 1.23 | 1.76 | 1.36 | |
| Ne/H | 9.97(5) | 5.19(5) | 4.56(5) | 4.22(5) | 2.34(5) | |
| 7135 | Ar2+/H+ | 1.48(6) | 1.70(6) | 1.11(6) | 1.12(6) | 4.71(7) |
| 4711+4740 | Ar3+/H+ | 2.72(8) | 2.15(8) | 3.39(8) | 2.27(8) | 3.16(8) |
| icf(Ar) | 1.35 | 1.50 | 1.24 | 1.76 | 1.35 | |
| Ar/H | 2.03(6) | 2.58(6) | 1.42(6) | 2.01(6) | 6.79(7) | |
| 4069 | S+/H+ | 5.79(7): | 7.50(7): | 2.53(7): | 8.82(7): | 2.60(7): |
| 6716+6730 | … | 3.60(7) | 6.20(7) | 2.80(7) | 7.32(7) | 2.59(7) |
| 6312 | S2+/H+ | 8.05(6) | * | 4.28(6) | * | 1.66(6) |
| icf(S) | 1.19 | * | 1.29 | * | 1.19 | |
| S/H | 1.00(5) | 6.57(7) | 5.88(6) | 4.98(6) | 2.28(6) | |
| 5517 | Cl2+/H+ | 1.07(7) | 9.95(8) | 5.14(8) | 7.69(8) | 2.63(8) |
| icf(Cl) | 1.24 | 1.52 | 1.37 | 1.79 | 1.37 | |
| Cl/H | 1.33(7) | 1.51(7) | 7.04(8) | 1.38(7) | 3.60(8) |
- a
-
Numbers followed by ‘:’ have not been used at any point in the analysis. The numbers in parentheses following the He+/H+ abundances are the weighting factors used for the derivation of the average He+/H+ abundance.
Total abundances from CELs have been derived adopting the ICF scheme of Kingsburgh & Barlow (1994), apart from Cl which was not discussed by those authors. For that element and in the cases of M 17, 30 Doradus and SMC N66, the prescription of Liu et al. (2000) was used, according to which Cl/H = (S/S2+) Cl2+/H+, based on the similarities of the ionization potentials of chlorine ionic stages to those of sulphur ionic stages. On the other hand, for NGC 3576 and LMC N11B, for which the listed S abundances are lower limits, we adopted Cl/H = (Ar/Ar2+) Cl2+/H+. The total oxygen abundance was adopted to be the sum of singly and doubly ionized oxygen abundances. No significant amounts of O3+ are expected, since no He ii recombination lines are seen.
5 Ionic abundances from ORLs
Since ionic abundances relative to H+ derived from intensity ratios of heavy element ORLs relative to a hydrogen recombination line depend only weakly on the adopted temperature, and are essentially independent of , for each nebula the [O iii] temperature was adopted for the calculations. The He abundances derived from He i recombination lines are given in Table 4. Case A recombination was assumed for the triplet lines 4471, 5876 and Case B for the singlet 6678 line. The effective recombination coefficients were from Brocklehurst (1972). For the 4471 line, the effective coefficient given by Brocklehurst (1972) differs by only 1.4 per cent from the calculations of Smits (1996). The differences between the two calculations are even smaller for the other two lines. Contributions to the observed fluxes by collisional excitation from the He0 2s 3S metastable level by electron impacts were corrected for using the formulae derived by Kingdon & Ferland (1995a).
In the following subsections we present C, N and O ionic abundances derived from ORLs.
5.1 C2+/H+ and N2+/H+
The case-insensitive C ii 4267 (4f–3d) line has been detected from all nebulae except SMC N66 and used to derive the C2+/H+ abundance ratios presented in Table 5; an upper limit only has been estimated for SMC N66. The doublet from multiplet V 4 (3920) has also been detected from NGC 3576, but not used for abundance determinations since its upper levels are directly connected to the C+ 2p ground term, and the doublet is therefore potentially affected by optical depth effects.
Regarding the N2+/H+ ORL abundance ratios, these have been derived for M 17 and NGC 3576 and are presented in Table 6; lines from the N ii 3s–3p V 3 and V 5 multiplets have been detected and Case B recombination has been assumed. It is estimated that under Case A the abundance ratios deduced from the V 5 lines would be several times higher, while V 3 results would be larger by only about 20 per cent. Longer exposure times would be required to detect the weaker case-insensitive lines from the 3d–4f group. N ii ORLs have not been unambiguously detected from any of the Magellanic Cloud H ii regions; the strongest predicted multiplet V 3 (5680) is probably present in 30 Doradus, but the resolution of our spectra is too low (FWHM 11 Å) at this wavelength to allow us to be conclusive. In that nebula’s spectrum the strongest N ii V 5 multiplet line, at 4630 Å, is marginally detected; an upper limit to the N2+/H+ fraction of 5.48 10-5 was derived from it. From Table 6 we adopt N2+/H+ fractions of 3.53 10-4 and 2.70 10-4 for M 17 and NGC 3576, respectively.
| M 17 | NGC 3576 | 30 Dor | LMC N11B | SMC N66 | |
|---|---|---|---|---|---|
| 0.482 | 0.312 | 0.0919 | 0.196 | 0.0419 | |
| 104 C2+/H+ | 4.35 | 2.87 | 0.882 | 1.82 | 0.433 |
| Mult. | |||||||
| (Å) | (10-4) | (10-4) | (10-4) | ||||
| M 17 | NGC 3576 | 30 Doradus | |||||
| V 3 3s 3Po-3p 3D | |||||||
| 5666.63 | V3 | .0569 | 4.35 | .0358 | 2.80 | * | * |
| 5676.02 | V3 | .0170 | 2.93 | .0159 | 2.72 | * | * |
| 5679.56 | V3 | .0544 | 2.23 | .0667 | 2.75 | * | * |
| V 5 3s 3Po-3p 3P | |||||||
| 4630.54 | V5 | .0602 | 4.99 | .0309 | 2.56 | .0066 | .548 |
| V 20 3p 3D-3d 3Do | |||||||
| 4803.29 | V20 | .0304 | 4.52 | * | * | * | * |
| Sum | .219 | 3.53 | .149 | 2.70 | * | .548 | |
5.2 O2+/H+
| (Å) | Mult | Terml–Termu | gl–gu | Ipred | Iobs | Iobs/Ipred |
| M 17 | ||||||
| (3s–3p) | ||||||
| 4638.86 | V1 | 3s 4P–3p 4D* | 2–4 | 0.21 | 0.77[.12] | 3.7[0.6] |
| 4641.81 | V1 | 3s 4P–3p 4D* | 4–6 | 0.53 | 1.11[.16] | 2.1[0.3] |
| 4649.13 | V1 | 3s 4P–3p 4D* | 6–8 | 1.00 | 1.00[.10] | 1.0[0.1] |
| 4650.84 | V1 | 3s 4P–3p 4D* | 2–2 | 0.21 | 0.63[.11] | 3.0[0.5] |
| 4661.63 | V1 | 3s 4P–3p 4D* | 4–4 | 0.27 | 0.76[.11] | 2.8[0.4] |
| 4676.24 | V1 | 3s 4P–3p 4D* | 6–6 | 0.22 | 0.46[.10] | 2.1[0.5] |
| 4317.14 | V2 | 3s 4P–3p 4P* | 2–4 | 0.44 | 1.04[.32] | 2.6[0.8] |
| 4319.63 | V2 | 3s 4P–3p 4P* | 4–6 | 0.43 | 0.31[.23] | 0.7[0.5] |
| 4345.56 | V2 | 3s 4P–3p 4P* | 4–2 | 0.40 | 0.63[.20] | 1.5[0.5] |
| 4349.43 | V2 | 3s 4P–3p 4P* | 6–6 | 1.00 | 1.00[.10] | 1.0[0.1] |
| NGC 3576 | ||||||
| (3s–3p) | ||||||
| 4638.86 | V1 | 3s 4P–3p 4D* | 2–4 | 0.21 | 0.55[.11] | 2.6[0.5] |
| 4641.81 | V1 | 3s 4P–3p 4D* | 4–6 | 0.53 | 0.95[.16] | 1.8[0.3] |
| 4649.13 | V1 | 3s 4P–3p 4D* | 6–8 | 1.00 | 1.00[.10] | 1.0[0.1] |
| 4650.84 | V1 | 3s 4P–3p 4D* | 2–2 | 0.21 | 0.60[.11] | 2.9[0.5] |
| 4661.63 | V1 | 3s 4P–3p 4D* | 4–4 | 0.27 | 0.99[.16] | 3.7[0.6] |
| 4676.24 | V1 | 3s 4P–3p 4D* | 6–6 | 0.22 | 0.60[.16] | 2.7[0.7] |
| (3p–3d) | ||||||
| 4069.89 | V10 | 3p 4D*–3d 4F | 4–6 | 0.74 | 1.40[.20] | 1.9[0.3] |
| 4072.16 | V10 | 3p 4D*–3d 4F | 6–8 | 0.69 | 1.20[.82] | 1.7[1.2] |
| 4075.86 | V10 | 3p 4D*–3d 4F | 8–10 | 1.00 | 1.00[.10] | 1.0[0.1] |
| 4085.11 | V10 | 3p 4D*–3d 4F | 6–6 | 0.13 | 0.17[.10] | 1.3[0.8] |
| (3d–4f) | ||||||
| 4087.15 | V48c | 3d 4F–4f G3* | 4–6 | 0.27 | 1.30[.48] | 4.8[1.8] |
| 4089.29 | V48a | 3d 4F–4f G5* | 10–12 | 1.00 | 1.00[.10] | 1.0[0.1] |
| 4275.55 | V67a | 3d 4D–4f F4* | 8–10 | 1.20 | 4.18[1.1] | 3.5[0.9] |
| 4357.25 | V63a | 3d 4D–4f D3* | 6–8 | 0.05 | 2.36[.85] | 47.[17.] |
| 4609.44 | V92a | 3d 2D–4f F4* | 6–8 | 0.14 | 1.69[.64] | 12.[5.] |
| 30 Doradus | ||||||
| (3s–3p) | ||||||
| 4638.86 | V1 | 3s 4P–3p 4D* | 2–4 | 0.21 | 1.00[.15] | 4.8[0.7] |
| 4641.81 | V1 | 3s 4P–3p 4D* | 4–6 | 0.53 | 1.33[.18] | 2.5[0.3] |
| 4649.13 | V1 | 3s 4P–3p 4D* | 6–8 | 1.00 | 1.00[.10] | 1.0[0.1] |
| 4650.84 | V1 | 3s 4P–3p 4D* | 2–2 | 0.21 | 1.00[.19] | 4.8[0.9] |
| 4661.63 | V1 | 3s 4P–3p 4D* | 4–4 | 0.27 | 0.88[.12] | 3.3[0.4] |
| 4673.73 | V1 | 3s 4P–3p 4D* | 4–2 | 0.04 | 0.19[.03] | 4.8[0.8] |
| 4676.24 | V1 | 3s 4P–3p 4D* | 6–6 | 0.22 | 0.35[.05] | 1.6[0.2] |
| 4317.14 | V2 | 3s 4P–3p 4P* | 2–4 | 1.00 | 1.00[.10] | 1.0[0.1] |
| 4319.63 | V2 | 3s 4P–3p 4P* | 4–6 | 0.98 | 1.06[.12] | 1.1[0.1] |
| (3p–3d) | ||||||
| 4069.89 | V10 | 3p 4D*–3d 4F | 4–6 | 1.00 | 1.00[.10] | 1.0[0.1] |
| 4072.16 | V10 | 3p 4D*–3d 4F | 6–8 | 0.93 | 0.51[.09] | 0.6[0.1] |
| 4078.84 | V10 | 3p 4D*–3d 4F | 4–4 | 0.14 | 0.24[.05] | 1.7[0.4] |
| 4085.11 | V10 | 3p 4D*–3d 4F | 6–6 | 0.17 | 0.19[.04] | 1.1[0.2] |
| (3d–4f) | ||||||
| 4083.90 | V48b | 3d 4F–4f G4* | 6–8 | 0.29 | 0.51[.31] | 1.8[1.1] |
| 4087.15 | V48c | 3d 4F–4f G3* | 4–6 | 0.27 | 0.88[.23] | 3.3[0.9] |
| 4089.29 | V48a | 3d 4F–4f G5* | 10–12 | 1.00 | 1.00[.13] | 1.0[0.1] |
| 4275.55 | V67a | 3d 4D–4f F4* | 8–10 | 1.33 | 3.73[.71] | 2.8[0.5] |
| 4288.82 | V53c | 3d 4P–4f D1* | 2–4 | 0.83 | 11.9[2.6] | 14.[3.0] |
| 4303.83 | V53a | 3d 4P–4f D3* | 6–8 | 0.50 | 2.47[.44] | 4.9[0.9] |
| 4313.44 | V78a | 3d 2F–4f F4* | 8–10 | 0.61 | 2.06[.68] | 3.4[1.1] |
| 4315.69 | V63c | 3d 4D–4f D1* | 6–4 | 0.11 | 1.82[.67] | 17.[6.0] |
| 4609.44 | V92a | 3d 2D–4f F4* | 6–8 | 0.57 | 1.00[.24] | 2.0[0.4] |
| (Å) | Mult | Terml–Termu | gl–gu | Ipred | Iobs | Iobs/Ipred |
| LMC N11B | ||||||
| (3s–3p) | ||||||
| 4638.86 | V1 | 3s 4P–3p 4D* | 2–4 | 0.21 | 1.54[.15] | 7.3 [0.7] |
| 4641.81 | V1 | 3s 4P–3p 4D* | 4–6 | 0.53 | 0.70[.18] | 1.3 [0.3] |
| 4649.13 | V1 | 3s 4P–3p 4D* | 6–8 | 1.00 | 1.00[.10] | 1.0 [0.1] |
| 4650.84 | V1 | 3s 4P–3p 4D* | 2–2 | 0.21 | 0.83[.19] | 4.0 [0.9] |
| 4661.63 | V1 | 3s 4P–3p 4D* | 4–4 | 0.27 | 0.84[.12] | 3.1 [0.4] |
| 4673.73 | V1 | 3s 4P–3p 4D* | 4–2 | 0.04 | 0.41[.03] | 10.[1.0] |
| 4676.24 | V1 | 3s 4P–3p 4D* | 6–6 | 0.22 | 0.36[.05] | 1.6 [0.2] |
| SMC N66 | ||||||
| (3s–3p) | ||||||
| 4638.86 | V1 | 3s 4P–3p 4D* | 2–4 | 0.21 | 0.57[.15] | 2.7[0.7] |
| 4649.13 | V1 | 3s 4P–3p 4D* | 6–8 | 1.00 | 1.00[.10] | 1.0[0.1] |
| 4650.84 | V1 | 3s 4P–3p 4D* | 2–2 | 0.21 | 0.94[.19] | 4.5[0.9] |
| 4661.63 | V1 | 3s 4P–3p 4D* | 4–4 | 0.27 | 1.47[.32] | 5.4[1.2] |
To our knowledge, this is the first time that O ii ORLs arising from Magellanic Cloud H ii regions have been recorded. We have detected transitions from 3s–3p, as well as 3p–3d and 3d–4f configurations. In Table 7 we present a comparison between the observed and predicted intensities of O ii lines relative to the strongest expected line within each multiplet. The numbers in brackets are the formal absolute errors to the intrinsic intensities derived from the line-fitting method only; they do not include any possible systematic errors arising e.g. from the flux calibration of our spectra. As with our extensive O ii optical recombination-line survey of planetary nebulae (Tsamis et al. 2002b), it is assumed that LS-coupling holds for the 3s–3p transitions, while intermediate coupling is assumed for those between 3p–3d and 3d–4f states (Liu et al. 1995a). Table 7 is important both for checking whether observation agrees with theory and in excluding some lines from further consideration when blending or misidentification are suspected.
5.2.1 Relative intensities of O ii ORLs
In contrast to our results from a comparison of PN O ii relative line intensities (Tsamis et al. 2002b), there is clear evidence that several transitions are stronger than expected in all five H ii regions studied (Table 7). The effect is especially pronounced amongst the lines of O ii multiplet V 1; those of multiplet V 10, however, are in better agreement with theory even though their formal measurement errors are somewhat larger due to partial blending with the [S ii] 4068, 4076 doublet. A similar situation has been reported by Esteban et al. (1999) from their echelle observations of the Lagoon Nebula (M 8). Esteban et al. (1998) however, found quite good agreement between O ii multiplet V 1 lines from the Orion Nebula, a result supported by our examination of the relative intensities of the same transitions using the recent Orion line atlas by Baldwin et al. (2000), which has better spectral resolution than the data used by the former authors. Our observations show that for all five H ii regions the 4638.86 ( = 1/2–3/2) and 4650.84 ( = 1/2–1/2) V 1 transitions are enhanced from each nebula: by a factor ranging from 2.8–7.3 for the five objects under study; for Orion this factor is only 1.4 for both lines, but less for the other V 1 transitions. The 4661.63 ( = 3/2–3/2) line is also abnormally strong compared to theory.
One possible explanation for this behaviour involves the breakdown of thermal equilibrium among the fine structure levels of the parent 3P0, 1, 2 ground term of recombining O2+. Our analysis of the O ii 3s–3p transitions employed term-averaged effective recombination coefficients from Storey (1994) which were calculated assuming that the O ii 3s and 3p levels are well described by LS-coupling. When this is the case, the population distribution among the O2+ 3P0,1,2 levels has no effect on the recombination rate to these levels. If, however, there is a breakdown of LS-coupling so that the recombination rate coefficients from the individual 3PJ levels differ, then the total recombination coefficient to a particular O ii 3p state becomes a function of the population distribution among the 3PJ levels. There are no published results for the O ii recombination coefficients that take account of such effects but we have made a trial calculation of the inverse process of photoionisation from the 3p 4D7/2 level, the upper state of the 4649.13 transition. This calculation shows that the direct recombination to this level comes overwhelmingly from the O2+ 3P2 level. Recombination from the 3P0,1 levels is negligible. Therefore, if the population of the O2+ 3P2 level falls below that expected in thermal equilibrium the true recombination rate to the 3p 4D7/2 level will be less than that predicted by the LS-coupling results of Storey (1994) and the 4649.13 line will be observed to be weaker than is predicted by the LS-coupling theory. The relative populations of the O2+ 3P0,1,2 levels will depart from thermal equilibrium if the electron density of the nebula is lower than the critical densities of one or both of the 3P1,2 levels [ 500 and 3500 cm-3]. The mean electron density derived from various diagnostics for the objects under study here is in all cases lower than 2000 cm-3, while for the three Magellanic Cloud H ii regions, which show the greatest deviations from the predicted LS-coupling relative intensities for O ii V 1 multiplet transitions,222Large deviations are still present even if corrections are made for O ii absorption features in the nebular continuum component, attributable to dust-scattered starlight (see Section 5.2.2). it is lower than 1000 cm-3 (Table 3); this is in contrast to M 42, for which Esteban et al. (1998) find 5000 cm-3. Thus, it seems that within multiplet V 1 the strongest expected line, namely 4649.13 ( = 5/2–7/2), is weakened at the expense of transitions between levels of lower . This argument seems to be supported by our analysis of O ii ORLs originating from planetary nebulae (Liu et al. 1995a, 2000, 2001b; Tsamis 2002; Tsamis et al. 2002b). For example, the observed relative intensities of V 1 lines from the dense planetary nebulae IC 4191 and NGC 5315 are in perfect agreement with theory (Tsamis et al. 2002b); the derived mean electron densities of these objects are 10700 and 14100 cm-3 respectively. The opposite is true in the case of the PN NGC 3132 ( 600 cm-3), where the V 1 lines display abnormal ratios (Tsamis et al. 2002b), just as they do for the H ii regions considered here. We will return to this issue in a future paper (Tsamis et al. 2002b), by combining our H ii region ORL dataset from this paper with the PN ORL dataset of Tsamis et al. (2002b) in order to plot the relative intensities of O ii V 1 multiplet components as a function of nebular electron density.
If the above interpretation is correct, the total observed intensity of the whole multiplet should not be affected and can be used to derive a reliable ORL O2+/H+ abundance. A similar effect may dictate the relative intensities of lines from the 3d–4f group, weakening the 4089 transition (Liu 2002b).
A major point to be deduced from this analysis is that the observed relative intensities of O ii recombination lines point towards their origin in low density gas ( 3500 cm-3), similar to that emitting the [O iii] and other CELs.
| M 17 | NGC 3576 | 30 Doradus | LMC N11B | SMC N66 | ||||||
|---|---|---|---|---|---|---|---|---|---|---|
| 4089 | 2.402 | 2.508 | 2.218 | 2.279 | 2.433 | 2.564 | 2.063 | 2.135 | 2.103 | 2.168 |
| 4650 | 2.645 | 2.806 | 2.435 | 2.522 | 2.624 | 2.797 | 2.278 | 2.357 | 2.214 | 2.283 |
5.2.2 Continuum observations and scattered light
An issue that had to be addressed in the course of this analysis is the potential influence of dust-scattered stellar light on the intensities of weak nebular emission features such as the O ii ORLs of interest. Unlike PNe, where the size of the emitting region results in relatively small dust columns, the situation is different in H ii regions whose large volumes contain much larger dust columns. The dust effectively scatters light from the nebula’s illuminating stars, which then makes up a major fraction of the observed continuum at UV and optical wavelengths. It is thus possible that emission or absorption features in the spectra of the exciting stars in an H ii region may contaminate the nebular emission spectrum. Peimbert et al. (1993) dealt with this problem in an analysis of the M 42 and M 17 H ii regions. They employed previously published medium resolution (5–7 Å) spectroscopic data in order to derive ORL O2+/H+ abundances; their resolution however was not adequate to allow for the effect of blending of O ii ORLs with other lines e.g. [Fe ii], N iii and C iii, so they resorted to older photographic line intensities in order to estimate the necessary corrections. Our CCD spectrophotometry is of significantly higher resolution (1, 1.5 and 2 Å for the coverage of O ii ORLs) and our line intensities were consistently corrected for blends with other nebular emission lines.
In order to investigate the potential effect of dust-scattered stellar light on the nebular line fluxes, we have measured the continuum emission at 4089 Å and 4650 Å, which coincide with the strongest 3d–4f O ii transition at 4089.3 Å, and O ii multiplet V 1 ORLs, respectively. In Table 8 the continuum intensity, , and the scattered light contribution, , to the observed continuum are presented. The observed continuum is mainly due to two components: the nebular atomic continua and dust-scattered starlight, so that,
where represents the sum of the H i and He i atomic continua calculated using emissivities from Storey & Hummer (1995) and Brown & Mathews (1970), respectively; the , and He+/H+ for each object were taken into account. We find that for M 17, dust-scattered light accounts for 78 percent and 69 percent of the observed continuum at 4089 Å and 4650 Å, respectively; for NGC 3576 these values are 87 percent and 82 percent; for 30 Doradus the corresponding values are 74 percent and 67 percent; for LMC N11B they are 85 percent and 83 per cent; finally, for SMC N66 they are 86 percent and 85 percent, respectively (sky-subtraction has not been carried out; the sky contribution was estimated to be negligible for these dark of Moon conditions).333A typical dark-of-Moon sky brightness at (4400 Å) is 22m.8 per arcsec2 corresponding to 4.73 10-18 erg s-1 cm-2 Å-1 arcsec-2 when = 0 is 6.24 10-9 erg s-1 cm-2 Å-1; thus for e.g. 30 Doradus the sky contribution to the observed continuum at 4650 is 0.082 per cent only.
In Table 9 we present estimated equivalent widths, , for stellar lines in absorption (in mÅ) in the observed nebular continuum, given by,
| (1) |
with the continuum intensity values being those given in Table 8. This analysis pertains to the stellar content of 30 Doradus in the following way: according to Walborn & Blades 1997 (WB97), the visually brightest stars in the 30 Doradus association are B-type supergiants, along with the Of-type star R 139 (= Parker 952). Therefore, we will assume that such stellar spectra dominate the observed dust-scattered light. We have singled out seven stars which are the brightest in the central 1 arcmin2 of the cluster (excluding the compact core R 136): R 137 = P 548 [B0.7–1.5 I, = 12.14]; R 138 [A0 Ia, = 11.87]; R 139444Whereas Moffat et al. (1987) and Moffat (1989) classify R 139 as a WNL/Of-type binary system, WB97 classify it as a O7 Iafp-type single star. Our spectrum shown in Fig. 2 is of higher resolution than the one of WB97 and supports a classification of O6.5 Ib(f) + WNL for R 139. = P 952 [WNL + Of, = 11.94]; R 140 = P 877, 880 [WN + WC, = 12.22, 12.79]; R 141 = P 1253 [BN0.5 Ia, = 12.57]; R 142 = P 987 [B0.5–0.7 I, = 11.91]; and P 767 [O3 If*, = 12.87].
We have high resolution spectrograms (at 0.9 Å/pix) of R 139 (Fig. 2) and R 140 (Fig. 3), since they fell on our slit; the remaining five stars were positioned on either side of it. It is assumed that the spectra of R 137 and R 142 are similar to that of Parker 3157 ( = 12.47; Parker et al. 1992)555Parker et al. (1992) classify P 3157 as spectral type BC1 Ia. However, our analysis of its spectrum (Fig. 4) does not reveal the presence of any C iii lines at 4650 Å. The absorption features at that wavelength can be fitted purely by O ii V 1 multiplet lines. We therefore suggest a revised spectral type of B1 Ia for P 3157. a supergiant belonging to the LMC LH 10 (N11) association, whose spectrogram (at 0.9 Å/pix) was extracted from our LMC N11B frames (Fig. 4). High resolution spectra of R 141 and P 767 can be found in WB97; we do not have a spectrum of R 138, but we can safely assume that it is featureless at the wavelengths of interest judging from its spectral type.
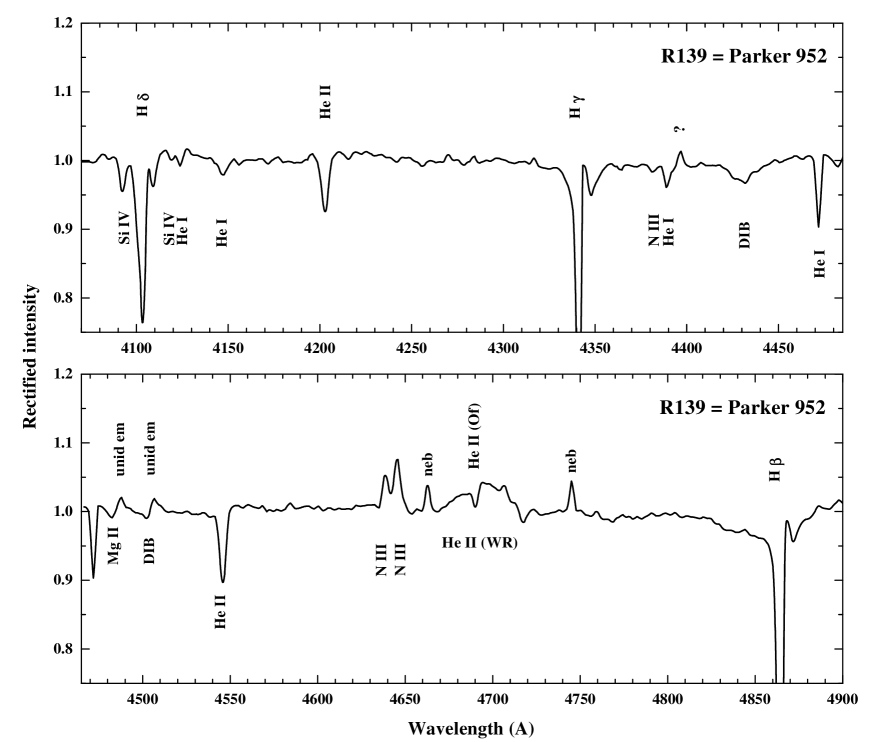
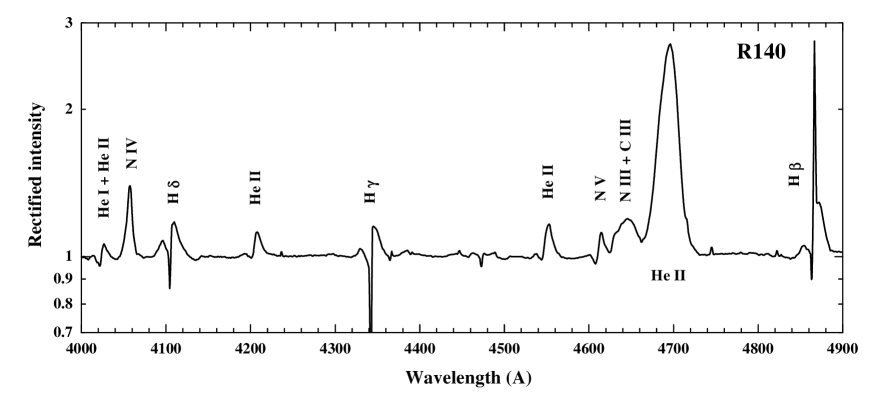
| 30 Doradus | LMC N11B | |||
|---|---|---|---|---|
| 4072 | 185 | 107 | * | * |
| 4089 | 57 | 87 | 151 | 98 |
| 4640 | 637 | 37 | 286 | 167 |
| 4650 | 540 | 185 | 264 | 298 |
| 4661 | 238 | 40 | 121 | 78 |
The O ii spectrum reaches a sharp maximum in absorption in stars of early-B spectral type (e.g. Walborn & Fitzpatrick 1990), thus the very existence of B-type supergiants in nebulae complicates the analysis of nebular O ii ORLs. It is therefore recommended that fields of view relatively clear of such stars are chosen for future weak-emission line analyses of H ii regions. The stellar absorption and/or emission features that are of relevance to this analysis are: Si iv + O ii 4089, N iii + O ii 4638, 4640, C iii + O ii 4650 and O ii 4661.
Values of were estimated at wavelengths of interest on the stellar spectrograms mentioned above and subsequently averaged, weighted according to the brightness ratios of the seven illuminating stars in the blue wavelength region, i.e., 5.6 : 6.3 : 4.3 : 6.8 : 3.2 : 9.8 : 1.0 (for R 137 : R 138 : R 139 : R 140 : R 141 : R 142 : P 767). We have assumed a total-to-selective extinction ratio of = = 5 (Hill et al. 1993) and adopted apparent magnitudes and (–), (–) values from Parker (1993). We were then able to compute the values in Table 9 using Eq. 1. To correct the observations, one should add these to the observed values.
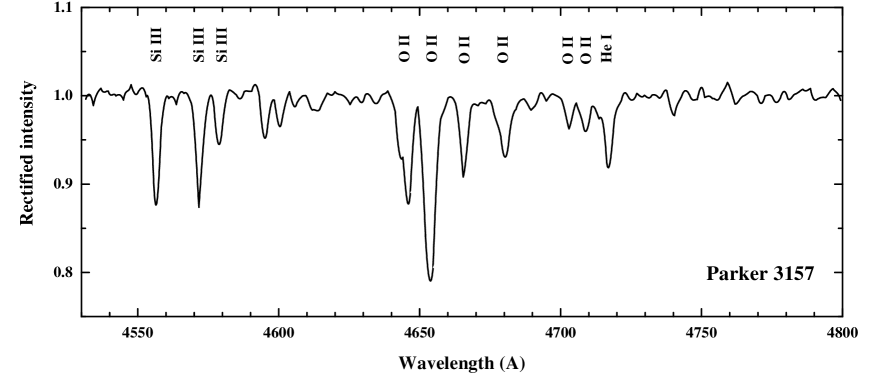
Considering LMC N11B, we found the early-B supergiant Parker 3157, with its extremely rich O ii absorption line spectrum, directly in the field of view of the spectrograph slit (Fig. 4). Absorption lines in the scattered light from this star are responsible for a significant drop in the intensity of the observed continuum in the region of the 4638, 4640, 4649, 4650 and 4661 lines of multiplet V 1. In contrast to 30 Doradus however, the dust-scattered light in N11B does not contain any obvious contribution from Of- and WR-type stars equivalent to e.g. R 139 or R 140 (no Wolf-Rayet stars are listed in the census of N11B by Parker et al. 1992), whose emission lines in the 4650 region can partly compensate absorption lines due to early-B supergiants, resulting in a fairly level continuum at those wavelengths for the former nebula. Therefore, together with the supergiant P 3157, we will assume that the observed continuum in N11B in dominated by the scattered light of six other stars, which are visually the brightest amongst those studied by Parker et al. (1992); they are: P 3209 [O3 III(f*), = 12.66]; P 3252 B2 II, = 11.35]; P 3271 [B1 II, = 12.99]; P 3070 [O6 V, = 12.75]; P 3223 [O8.5 IV, = 12.95]; and P 3120 [O5.5 V ((f*)), = 12.80]. High resolution rectified spectrograms for these stars were presented by Parker et al. and were used to estimate mean values. More accurate measurements were possible for P 3157 for which we have a digital spectrogram. A cross-comparison between our digital spectrogram and those presented by Parker et al. (1992), including P 3157, shows agreement, pointing towards a reliable estimate of the s.
In Table 10 we present the measured intensities and the derived abundances from
O ii ORLs for all five H ii regions, before any correction for
scattered light contamination. Along with values obtained from individual
transitions, abundances derived from total multiplet intensities are also
listed (in bold face) and are discussed in more detail below for each object.
In the context of that discussion revised abundance ratios are then presented,
incorporating corrections for the effects of the scattered stellar continua on
the measured
nebular emission line intensities wherever possible.
| Mult. | |||
| (Å) | (10-4) | ||
| M 17 | |||
| 4638.86 | V1 | .1056 | 10.26 |
| 4641.81 | V1 | .1524 | 5.87 |
| 4649.13 | V1 | .1375 | 2.78 |
| 4650.84 | V1 | .0871 | 8.46 |
| 4661.63 | V1 | .1043 | 7.93 |
| 4676.24 | V1 | .0630 | 5.70 |
| V 1 3s4P-3p4Do | 0.650 | 5.41 | |
| 4317.14 | V2 | .1115: | 14.82: |
| 4319.63 | V2 | .0330 | 4.07 |
| 4345.56 | V2 | .0670 | 8.55 |
| 4349.43 | V2 | .1070 | 5.67 |
| V 2 3s4P-3p4Po | 0.207 | 5.95 | |
| Adopted | 5.68 | ||
| NGC 3576 | |||
| 4638.86 | V1 | .0509 | 4.94 |
| 4641.81 | V1 | .0880 | 3.39 |
| 4649.13 | V1 | .0929 | 1.88 |
| 4650.84 | V1 | .0553 | 5.37 |
| 4661.63 | V1 | .0916 | 6.96 |
| 4676.24 | V1 | .0560 | 5.07 |
| V 1 3s4P-3p4Do | 0.435 | 3.62 | |
| 4069.62 | V10 | .1409: | 5.45: |
| 4072.16 | V10 | .1207 | 5.01 |
| 4075.86 | V10 | .1010 | 2.90 |
| 4085.11 | V10 | .1700 | 3.78 |
| V 10 3p4Do-3d4F | 0.239 | 3.77 | |
| 4087.15 | V48c | .0415 | 13.49 |
| 4089.29 | V48a | .0320 | 2.82 |
| 4275.55 | V67a | .1339 | 9.85 |
| 3d-4f | 0.207 | 7.40: | |
| Adopted | 3.70 | ||
| 30 Doradus | |||
| 4638.86 | V1 | .0640 | 6.11 |
| 4641.81 | V1 | .0854 | 3.23 |
| 4649.13 | V1 | .0642 | 1.28 |
| 4650.84 | V1 | .0641 | 6.12 |
| 4661.63 | V1 | .0565 | 4.23 |
| 4673.73 | V1 | .0120 | 5.80 |
| 4676.24 | V1 | .0224 | 1.99 |
| V 1 3s4P-3p4Do | 0.369 | 2.97 | |
| 4317.14 | V2 | .0705 | 6.96 |
| 4319.63 | V2 | .0876 | 10.91 |
| V 2 3s4P-3p4Po | 0.158: | 8.42: | |
| 4414.90 | V5 | .0331: | 6.27: |
| 4416.97 | V5 | .0436: | 14.8: |
| V 5 3s2P-3p2Do | 0.033: | 6.27: | |
| 4069.89 | V10 | .1328 | 5.14 |
| 4072.16 | V10 | .0683 | 2.84 |
| 4078.84 | V10 | .0324 | 8.86 |
| 4085.11 | V10 | .0258 | 5.74 |
| V 10 3p4Do-3d4F | 0.259 | 4.47 | |
| 4132.80 | V19 | .0508 | 9.29 |
| Mult. | |||
| (Å) | (10-4) | ||
| 4153.30 | V19 | .0609 | 7.80 |
| 4156.53 | V19 | .0232: | 18.6: |
| V 19 3p4Po-3d4P | 0.112 | 8.41: | |
| 4110.78 | V20 | .0322: | 13.4: |
| 4906.83 | V28 | .0369: | 14.8: |
| 4083.90 | V48b | .0108 | 3.41 |
| 4087.15 | V48c | .0185 | 6.17 |
| 4089.29 | V48a | .0210 | 1.90 |
| 4275.55 | V67a | .0785: | 5.33: |
| 4288.82 | V53c | .1091: | 11.85: |
| 4303.83 | V53a | .0519: | 9.97: |
| 4313.44 | V78a | .0383: | 28.5: |
| 4315.69 | V63c | .0533: | 43.2: |
| 4609.44 | V92a | .0209 | 3.35 |
| 3d-4f | 0.071 | 3.03 | |
| Adopted | 3.49 | ||
| LMC N11B | |||
| 4638.86 | V1 | .1170 | 11.24 |
| 4641.81 | V1 | .0530 | 2.02 |
| 4649.13 | V1 | .0760 | 1.52 |
| 4650.84 | V1 | .0631 | 6.06 |
| 4661.63 | V1 | .0640 | 4.81 |
| 4673.73 | V1 | .0308 | 14.93 |
| 4676.24 | V1 | .0271 | 2.43 |
| 4696.35 | V1 | .0346 | 24.07 |
| V 1 3s4P-3p4Do | 0.466 | 3.14 | |
| 4349.43 | V2 | .0871 | 4.60 |
| V 2 3s4P-3p4Po | 0.087 | 4.60 | |
| 4072.16 | V10 | .1027 | 4.27 |
| V 10 3p4Do-3d4F | 0.103 | 4.27 | |
| 4153.30 | V19 | .0982 | 12.54 |
| V 19 3p4Po-3d4P | 0.098 | 12.54 | |
| 4089.29 | V48a | .1305 | 11.41 |
| 3d-4f | 0.131 | 11.41 | |
| Adopted | 7.19 | ||
| SMC N66 | |||
| 4638.49 | V1 | .0311 | 2.91 |
| 4649.13 | V1 | .0545 | 1.06 |
| 4650.84 | V1 | .0513 | 4.78 |
| 4661.63 | V1 | .0800 | 5.84 |
| V 1 3s4P-3p4Do | 0.217 | 2.15 | |
| Adopted | 2.15 | ||
-
a Values followed by ‘:’ have not been used when adopting mean abundance ratios.
M 17: The two triplet 3s–3p multiplets V 1 and V 2 are
detected, yielding similar results. The mean O2+/H+ abundance ratio is
5.68 10-4. Peimbert et al. (1993) have derived a very similar
value of 4.85 10-4 using multiplets V 1 and V 5 after correcting
the line intensities for underlying absorption due to dust-scattered stellar
light. We have not taken into account such an effect for this nebula, since
Peimbert et al.’s corrections amount to only 14 per cent for multiplet V 1,
the one affected the most. A comparison with the forbidden-line abundance from
Table 3 yields an ORL/CEL abundance ratio of 2.1 for O2+ (§7.1,
Table 12).
NGC 3576: Multiplets V 1 and V 10 yield consistent results;
lines from the 3d–4f group display abnormal intensity ratios. It is likely
that underlying absorption is affecting the 4089 transition. We do not
attempt any corrections and adopt for the ORL O2+/H+ ratio the mean of
the V 1 and V 10 results, i.e. 3.70 10-4. The ORL/CEL ratio for
O2+ in this case is
1.8 (Table 12).
30 Doradus: We have detected lines from the 3p–3d multiplets V 10, V 19, V 20, as well as from the 3s–3p multiplets V 1, V 2, V 5, and several transitions from the 3d–4f group. Abundances derived from V 2 and V 19 agree very well with each other, but are about a factor of 2.8 higher than those derived from multiplet V 1 and 88 per cent higher than those from multiplet V 10. The relative intensities amongst the multiplet V 19 components are in good agreement with theory (Table 7), apart from 4156.63 ( = 5/2–3/2), which is a factor of 2 stronger than expected relative to 4132.80 ( = 1/2–3/2), probably as a result of blending.666This is a ratio of lines originating from the same upper level and thus invariably fixed by the ratio of their transition probabilities; the fact that it is observed to differ between several nebulae (e.g. NGC 3242, 3918, 5882, 6153 and 30 Doradus) by a factor of more than 4 suggests that blending with an unknown line affects the 4156 line. The V 1 lines were discussed in the previous subsection. This abundance discrepancy is quite striking, since from observations of 10 PNe (Tsamis et al. 2002b) we have found that on average multiplet V 2 yields O2+ abundances that are 24 per cent lower than those from V 1 lines. Furthermore, O2+ abundances from multiplets V 10 and V 19 generally agree to within 40 per cent. Case dependence does not seem to be an issue since multiplets V 1 and V 10 are almost insensitive to optical depth effects, while it is estimated that multiplets V 2 and V 19, which are assumed here to be under Case B, would yield even higher abundances under Case A.
A single line from V 20 is detected, 4110.78 ( = 3/2–1/2), which yields a similar abundance to those from the V 2 and V 19 lines; the remaining V 20 lines coincide with He i 4120.84 and cannot be reliably used to derive an independent abundance estimate. Of the two detected multiplet V 5 lines, 4416.97 ( = 1/2–3/2) is most probably blended with [Fe ii] 4416.27 and is excluded from the analysis, while 4414.90 ( = 3/2–5/2) yields an abundance ratio rather consistent with that from the multiplet V 10 lines.
Multiplet V 2 is fed from high-lying terms via 4Po–4D 4119 (V 20) and less via V 19 transitions. Multiplet V 19 arises from the 3d 4P term which can be reached via resonance transitions from the O+ 2p3 4So ground state – e.g. the 2p3 4So–3d 4P 430 line – themselves excited by resonance fluorescence, either by starlight or by another nebular emission line. Along with resonance scattering, the excited O ii 3d 4P level will decay emitting cascade line photons via the multiplets 4So–4P 4924 (V 28), 4Po–4P 4153 (V 19) and 4Do–4P 3907 (V 11), with multiplet strength ratios of about 26.9 : 18.5 : 1.0. The strongest line of V 28, 4924.53 ( = 3/2–5/2), coincides in wavelength with [Fe iii] 4924.50 and is blended with the much stronger He i 4921.93 line at the resolution of our observations. The second strongest component of V 28, 4906.83 ( = 3/2–3/2), is detected in our spectra, yielding an even higher abundance ratio than the V 19 lines, by 70 per cent. There is therefore marginal evidence—based on results from V 28 and V 19—that the population of the 3d 4P term is enhanced by resonance fluorescence from the ground state; this might explain the overabundances derived from these lines compared to multiplet V 1 results; V 1 itself is on a cascade route not affected by line fluorescent excitation. However, the single 4110.78 (V 20) line, which also produces an overabundance yields results consistent with V 19, while its upper 3d 4D term cannot be reached via permitted transitions from the ground state. It is thus possible that stellar continuum-fluorescence, rather than nebular line-fluorescence is instead responsible for this pattern of intensity enhancements. From a model analysis of the permitted emission line spectrum of Orion, Grandi (1976) surmised that starlight excitation via the 430 resonance line contributes only 20 per cent as much as recombination to the 4153 (V 19) line, while he did not discuss the potentially worse affected 4906, 4924 (V 28) lines; perhaps in 30 Doradus that contribution is larger. Due to their possible contamination by line or continuum fluorescence, V 19 and V 28 multiplet lines will be excluded from our abundance analysis.
Regarding the detected 3d–4f transitions of O ii, several of them are evidently blended with [Fe ii] and/or Fe ii lines and were omitted from further consideration. The 3d–4f O ii ORLs are insensitive to optical depth effects and for a significant number of PNe their strengths have consistently proven to be in excellent agreement with theoretical predictions under an intermediate coupling scheme (cf. Liu et al. 1995a, 2000, 2001b; Tsamis et al. 2002b). From this growing body of work it has emerged that for eleven thoroughly-analysed PNe the O2+/H+ abundance ratios derived from the best detected 3s–3p transitions (those of multiplet V 1) are lower than those from 3d–4f lines by up to 50 percent. This discrepancy is removed however if we assume that these heavy element ORLs arise from ionized regions of very low electron temperature, of the order of K, much lower than those indicated by the H i recombination continuum Balmer discontinuity, just as one would expect for a dual abundance nebular model (Liu 2002b; Péquignot et al. 2002b; Tsamis 2002). Transitions of the 3d–4f group are close to hydrogenic in nature and the one amongst them with the highest total angular momentum quantum number (4089, upper state = 11/2) is not affected by a change of coupling scheme (Storey 1994; Liu et al. 1995a). Furthermore, their upper terms cannot be reached by permitted resonance lines and are thus unaffected by fluorescence effects. Overall, the 3d–4f lines are the best ORL indicators of O2+/H+ abundances. In 30 Doradus the strongest expected 3d–4f line at 4089.13 Å is abnormally weak compared to other 3d–4f lines (Table 7); as a consequence, the abundance ratio derived from this line alone is lower than that from the V 1 lines, by 36 per cent. This is in stark contrast with the standard observed behaviour of these two sets of lines as outlined above.
An explanation for this result may involve the effect of dust-scattered stellar light on the nebular line intensities. Based on observations of the scattered light continuum described previously, we have estimated upward corrections to the observed emission line intensities for 30 Doradus (Table 9); these amount to 58 per cent (4072); a factor of 2.5 (4089); 6 per cent (4638, 4640); 34 per cent (4649, 4650); and 17 per cent (4661), respectively. The resulting corrected O2+/H+ values from the various multiplets (Table 11) then display the more regular pattern already established from the PN analysis; multiplet V 1 results are now 25 per cent lower than those from the co-added 3d–4f transitions and 20 per cent lower than those from the 4072 V 10 line. Corrected line intensities and resulting O2+/H+ abundance ratios are presented in Table 11. Before any corrections, the O2+/H+ ORL abundance is 3.49 10-4, while after incorporating the corrections it becomes 4.67 10-4.
For 30 Doradus, the derived ORL/CEL abundance ratio for O2+ is 2.0 before
correction for underlying stellar absorption lines; after the corrections the
ratio is 2.7 (Table 12).
LMC N11B: In this nebula too the emission line spectrum is contaminated by the scattered continuum of illuminating stars. Regarding the nebular O ii ORLs, lines of multiplet V 1 are affected the most. According to our calculations presented in Tables 8 and 9, the following upward corrections to the observed nebular intensities have been estimated: 65 per cent (4089); 58 per cent (4638, 4640); a factor of 2.1 (4649, 4650); and 64 per cent (4661). The corrected line intensities and resulting O2+/H+ abundance ratios for this nebula are listed in Table 11. The O2+/H+ ORL abundance before any correction is 7.19 10-4, while that after is 12.0 10-4.
Therefore, for this nebula the ORL/CEL abundance ratio for O2+ is 4.9 before
the corrections for absorption, while it rises to 8.2 afterwards (Table 12).
SMC N66: Only the V 1 multiplet lines of O ii are reliably
detected; no corrections for underlying absorption have been estimated.
Co-adding the intensities of the 4638, 4649, 4650 and
4661 transitions, we find an O2+/H+ ORL abundance ratio of
2.15 10-4. The derived O2+ ORL/CEL ratio is 2.3
(Table 12).
| Mult. | |||||
|---|---|---|---|---|---|
| (Å) | (10-4) | (10-4) | |||
| 30 Doradus | LMC N11B | ||||
| 4072.16 | V10 | .1077 | 4.47 | * | * |
| 4638-40 | V1 | .1601 | 4.34 | .2389 | 6.51 |
| 4649-50 | V1 | .1723 | 2.84 | .2964 | 4.91 |
| 4661 | V1 | .0661 | 4.94 | .1050 | 7.89 |
| V 1 3s4P-3p4Do | 0.399 | 3.59 | 0.640 | 5.26 | |
| 4083.90 | V48b | .0108 | 3.41 | * | * |
| 4087.15 | V48c | .0185 | 6.17 | * | * |
| 4089.29 | V48a | .0531 | 4.79 | .2154 | 18.8 |
| 4275.55 | V53c | .0785 | 5.34 | * | * |
| 4609.44 | V92c | .0209 | 3.35 | * | * |
| 3d-4f | 0.182 | 4.76 | 0.215 | 18.8 | |
| Adopted | 4.67 | 12.0 | |||
5.2.3 Uncertainties
Clearly, even though the dust-scattered component to the observed continuum is found to be very high ( 80 per cent typically) and the various absorption/emission EWs were carefully measured, not all stars that contribute to the continuum were located. For instance, 30 Doradus contains the luminous core R 136 whose effect was neglected. The missing stars most likely belong to hotter O3 If∗/WN and WR types (Crowther & Dessart 1998) that have weaker O ii absorption lines. Thus for both 30 Doradus and LMC N11B the underlying stellar absorption-line equivalent widths may be weaker than assumed here. It is therefore likely that our corrections to the observed ORL intensities and the final ORL abundances, in Table 11, are upper limits only in the cases of 30 Doradus and LMC N11B.
6 Spatial variation of nebular properties in 30 Doradus
The high S/N ratio of our observations of O ii ORLs from 30 Doradus (see Fig. 1) prompted us to investigate the abundance discrepancy problem in that nebula by studying the variations of electron temperature, electron density and of the ionic recombination-line C2+/H+ and O2+/H+ abundances and forbidden-line O2+/H+ abundances along the spectrograph slit. The results are presented in this section.
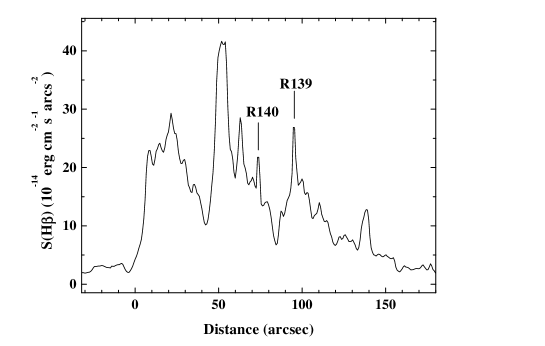
The 30 Doradus slit passed across the stars R 139 and R 140 and the nebular analysis presented thus far is based on a spectrum integrated over a spatial extent of 2 arcmin approximately. This excludes a region of 40 arcsec containing R 139 and R 140, in order to minimize the contribution of dust-scattered starlight to the observed spectrum. In Fig. 5 the H surface brightness distribution of the nebula is plotted against the spatial dimension. Steep variations of the nebular surface brightness are seen. The positions corresponding to R 140 and R 139 are at +73 and +95 arcsec respectively.
For the blue spectra, each pixel along the slit corresponded to 0.74 arcsec on the sky, while the seeing was about 1 arcsec FWHM. For the spatial analysis we used spectra secured with the two overlapping grating set-ups, centred at 4290 Å, covering the C ii 4267 recombination line, H and the [O iii] 4363 CEL, and at 4745 Å, covering the O ii V 1 recombination multiplet at 4650 Å, the [Ar iv] 4711, 4740 density-sensitive doublet, H and the [O iii] 4959 forbidden line. For each grating set-up, spectra were extracted at intervals along the slit, averaged over about 5 pixels each time, so that a substantial S/N was achieved. We wanted to examine the nebular properties as close as possible to stars like R 139 and R 140, so spectra were also extracted in the region between the two, which was not included previously in the integrated spectrum. The individual extractions were brought to scale via their overlapping portions and normalized to flux units such that (H) = 100. We then subtracted the local continuum and measured the fluxes of C ii 4267 and O ii V 1 multiplet recombination lines, as well as the [Ar iv] doublet and [O iii] 4363, 4959 CELs, dereddening them using the extinction constant derived from the integrated spectrum (Section 3.1).
The electron temperature derived from the [O iii] 4959/4363 ratio, as a function of position along the slit, is shown in Fig. 6. The [O iii] 4959 line was saturated on the four 20-min exposures centred at 4745 Å, so its flux was measured on the 5-min high-resolution spectrum. The [O iii] temperature is found to remain practically constant over the region examined here, with a mean value of 9990 K and a standard deviation of 200 K. This is marginally lower than the temperature of 10100 250 K, derived using the line fluxes from the integrated spectrum (Table 3). No evidence for substantial temperature fluctuations is seen.
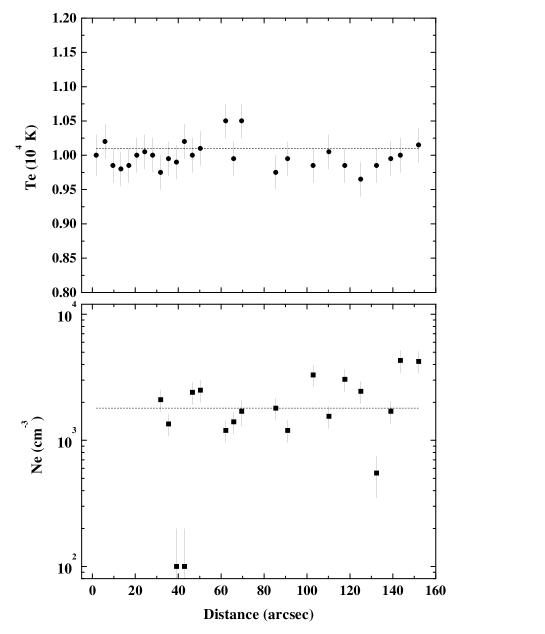
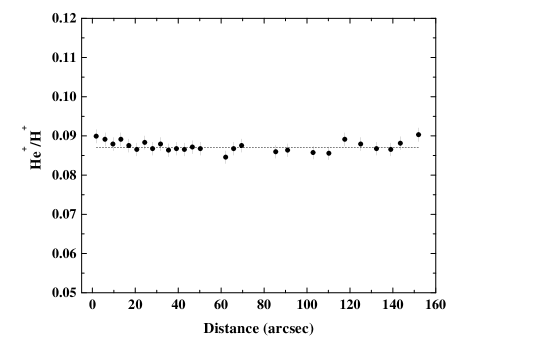
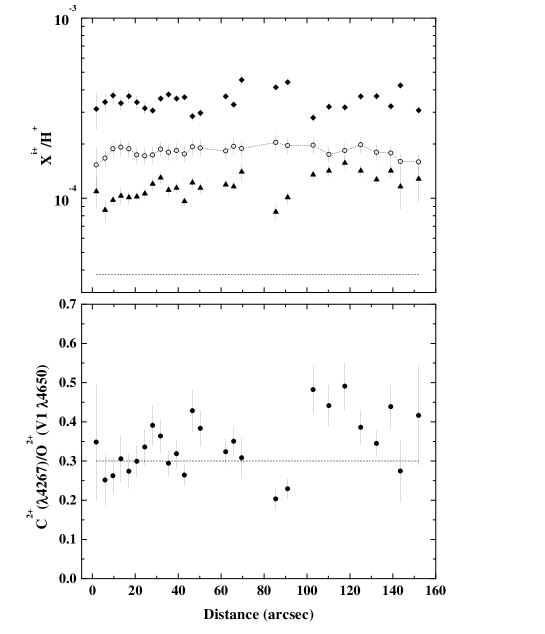
The electron density variation across the nebula has been mapped using the [Ar iv] doublet ratio and is plotted in Fig. 6 as well. The density has a mean value of 1960 cm-3 and a standard deviation of 1220 cm-3. This is in good agreement with the [Ar iv] density of 1800 cm-3 derived from the integrated spectrum (Table 3). There is evidence for a density minimum of = 100 cm-3 at +40 arcsec in Fig. 6, corresponding to a local minimum in the H surface brightness at about +40 arcsec in Fig. 5. Owing to the high critical densities of the 4711, 4740 transitions (14000 and 130 000 cm-3 respectively), the [Ar iv] lines are good tracers of high-density ionized gas, while still sensitive down to cm-3. We see no evidence however of any high-density material at our spatial resolution.
In Fig. 7 the variation of the He+/H+ abundance ratio across the 30 Doradus nebula is presented, derived from the He i 4471 recombination line. The adopted electron temperature was 9990 K. The He+/H+ ratio remains constant over the range plotted here. The helium abundance remains very close to the mean value even in the nebular region between R 139 and R 140.
Fig. 8 shows the spatial variations of the C2+/H+ and O2+/H+ ORL abundances and of the O2+/H+ forbidden-line abundance, derived respectively from the C ii 4267 line, the O ii V 1 multiplet at 4650 Å and the [O iii] 4959 forbidden line. In should be noted that in order to circumvent non-LTE effects that affect abundances derived from individual O ii V 1 components (Section 5.2.1), the total observed intensity of the 4650 multiplet was used to obtain the ORL O2+/H+ ratio. An electron temperature of 9990 K was adopted for the calculation of the ORL abundances, while the point-by-point [O iii] 4959/4363 temperature measurements (Fig. 6) were used for the derivation of the forbidden-line O2+/H+ values.
From Fig. 8 (top) no significant variation in the forbidden-line O2+/H+ abundance across the nebula can be discerned. Over the whole range plotted O2+/H+ has an average value of 1.83 10-4 and a standard deviation of 1.10 10-5. The forbidden-line abundance remains consistently lower than the ORL O2+/H+ abundance across the plotted range, by a factor of 2. The C2+/H+ abundance derived from the collisionally-excited C iii] 1908 intercombination doublet (Dufour et al. 1982) is also consistently lower than the mapped ORL abundances of doubly ionized carbon. Could temperature fluctuations account for these discrepancies? At the spatial resolution of our mapping, there is no evidence of [O iii] temperature fluctuations of a sufficient magnitude to cause this. An electron temperature of 8200 K would be needed in order to force the forbidden-line O2+/H+ abundances to become equal to the recombination-line abundances. This would necessitate the existence of fluctuations from the mean temperature (9990 K) of about 18 per cent or – in the terminology of Peimbert (1967) – a temperature fluctuation parameter , which is however not deduced from our spatial analysis. We note, however, that while the above observations place constraints upon temperature fluctuations in the plane of the sky, along our slit, fluctuations along the line of sight though the nebula are not constrained by this method. Rubin et al. (2002) discuss this point in more detail, in the context of HST observations of the planetary nebula NGC 7009.
Fig. 8 also presents, for the first time to our knowledge for an extragalactic H ii region, the spatial variation of the C2+/O2+ ratio derived purely from ORLs. The C2+/O2+ ratio across the nebula has a mean value of 0.33 and a 1 error of 0.02. This is in excellent agreement with the value of 0.30 derived from the integrated spectrum. This latter value was calculated adopting as the O2+/H+ abundance the value derived from the V 1 multiplet (Table 10), while the mean C2+/H+ abundance is taken from Table 5. The O2+ V 1 abundances that were used for Fig. 8 are those before any correction is made for underlying absorption at 4650 Å in the scattered-light continuum. Such a correction is estimated to raise the O2+ recombination-line abundance by a factor of 1.34 (Section 5.2.2). An interesting feature of our spatial analysis of heavy-element ORLs is that there is tentative evidence for a local minimum in the C2+/O2+ ratio, derived purely from ORLs, in the nebular region between the massive stars R 139 and R 140. The relevance of this result is discussed in following section.
7 Discussion
7.1 ORL/CEL abundance discrepancies and elemental ratios
It is clear from the above analysis and Table 12 that substantial ORL versus CEL abundance discrepancies are present, not only in planetary nebulae, but in H ii regions too.
Discrepancies were reported for M 42 and M 17 by Peimbert et al. (1993), for both of which they found an ORL/CEL factor of 1.7 for the O2+ ion. Esteban et al. (1998) found ORL/CEL discrepancy factors of 1.4–1.6 and 2.2, respectively, for O2+ and C2+ in the Orion nebula [adopting C2+(1908)/H+ CEL abundances from Walter et al. 1992]. Our unpublished long-slit spectra, obtained at the AAT 3.9-m and ESO 1.52-m telescopes, show a factor of only 1.3 discrepancy for O2+ in that nebula, but imply an ORL/CEL C2+ discrepancy of 2.4, when compared with Walter et al.’s IUE results for C iii] 1908. For the H ii region M 8, Esteban et al. (1999) reported a factor of two discrepancy between the recombination-line O2+ abundance and its forbidden-line value. A CEL abundance study of the Gum 38a complex, which contains NGC 3576, has been made by Girardi et al. (1997), but no detection of C ii 4267 or any other heavy element optical recombination line was reported. Owing to its high reddening, NGC 3576 was never observed by the IUE either, so no comparison can be made with the ORL C2+/H+ abundance ratio reported here.
Table 12 shows that the ORL/CEL O2+ discrepancy factors, , for our H ii regions are: 2.1, 1.8, 2.0–2.7, 4.9–8.2 and 2.3, for M 17, NGC 3576, 30 Doradus, LMC N11B and SMC N66 respectively. Even if we adopt the lower ORL abundances for 30 Doradus and N11B (i.e. neglect corrections for any underlying absorption in the dust-scattered continuum), the mean discrepancy factor is 2.6. LMC N11B displays the largest discrepancy documented so far for an H ii region (= 4.9), in the neighborhood of the mean value (= 5.1) that we have found for a sample of eighteen PNe (Tsamis et al. 2002b). How is one to explain such an extreme discrepancy for an H ii region?
| Sunb | M 42c | M 17 | NGC 3576 | 30 Doradus | LMC N11B | SMC N66 | ||
|---|---|---|---|---|---|---|---|---|
| 10O/H | (cels) | 4.90 | 3.32 | 3.59 | 3.31 | 2.17 | 2.59 | 1.28 |
| (O2+) | (orl/cel) | * | 1.3 | 2.1 | 1.8 | 2.0–2.7 | 4.9–8.2 | 2.3 |
| (C2+) | (orl/cel) | * | 2.4 | * | * | 2.6d | * | * |
| C2+/O2+ | (orls)e | 0.50 | 0.77 | 0.77 | 0.78 | 0.25 | 0.25 | |
| N2+/O2+ | (orls)e | 0.19 | 0.15 | 0.62 | 0.71 | * | * | |
| N2+/O2+ | (IR cels)f | 0.19 | 0.19 | 0.19 | 0.16 | 0.060 | 0.075 | * |
| N+/O+ | (cels) | 0.19 | 0.15 | 0.088 | 0.11 | 0.036 | 0.033 | 0.016 |
| Ne/O | (cels) | 0.25 | 0.18 | 0.28 | 0.16 | 0.21 | 0.16 | 0.18 |
| S/O | (cels) | 0.033 | 0.028 | 0.027 | * | 0.027 | 0.019: | 0.018 |
| Ar/O | (cels) | .0074 | .011 | .0057 | .0078 | .0065 | .0078 | .0053 |
| 10O2+/H+ | (Opt cels) | * | 2.26 | 2.66 | 2.21 | 1.76 | 1.47 | 0.94 |
| 10O2+/H+ | (IR cels)g | * | 1.66 | 1.80 | 2.68 | 2.21 | * | * |
- a
-
All nebular data are from this paper, apart from those in rows 6 and 12, and the data in rows 7–10 for M 42.
- b
-
Solar elemental ratios adopting log (X/H) + 12.0 = 8.69 and 8.39 for X = O and C (Allende Prieto et al. 2001, 2002), together with N, Ne, S, Ar abundances from Grevesse et al. (1996).
- c
-
Entries 1–5 and entry 11 from our unpublished data; entries 7–10 from Esteban et al. (1998).
- d
-
Adopting a CEL C2+/H+ abundance of 3.4410-5 (Dufour et al. 1982).
- e
-
No corrections for scattered light absorption features have been implemented in obtaining the listed nebular ORL C2+/O2+ and N2+/O2+ ratios.
- f
-
From Simpson et al. (1995) for M 17, NGC 3576 and 30 Dor; from Rubin et al. (1988) for M 42; value for LMC N11B derived from the [O iii] 52- and 88-m and [N iii] 57-m fluxes in ISO LWS spectrum TDT60901217. Note that the positions at which these IR data were obtained were not the same as for our optical long-slit spectra.
- g
-
From Simpson et al. (1995) for M 17, NGC 3576 and 30 Dor; from Rubin et al. (1991) for M 42.
Before commenting on this issue, we consider the derived elemental abundance ratios presented in Table 12 for this sample of H ii regions, where they are compared with solar values. The C2+/O2+ and N2+/O2+ ratios are purely from ORL lines and should be almost completely unaffected by temperature variations. They should give a good measure of the C/O and N/O ratios – especially the latter since for these relatively high-excitation H ii regions, the N2+ and O2+ zones occupy almost the entire H+ zone (Shaver et al. 1983; Simpson et al. 1995). From Table 12, we see that the agreement between the C2+/O2+ ratios for the three galactic nebulae is excellent, with the mean value of 0.77 being 50 per cent higher than the solar value of Allende Prieto et al. (2001, 2002).
The ORL N2+/O2+ and CEL N2+/O2+ and N+/O+ ratios listed for M 42 in Table 12 are in good agreement. Our N2+/O2+ ORL results for M 17 and NGC 3576 are much higher than the respective CEL N2+/O2+ ratios, by factors of 3–4.5, while they are larger than the N+/O+ CEL ratios as well. There is the strong possibility however that the N ii ORLs used for these two nebulae yield unreliable abundances because they are affected by fluorescence effects. Grandi (1976) showed that for Orion the N ii multiplets V 3, V 5 and V 30 are excited by fluorescence via the He i 508.6 resonance line. In the current study, N2+/H+ abundances for M 17 and NGC 3576 have been derived from N ii multiplets V 3 and V 5 (Table 6). On the other hand, Liu et al. (2001b) showed that the observed N ii ORL intensity ratios for the planetary nebulae M 1-42 and M 2-36 are inconsistent with fluorescent line-excitation of the N ii V 3 and V 5 lines and proposed that continuum fluorescence by starlight is a more plausible cause. In any case, it seems probable that fluorescence of some sort contributes to the excitation of the N ii V 3 and V 5 triplet lines observed from M 17 and NGC 3576. Unfortunately, the N ii 3d–4f high-lying transitions, which are generally not biased by this effect, have not been detected from either M 17 or NGC 3576; their measurement would offer a means of checking the fluorescence hypothesis. However, the ORL N2+/O2+ ratio for M 42 listed in Table 12 was based on our observations of N ii 3d–4f and singlet lines, and so should be unaffected by fluorescence effects, consistent with the agreement found between the ORL N2+/O2+ and CEL N2+/O2+ and N+/O+ ratios for this nebula.
For the two LMC nebulae, the C2+/O2+ ORL ratios are in excellent agreement, their value of 0.25 being only 11 per cent smaller than the mean CEL C/O ratio of 0.28 found for LMC H ii regions by Kurt & Dufour (1998). In addition, their N+/O+ ratios are in excellent agreement with the mean CEL N/O ratio of 0.035 for the LMC found by the same authors, though smaller than the N2+/O2+ ratios found for the same two nebulae from far-IR CELs. Finally, for SMC N66 our C2+/O2+ ORL upper limit is consistent with the SMC mean CEL C/O value of 0.15 (Kurt & Dufour), although our CEL N+/O+ ratio of 0.016 is only 46 per cent of Kurt & Dufour’s mean CEL N/O ratio of 0.035 for the SMC.
From the above comparisons an important conclusion can be drawn: it seems that the C/O abundance ratio derived from ORLs is equal within the uncertainties to the same ratio derived from CELs, both for the galactic nebulae and, as quoted by Kurt & Dufour, for the Magellanic Cloud nebulae as well (a similar conclusion appears to apply to N/O ratios too, provided care is taken in the choice of the N ii ORLs used to derive N2+ abundances). Similar results for C/O, N/O and Ne/O have been reported for planetary nebulae (Liu et al. 1995a, 2000, 2001b; Mathis, Torres-Peimbert & Peimbert 1998; Luo, Liu & Barlow 2001). Apart from the obvious observation that this strengthens the reliability of C/O or N/O ratios derived from either pure CEL or pure ORL abundance analyses, it also raises important questions regarding the chemical history of the ORL-emitting medium with respect to that of the ‘normal’ CEL-emitting nebular component, given that they appear to have similar C/O, N/O and Ne/O ratios.
7.2 Potential causes of the ORL/CEL abundance discrepancies
7.2.1 The case against temperature fluctuations
The existence of temperature fluctuations within the nebular volumes has been long thought to offer an obvious solution to the conundrum of discrepant ORL versus CEL abundances, both for PNe and H ii regions. Temperature fluctuations within a nebula can lead to enhanced emission of the temperature-sensitive, high-excitation energy [O iii] 4363 transition from the hotter nebular regions. As a result, the electron temperature deduced from the net [O iii] (4959 + 5007)/4363 intensity ratio would be biased towards the hotter regions and would lead to too low an O2+ abundance being derived from the net nebular spectrum. The Peimbert (1967) temperature fluctuation parameter, , derived from a comparison between the hydrogen BJ and [O iii] forbidden-line temperatures is 0.011 and 0.017 for M 17 and NGC 3576, respectively (Table 3). On the other hand the ORL/CEL O2+ discrepancy factors for these two nebulae of 2.1 and 1.7, respectively, would require values of 0.038, i.e. considerably larger.777On the other hand, Liu et al. (1995b) found very similar values of Te(O iii) and Te(BJ) for M 42, the nebula in Table 12 with the smallest O2+ ORL/CEL discrepancy factor (= 1.3). For the three Magellanic Cloud nebulae the factors implied by the abundance discrepancies are even greater, reaching the uncomfortably high value of 0.1 in the case of LMC N11B, very similar to the value needed to reconcile ORL and CEL O2+ abundances for the rather extreme planetary nebula NGC 7009 (Liu et al. 1995a). This is a factor of 10 larger than typical values predicted by photoionization models of chemically and density homogeneous nebulae, which yield 0.01 (Garnett 1992; Gruenwald & Viegas 1995; Kingdon & Ferland 1995b). As in the case of planetary nebulae, it seems unlikely that temperature fluctuations are to blame for the discrepancies observed here, especially for extreme objects like LMC N11B.
If temperature fluctuations were indeed responsible for the low heavy element ion abundances deduced from optical CELs compared to those derived from ORLs (see rows 2 and 3 of Table 12), one would then expect infrared CELs to yield abundances similar to the high values obtained from ORLs, due to the low excitation energies of IR fine structure transitions and their consequent lack of sensitivity to temperature fluctuations at typical nebular temperatures. The last two rows of Table 12 compare O2+/H+ CEL abundances derived from our optical spectra with those derived by Rubin et al. (1988) and Simpson et al. (1995) from infrared fine structure line observations of four of the nebulae. For M 42 and M 17, the IR CEL lines yield O2+/H+ abundances which are 27 per cent and 32 per cent smaller than those obtained from our optical CEL observations, while for NGC 3576 and 30 Doradus the IR CEL lines yield O2+/H+ abundances which are 21 per cent and 26 per cent larger than those from the optical CEL data. These differences of only 20–30 per cent are close to the 20 per cent uncertainties estimated by Simpson et al. for the radio free-free fluxes (that measure H) falling in the Kuiper Airborne Observatory (KAO) beam used for the far-infrared line observations. It should be noted that the positions in the nebulae that were observed at far-infrared wavelengths with the KAO usually did not coincide with the positions covered by our optical long-slit observations. However, spatial abundance variations within these H ii regions have never been detected, as exemplified by our own spatially-resolved abundance analysis of 30 Dor (Section 6).
We therefore conclude that the agreement found between the O2+/H+ abundances derived from optical and infrared CELs rules out temperature fluctuations as the cause of the factor of two discrepancy found between ORL and CEL O2+/H+ abundances for M 17, NGC 3576 and 30 Doradus. On the other hand, the large derived for LMC N11B from the ORL/CEL O2+ ratio would imply temperature fluctuations that cannot be explained by chemically and density homogeneous nebular models.
7.2.2 The case against high-density clumps and in favour of metal-rich inclusions
High density ionized clumps with 105 cm-3 embedded in a medium of lower density could lead to high ORL C, N and O abundances, via an effect of pseudo-temperature fluctuations, whereby the observationally derived [O iii] temperature is significantly overestimated due to collisional quenching of the nebular 4959, 5007 lines (Viegas & Clegg 1994). Such high density clumps would also quench emission in the low critical density far-IR lines of [O iii] and [N iii], leading to lower abundances being deduced from infrared CELs than from ORLs.
HST images of the Orion nebula show numerous clumpy microstructures surrounded by more or less uniform nebulosity. Walsh & Rosa (1999) reported HST observations of a partially ionized globule and a filament in the Orion nebula that displays high densities of up to 5 106 cm-3. They did not however publish the density-sensitive diagnostic. They also commented that in the core of the nebula the filaments contribute half the [N ii] emission, but only 10 per cent of the Balmer line flux. The existence of high-density, partially ionized condensations with 106 cm-3 has also been postulated by Bautista, Pradhan & Osterbrock (1994) in order to explain abnormalities in the emission spectrum of [Fe ii] in the Orion nebula. Independent observations by Esteban et al. (1998) and Baldwin et al. (2000) however, showed that [Fe ii] lines are formed in lower density gas along with [O i] lines. Finally, as Lucy (1995) and Verner et al. (2000) discuss, the formation of [Fe ii] emission lines is affected by radiative pumping fluorescence processes in ways that render them unsuitable as straightforward density diagnostics for H ii regions.
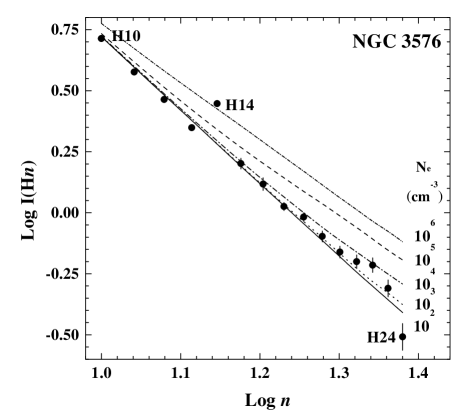
In Fig. 9 we plot the reddening-corrected intensities of high-order H i Balmer lines from our high resolution (1 Å) spectrum of NGC 3576 and compare them with theoretical predictions for various nebular electron densities (Storey & Hummer 1995). Since such lines are sensitive indicators of ionized, high density regions (assuming those have a normal hydrogen content), it is interesting to see that our data do not show any evidence for significant amounts of high density material. In fact, the spectrum can be fitted with a uniform electron density of 3000 cm-3, consistent with the values derived from the optical [Cl iii] density diagnostics (§3.2, Table 3). We note that our adopted reddening of c(H) = 1.25 for NGC 3576 was derived from the observed relative intensities of H, H, H and H. The dereddened intensities of these low Balmer lines give an excellent fit to the theoretical Case B ratios (Table 2). The high Balmer lines (H10-H24) used for Figure 9 span a wavelength range of less than 130 Å, so it would require a large change in the adopted reddening to change their decrement slope to one that was consistent with N cm-3. Such a change in reddening would be inconsistent with the low Balmer line relative intensities, however. We consider the high-n Balmer lines to provide a secure upper limit of N cm-3 for their emitting region.
The Balmer decrement electron density diagnostic discussed above pertains to regions dominated by hydrogen, but not necessarily to possible hydrogen-deficient regions in the nebulae, which could give rise to enhanced heavy element ORL emission, causing the observed abundance discrepancies. However, such hydrogen-deficient regions cannot have electron densities significantly higher than those deduced from the hydrogen Balmer decrement, in the case of NGC 3576, or from the standard CEL density diagnostics discussed in Section 3.2, since, as discussed in Section 5.2.1, the observed relative intensities of O ii V 1 multiplet components indicate that O2+ recombination is occurring in regions with electron densities lower than 3500 cm-3, the critical density of the O2+ 3P2 level. Collisional quenching of the optical and infrared CELs in high-density clumps can therefore be ruled out as the cause of the lower abundances derived from CELs compared to those derived from ORLs. The only remaining way in which CELs can be collectively suppressed in an ORL-emitting ionized region is for the temperature of the region to be low enough to suppress not just optical CEL emission but also infrared fine-structure emission lines such as the 52- and 88-m lines of [O iii], implying electron temperatures lower than a few hundred Kelvin. Is there any evidence for hydrogen-deficient zones inside H ii regions?
Rosa & Mathis (1987) report the existence of a hydrogen-poor (He/H = 0.14) region in the outskirts of the 30 Doradus nebula, enhanced in most metals, apart from nitrogen. They hypothesize that it might contain chemically processed ejecta from a massive, late-type Wolf-Rayet star. It would be interesting to obtain high spatial resolution spectra of that region to search for regions of enhanced heavy element ORL emission. Our long-slit spectra sample a slice through the central 1 arcmin of 30 Doradus, which is known to contain a number of WR stars (Moffat et al. 1987, Parker 1993). Could it be that knots of heavy-element enhanced material have been ejected from such stars and are the cause of the high ORL abundances? It is well known from kinematical studies (e.g. Meaburn 1984) that 30 Doradus contains pressure-driven bubbles, shells and sheets of ionized gas, originating from interactions with the intense winds from WR, Of stars and supernova remnant ejecta. In fact two such potential culprits were directly encountered by our long slit, i.e. R 139 (Of + WNL-type) and R 140 (WC + WN-type). The existence of a local minimum in the ORL C2+/O2+ ratio (Fig. 8) in the nebular region between R 139 and R 140 might be indicative of an outflow of carbon-depleted material from these evolved stars. On the other hand, LMC N11B does not contain any known Wolf-Rayet stars (Parker et al. 1992) and its ORL/CEL abundance discrepancy factor is more than twice that of 30 Doradus. Moreover, the fact that amongst our sample of H ii regions the ORL C2+/O2+ ratios of the postulated hydrogen-deficient component are so similar to the CEL C/O ratios of the ‘normal’ nebular component seems hard to reconcile with standard nuclear-processing scenarios for the hydrogen-deficient component.
Concerning the apparent low-density of the ORL-emitting material, it is interesting to make a comparison with the dual-component nebular models of the PN NGC 6153 (Liu et al. 2000), proposed as a solution for the extreme ORL/CEL abundance discrepancy (a factor of 10) in that nebula. One of those models (IH2) contained very cold (500 K), low density ( 1000 cm-3) H-deficient inclusions, immersed in hot gas with normal abundances. This model however was rejected for NGC 6153 on account of (a) the required large filling factor of the metal-rich component, which would significantly increase the total CNO content of the nebula, and (b) the very large overpressure of the normal component, which would lead to the rapid collapse of the postulated inclusions. It is possible that the O ii ORLs from our sample of H ii regions originate from cold, low-density, ionized and metal-rich regions located around much denser neutral cores – which may also be H-deficient; such material may have been ejected from evolved, massive Of/WR stars in the vicinity. The existence of neutral, dense inclusions, whose photo-evaporation leads to the emission of heavy-element ORLs from lower density ionized halos, could help to alleviate the problem of the survival of fully ionized inclusions subject to large over-pressures.
8 Conclusions
The current dataset supported by published far-IR observations all but rules out the notion that Peimbert-type temperature fluctuations are the cause of the high metal abundances derived from optical recombination lines with respect to the lower abundances yielded by forbidden lines in H ii regions. Neither do our results advance the case for the existence of Viegas & Clegg-type high density, ionized condensations in this sample of nebulae that could compromise the observationally derived [O iii] temperature, since the relative intensities of high-order H i Balmer lines and the relative intensities of O ii V 1 multiplet components both indicate that recombination is occurring in regions having electron densities similar to those indicated by the standard CEL nebular density diagnostics. Instead, our analysis points towards an origin for much of the enhanced heavy-element optical recombination-line emission (enhanced relative to the optical and infrared CEL lines from the same ions) in ionized regions that are of low density and which are also cold, so that they do not emit CELs. Thus a resolution of the ORL/CEL problem appears to require the existence of a hitherto unseen component in these H ii regions, consisting of cold, rarefied and metal-rich, ionized gas.
Acknowledgments
YGT acknowledges the award of a Perren Studentship. We thank Daniel Péquignot for insightful comments and helpful discussions and the referee, Dr. R. Rubin, for his very careful reading of the manuscript.
References
- [1] Allende Prieto C., Lambert D. L., Asplund M., 2001, ApJ, 556, L63
- [2] Allende Prieto C., Lambert D. L., Asplund M., 2002, ApJ, 573, L137
- [3] Baldwin J.A., Verner E. M., Verner D. A., Ferland G. J., Martin P. G., Korista K. T., Rubin R. H., 2000, ApJS, 129, 229
- [4] Bautista M. A., Pradhan A. K., Osterbrock D. E., 1994, ApJ, 432, 135
- [5] Brocklehurst M., 1972, MNRAS, 157, 211
- [6] Brown R. L., Mathews W. G., 1970, ApJ, 160, 939
- [7] Burstein D., Heiles C., 1982, AJ, 87, 1165
- [8] Crowther P. A., Dessart L., 1998, MNRAS, 296, 622
- [9] Dufour R. J., Shields G. A., Talbot Jr R. J., 1982, ApJ, 252, 461
- [10] Esteban C., Peimbert M., Torres-Peimbert S., Escalante V., 1998, MNRAS, 295, 401
- [11] Esteban C., Peimbert M., Torres-Peimbert S., García-Rojas J., Rodríguez M., 1999, ApJS, 120, 113
- [12] Garnett D. R., 1992, AJ, 103, 1330
- [13] Garnett D. R., Dinerstein H. L., 2001, ApJ, 558, 145
- [14] Girardi L., Bica E., Pastoriza M. G., Winge C., 1997, ApJ, 486, 847
- [15] Grandi S. A., 1976, ApJ, 206, 658
- [16] Grevesse N., Noels A., Sauval A. J., 1996, in Holt. S. S., Sonneborn G., eds, ASP Conf. Ser. Vol. 99, Cosmic Abundances, Astron. Soc. Pac., San Francisco, p. 117
- [17] Gruenwald R., Viegas S. M., 1995, A&A, 303, 535
- [18] Hamuy M., Suntzeff N. B., Heathcote S. R., Walker A. R., Gigoux P., Phillips M. M., 1994, PASP, 106, 566
- [19] Henry R. B. C., Kwitter K. B., Bates J. A., 2000, ApJ, 531, 928
- [20] Hill J. K., Bohlin R. C., Cheng K.-P., Fanelli M. N., Hintzen P., O’Connell R. W., Roberts M. S., Smith A. M., Smith E. P., Stetcher T. P., 1993, ApJ, 413, 604
- [21] Howarth I. D., 1983, MNRAS, 203, 201
- [22] Kingdon J., Ferland G. J., 1995a, ApJ, 442, 714
- [23] Kingdon J., Ferland G. J., 1995b, ApJ, 450, 691
- [24] Kingsburgh R. L., Barlow M. J., 1994, MNRAS, 271, 257
- [25] Kurt C. M., Dufour R. J. 1998, Rev. Mex. Astron. Astrofis., 31, 147
- [26] Liu X.-W., 2002a, Rev. Mex. Astron. Astrof. (Ser. de Conf.), 12, 70
- [27] Liu X.-W., 2002b, in Proc. IAU Symp. 209, Planetary Nebulae, ed. R. Sutherland, S. Kwok, M. A. Dopita, Astron. Soc. Pac., San Francisco, in press
- [28] Liu X.-W., Barlow M. J., Danziger I. J., Storey P. J., 1995b, ApJ, 450, L59
- [29] Liu X.-W., Barlow M. J., Cohen M., Danziger I. J., Luo S.-G., Baluteau J.-P., Coz P., Emery R. J., Lim T., Péquignot D., 2001a, MNRAS, 323, 342
- [30] Liu X.-W., Luo S.-G., Barlow M. J., Danziger I. J., Storey P. J., 2001b, MNRAS, 327, 141
- [31] Liu X.-W., Storey P. J., Barlow M. J., Clegg R. E. S., 1995a, MNRAS, 272, 369
- [32] Liu X.-W., Storey P. J., Barlow M. J., Danziger I. J., Cohen M., Bryce M., 2000, MNRAS, 312, 585
- [33] Lucy L. B., 1995, A&A, 294, 555
- [34] Luo S.-G., Liu X.-W., Barlow M. J., 2001, MNRAS, 326, 1049
- [35] Mathis J. S., Torres-Peimbert S., Peimbert M., 1998, ApJ, 495, 328
- [36] Meaburn J., 1984, MNRAS, 211, 521
- [37] Moffat A. F. J., 1989, ApJ, 347, 373
- [38] Moffat A. F. J., Niemela V. S., Chu Y.-H., Seggewiss W., 1987, ApJ, 312, 612
- [39] Parker J. W., 1993, AJ, 106, 560
- [40] Parker J. W., Garmany C. D., Massey P., Walborn N. R., 1992, AJ, 103, 1205
- [41] Peimbert M., 1967, ApJ, 150, 825
- [42] Peimbert M., Storey P. J., Torres-Peimbert S., 1993, ApJ, 414, 626
- [43] Péquignot D., Amara M., Liu X.-W., Barlow M. J., Storey P. J., Morisset C., Torres-Peimbert S., Peimbert M., 2002a, Rev. Mex. Astron. Astrof. (Ser. de Conf.), 12, 142
- [44] Péquignot D., Liu X.-W., Barlow M. J., Storey P. J., Morisset C., 2002b, in Proc. IAU Symp. 209, Planetary Nebulae, ed. R. Sutherland, S. Kwok, M. A. Dopita, Astron. Soc. Pac., San Francisco, in press
- [45] Rosa M., Mathis J. S., 1987, ApJ, 317,163
- [46] Rubin R. H., 1986, ApJ, 309, 334
- [47] Rubin R. H., 1989, ApJS, 69, 897
- [48] Rubin R. H., Bhatt N. J., Dufour R. J., Buckalew B. A., Barlow M. J., Liu X.-W., Storey P. J., Balick B., Ferland G. J., Harrington J. P., Martin P. G., 2002, MNRAS, 334, 777
- [49] Rubin R. H., Martin P. G., Dufour R. J., Ferland G. J., Baldwin J. A., Hester J. J., Walter D. K., 1998, ApJ, 495, 891
- [50] Rubin R. H., Simpson J. P., Erickson E. F., Haas M. R., 1988, ApJ, 327, 377
- [51] Rubin R. H., Simpson J. P., Haas, M. R., Erickson E. F., 1991 ApJ, 374, 564
- [52] Shaver P. A., McGee R. X., Newton L. M., Danks A. C., Pottasch S. R., 1983, MNRAS, 204, 53
- [53] Shields G. A., 2002, Rev. Mex. Astron. Astrof. (Ser. de Conf.), 12, 142
- [54] Simpson J. P., Colgan S. W. J., Rubin R. H., Erickson E. F., Haas M. R., 1995, ApJ, 444, 721
- [55] Smits D. P., 1996, MNRAS, 278, 683
- [56] Stasińska G., 1980, A&A, 84, 320
- [57] Storey P. J., 1994, MNRAS, 282, 999
- [58] Storey P. J., Hummer D. G., 1995, MNRAS, 272, 41
- [59] Tsamis Y. G., 2002, Ph.D. Thesis, University of London
- [60] Tsamis Y. G., Liu X.-W., Barlow M. J., Danziger I. J., Storey P. J., 2002a, MNRAS, to be submitted
- [61] Tsamis Y. G., Liu X.-W., Barlow M. J., Storey P. J., Danziger I. J., 2002b, MNRAS, to be submitted
- [62] Verner E. M., Verner D. A., Baldwin J. A., Ferland G. J., Martin P. G., 2000, ApJ, 543, 831
- [63] Viegas S., Clegg R. E. S., 1994, MNRAS, 271, 993
- [64] Walborn N. R., Blades J. C., 1997, ApJS, 112, 457 (WB97)
- [65] Walborn N. R., Fitzpatrick E. L., 1990, PASP, 102, 379
- [66] Walsh J. R., 1993, ST-ECF Newsletter, 19, 6
- [67] Walsh J. R., Rosa M. R., 1999, in Walsh J. R., Rosa M. R., eds, Proc. ESO Workshop on Chemical Evolution from Zero to High Redshift, Springer-Verlag, Berlin, 68
- [68] Walter D. K., Dufour R. J., Hester J. J., 1992, ApJ, 397, 196