Detection of Carbon Monoxide within the Magellanic Bridge
Abstract
The Mopra 22m and SEST 15m telescopes have been used to detect and partially map a region of 12CO(1-0) line emission within the Magellanic Bridge, a region lying between the Large and Small Magellanic Clouds. The emission appears to be embedded in a cloud of neutral hydrogen, and is in the vicinity of an IRAS source. The CO emission region is found to have a 60m/100m flux density ratio typical for 12CO(1-0) detections within the SMC, although it has a significantly lower 12CO brightness and velocity width. These suggest that the observed region is of a low metallicity, supporting earlier findings that the Magellanic Bridge is not as evolved as the SMC and Magellanic Stream, which are themselves of a lower metallicity than the Galaxy. Our observations, along with empirical models based on SMC observations, indicate that the radius of the detected CO region has an upper limit of 16 pc. This detection is, to our knowledge, the first detection of CO emission from the Magellanic Bridge and is the only direct evidence of star formation through molecular cloud collapse in this region.
keywords:
Galaxies: Magellanic Clouds - ISM:molecules1 Introduction
The Magellanic Bridge forms a link of primarily neutral hydrogen between the Small and Large Magellanic Clouds (SMC and LMC). Recent high-resolution observations of the H fraction of the Bridge, using the Australia Telescope Compact Array (ATCA) and the Parkes Telescope by Muller et al. (MNRAS, in press), show an intricate morphology, comprising numerous clumps and filaments across all observed spatial scales. The mechanism responsible for the formation of the Bridge is widely considered to be the gravitational influence of the LMC, and numerical simulations have shown that its formation was possibly triggered during a close pass of the Clouds to each other around 200Myr ago (eg Gardiner & Noguchi 1996).
The stellar population of the Bridge has been shown to be relatively young, with an age range of 10 to 25 Myr (Grondin, Demers & Kunkel, 1992 and Demers & Battinelli, 1998). The young ages imply that star-formation within the Bridge is an active process, yet no previous evidence of star-forming regions through CO emission has been found.
The Magellanic Clouds, as well as the Magellanic Bridge, have been the focus for a number of searches of molecular transition lines. From these searches, a number of different carbon isotopes, as well as other molecular species have been identified. It appears that the Clouds are rather metal deficient, the SMC particularly so (Israel et al. 1993, and papers of that series). The low CO luminosity of the SMC, being weak and cold in comparison to Galactic Molecular Clouds, has been ascribed to a smaller molecular cloud size which may be, in part, due to a higher UV radiation field causing more thorough photo-disassociation (Rubio et al., 1991, Israel et al., 1993). These authors suggest that the higher UV field of the SMC is the product of a more active star formation per unit mass than the galaxy, and lower absorptive dust fraction. Rubio et al. (1993) note that the luminosity and metallicity of CO regions within the SMC are similarly less than those of the Galaxy, although they do not speculate on a reliable and direct correlation between these two parameters. Spectral studies of young, early-type stars throughout the SMC (Rolleston et al., 1993) have shown that the heavy-metal abundance within this SMC is not homogeneous, and is lower than Galactic values.
A few stars within the Bridge and SMC wing have been found to be more metal deficient than star-forming regions in the SMC by 0.5 dex (Rolleston et al., 1999). More recent spectral studies towards the centre of the Bridge by Lehner et al. (2001) confirm the mismatch of abundances between the SMC and the Magellanic Bridge, and these authors suggest that the Bridge comprises a mix of gas from SMC gas, and from its relatively un-enriched halo.
Israel et al. (1993) made extensive searches for CO emission regions within the SMC towards locations selected from IRAS maps and from known H emission regions. They found that strong sources of CO emission were generally associated with regions where the ratio of 60m and 100m flux densities () were 1.0, and that sites of CO emission where 1.0 were relatively weak. In general, SMC CO line emissions were found to be weaker and narrower than those of Galactic CO emission.
At this stage, CO emission of any kind has not previously been reported in the Magellanic Bridge further east than the molecular cloud N88, which occupies the north eastern corner of the SMC. N88 has also been observed in a number of other molecular lines (Testor et al., 1999). Smoker et al. (2000) have conducted a search for 12CO(1-0) near the centre of the Magellanic Bridge, towards a region of cold atomic hydrogen (Kolbunicky & Dickey 1999). This target was considered a likely candidate based on studies by Garwood & Dickey (1989), who had found that CO emission regions were occasionally associated with cold atomic gas. These SEST observations by Smoker et al. however, showed no 12CO(1-0) emission down to an RMS of 60 mK.
Maps of CO emission from the tidally affected M81 galaxy have shown that some CO regions can be associated with tidally extruded H (Taylor, Walter & Yun, 2001), although the correlation is not particularly outstanding and the CO appears to only loosely trace the H mass.
CO emission in Tidal Dwarf Galaxies (TDGs) has been found to generally correlate with regions of high H column density by Braine et al. (2001), although only single pointings were made during this study. TDGs are thought to condense from the remnant material exported from a host galaxy during a tidal stripping event (eg Braine et al. 2001). They may represent a class of objects where star-formation has preceded significant tidal perturbation. This is the reverse of the sequence of processes thought to be active in the Magellanic Bridge and is a relevant benchmark to bear in mind.
This paper presents results from a CO survey of a region in the Magellanic Bridge using selection criteria based on findings by Israel et al. (1993), Taylor, Walter & Yun (2001) and Braine et al. (2000, 2001).
We discuss the selection procedure of candidate CO emission sites in Section 2. Observation techniques are outlined in Section 3. In Section 4, we present the results and comparisons with H data. We discuss the results in Section 5.
| Pointing | Offset | H Col. dens. | Obs.time | RMS (after reduction) | S/N | ||
|---|---|---|---|---|---|---|---|
| RA | Dec. | cm-2 | (min) | (mK) | |||
| 1 | 0.0 | 0.0 | 2.71021 | 0.18 | 157 | 21 | 6.5 |
| 2 | 0.0 | 45 | 2.71021 | 0.24 | 48 | 34 | 6.1 |
| 3 | 45 | 45 | 2.61021 | 0.23 | 48 | 39 | - |
| 4 | 0.0 | +90 | 2.51021 | 0.26 | 48 | 39 | 3.1 |
2 Source Selection
CO requires a surface on which to form, and in instances where UV flux may be high enough to cause disassociation, a buffer of absorbing material is necessary to surround the CO region. As such, candidate CO regions were selected for this survey primarily through comparisons of maps of far-IR emission and of H column density. In general, 60m emission across the Bridge is negligible except for a few sparsely distributed bright peaks, with a maximum brightness of 1.5 MJy sr-1. As mentioned previously, the H distribution is rather clumpy with a filamentary component throughout much of the Bridge. The H spectral information used throughout this study has been extracted from the H datacube, presented and discussed in a paper by Muller et al (MNRAS, in press). This dataset comprises observations with the Australia Telescope Compact Array (ATCA) and the Parkes telescope. The sensitivity of these observations is 15.2 mJy/Beam and a beamwidth of 98.
Candidate regions were those where the 60m to 100m flux density ratio 0.2 were co-incident with a local H integrated intensity maximum. Throughout the Bridge, six candidate regions satisfying this criteria have been identified. At this time however, only one of these regions has been investigated for 12CO(1-0) emission. The other five, un-observed CO candidate sites have lower ratios, lower 60m emission, and with one exception, all have OB associations and IRAS sources within a few tens of parsecs (projected). Study of the remaining sites will be the subject of a future paper.
3 Observations
3.1 Mopra
The 22m Mopra telescope 111The Mopra telescope is part of the Australia Telescope which is funded by the Commonwealth of Australia for operation as a National Facility managed by CSIRO. was used to examine one pointing only. These observations were made during the evening and night of 11th of October 2000, and during the night of 13th December 2000.
The two SIS receivers of Mopra were tuned to 115.19GHz. The correlator was configured to give 64 MHz bandpasses with 1024 channels for both receivers, resulting in a velocity range of 167 km s-1 and a velocity channel spacing of 0.163 km s-1.
During observing runs, the telescope was calibrated every 45 minutes with observations of an ambient temperature source. Reference observations were made of an area located two minutes south of the source. Total on-source time was 682 minutes.
Observations of N88 were made for calibration purposes. The 12CO(1-0) signal strength of 200mK for N88 is 40% of the brightness measured by Rubio et al. (1996), and is in general agreement with the estimated efficiency of the Mopra Telescope (Kesteven M., Priv.comm.).
The pointing corrections for the telescope were made before each 6 hour observing session using SiO maser sources. Corrections were repeated until accuracy was better than 5”.
All data was reduced following standard procedures, using the ATNF SPC reduction package.
3.2 SEST
Confirmation and mapping observations were conducted with the SEST Swedish ESO Sub-millimetre Telescope, during the evenings and nights of the 2001 December 15th-17th.
The SESIS 100 receiver was tuned to 115.19 GHz, and the correlator was configured to the High Resolution Spectrometer settings, giving a 45′′ beamwidth, and a 83.6MHz bandpass of 2000 channels. This yields a velocity range of 218 km s-1 and a velocity channel spacing of 0.109 km s-1.
The Double Beam Switching (DSW) mode was used for these observations. This employs a focal plane chopper wheel that rotates at 6Hz to observe the off-source position, located +2m27sin azimuth away from the source.
During observing runs, pointing and focus corrections were made every two hours, using the SiO maser R Doradus (8Jy) where possible, otherwise R Aquarius was used (5Jy). Calibration checks were made every 5 minutes.
Four pointings were made at beam-width sized offsets from the primary position. Positions, H column densities and values for these pointings are shown in Table 1. The pointings are numbered in the order in which they were observed.
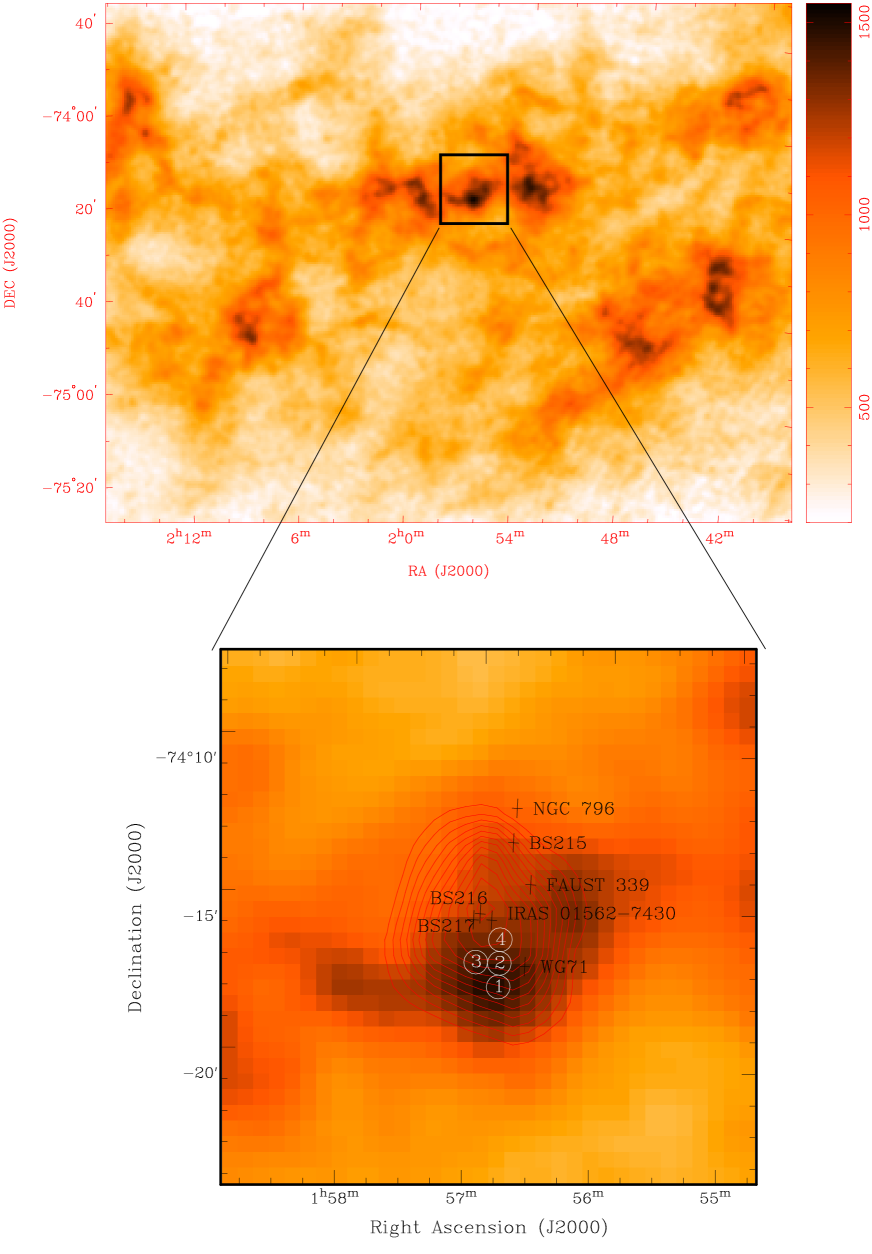
Figure 1 shows the position of the candidate emission region on an integrated intensity map (Muller, et al., MNRAS, in press). The sub-image shows the observed positions, nearby OB associations extracted from an OB catalogue (Bica et al. 1995) and contours of 60m brightness.
Pointing 1 was observed for a total of 157.1 minutes, on-source time. The other three positions were observed for 48 minutes each, on-source time. System temperatures ranged between 500-590 K.
Data were reduced using the XS data reduction package. The raw spectra had velocity resolution of 0.11 km s-1. This was increased to a final value of 0.33 km s-1 during reduction to increase the signal-to-noise. Data were scaled to compensate for the main-beam efficiency using: TA=TMB/0.7. All data were baseline subtracted with a single linear baseline, although in most cases this was hardly necessary, and a higher order fit did not improve S/N significantly. The resulting RMS values, (after rebinning across three velocity channels) and the on-source times are shown in Table 1.
4 Spectra and analysis
The primary pointing, and two of three offset pointings at the studied location yielded positive detections (SEST).
The initial detection made with the Mopra telescope is shown in Figure 2, and has a S/N of 3.5, while spectra obtained with the SEST are shown in Figure 3 for each of the pointings 1-4. Table 2 summarises the parameters for gaussian fits made to spectra from pointings 1,2 & 4, as well as integrated intensity determined from the fit parameters. The analysis package ’XS’ was to make the gaussian fitting.
The detection at Pointing 4 has a S/N of 3.1, and is not a significant detection on its own, however positive detections made nearby improves its legitimacy. Pointing 3 did not yield a convincing detection of the 12CO(1-0) line.


| Pointing | Vo | ICO | ||
|---|---|---|---|---|
| km s-1 | mK | km s-1 | K. km s-1 | |
| 1 | 189.4 | 140 | 1.3 | 0.19 |
| 2 | 189.5 | 170 | 1.7 | 0.31 |
| 4 | 189.3 | 90 | 1.4 | 0.13 |
We can see from Fig. 1 that pointing 1 corresponds to the highest local H column density. This point appears to be on the rim of an annular, or crescent-shaped H filament and has a 0.18, although this parameter peaks slightly north of the H integrated intensity maximum at the IRAS catalogue object, IRAS 0152-7430 (01h56m57s-74∘14′14, J2000). Two OB populations are located at almost the same position as the IRAS object, comprising either one association with a more centrally condensed population, or two superimposed OB associations. These associations are labelled BS216 and BS217 (Bica et al. 1995). A third OB association is found to the west of pointing 2. This association is labelled WG71 (1h56m35s-74∘17′1, Westerlund & Galespey, 1971).
The detected CO spectrum from pointing 1 is shown in Fig. 4, with the H spectrum at the same location overlaid (Muller et al., MNRAS, in press). The peak velocity of the CO emission coincides with that of the H emission, indicating that the CO emission region is enclosed by an H cloud which may be offering some protection from ambient UV flux. The width of the H line at this location is 10 km s-1. More mapping will be required to ascertain the extent of the CO mass and the degree of correlation of the H and CO emission regions.

We have plotted the integrated CO intensity, LCO as a function of line-width in Figure 5, along with those for detections made in the SMC by Israel et al. (1993). This plot highlights the relative weakness and the low velocity dispersion of the CO detection in the Magellanic Bridge. Visually, the plot also suggests that the Bridge detections fit quite well into a correlation between velocity width and ICO for SMC detections. The value of ICO plotted by Israel et al. is a direct sum, whereas our value of ICO is determined from a gaussian fit. However, since the emission line appears to have no velocity structure, the difference between the methods is considered to be negligible. The errors for this plot were determined using the algorithms developed by Landman, Roussel-Dupré & Tanigawa, (1982), and Barranco & Goodman (1998).

5 Discussion
From the observations around 01h56m48s74∘16′56(J2000), three separate locations have shown a positive 12CO(1-0) detection. The pointing from which the CO emission is absent does not appear to be significantly different to the other three positions in terms of and H integrated intensity.
Rubio et al. (1993) were able to formulate empirical relations from their studies of SMC CO emission regions. These relations allow the velocity dispersion, luminosity, virial mass and H2/CO factor to be estimated from a measurement of the radius of the CO emission region. We estimate a new fit to only the SMC data from the paper by Rubio et al. (1993), and find a relation of: V. The dataset from Rubio et al. (1993) is shown in Fig. 6 along with the fit determined here. We have included an upper limit to the log-log fit, based on the beamsize used for those observations, from which we estimate an upper limit to the radius of the Magellanic Bridge CO emission region of 16 pc. We see from Fig. 3 that the emission region extends across multiple beam-widths, where one beamwidth subtends 10pc. From the relative amplitudes of each of the positive detections, We suggest that the centre of the CO emission cloud is southwest of pointing 2, and is perhaps co-incident with the association WG71. We should bear in mind that the Magellanic Bridge has a slightly lower metal abundance than the SMC by 0.5 dex (Rolleston et al. 1993), and we would expect this to reduce the size of the emission region (Rubio et al., 1993).
CO has not been detected in emission for any galaxy having a 12+log(O/H) 7.9 (Taylor, Kobulnicky & Skillman, 1998). Taking a mean value for 12+log(O/H) for the SMC of 7.98 (Pagel et al, 1987), along with the knowledge that isolated measurements of the Magellanic Bridge show an under-abundance relative to the SMC by 0.5 dex (Rolleston et al. 1999), we see that this may be the first successful detection of CO in emission where 12+log(O/H) 7.9. We should note that the estimates of 12+log(O/H) by Pagel et al. were made from studies of H regions, and range between 7.84 and 8.16. More importantly, the estimates of the 12+log(O/H) for the Magellanic Bridge were made at a location a few degrees east from the location of the CO detection, and Rolleston et al. (1993) have shown that the metallicity of the SMC is not homogeneous. It is probable then, that the metallicity of the Magellanic Bridge is equally inhomogeneous.
A mean conversion factor for X==cm-2 was determined by Israel (1997) from analysis of various CO emission regions in the SMC. It is interesting to apply this factor to the CO emission detected in the Magellanic Bridge. Table 3 shows the predictions of the H2 column densities using this transformation. We also see from this table that the ratio of M(H2)/M(H ) is significantly larger than the mean M(H2)/M(H ) for the SMC. To maintain a consistent M(H2)/M(H ) between the Bridge and SMC, a lower X value is required for the Bridge. This is as we would expect for a lower-metallicity environment.
| Pointing | N(H2) | M(H2)/M(H ) |
|---|---|---|
| cm-2 | ||
| 1 | 2.3 | 1.7 |
| 2 | 3.7 | 2.8 |
| 4 | 1.6 | 1.3 |
| SMC | - | 0.2 (Mean) |

The general nature of H within the Bridge is clearly turbulent (see Muller, et al., MNRAS, in press) and the H in the neighbourhood of these detections has a clear bimodal profile, with the two peaks separated by a lower density rift of 30 km s-1 (Heliocentric). The CO detections made here correspond to the velocity of the receding peak. The velocity bifurcation continues into the SMC, and about one third of the way to the LMC (Muller et al., MNRAS, in press). Rubio et al. (1993) noted that all the CO detections in the SMC were located on the approaching velocity peak, although any reason or significance for a preference is unclear. A more detailed study of this area shows that it cannot be interpreted as an expanding H shell (Muller, et al. MNRAS, in press).
Studies of the CO emission from Tidal Dwarf Galaxies and tidal remnants by Braine et al. (2000) and Braine et al. (2001) have shown that molecular gas is observable within the remnants of tidal interaction and these authors suggest that the CO regions form after the tidal stripping event. Typical line-widths and ICO values from these observations of the 12CO(1-0) transition are 15 - 66 km s-1 and 0.1 - 2 K km s-1. However, that sample has an oxygen abundance range of 12+log(0/H)8.2 - 8.6, which is in the upper range of that found from a study of dwarf galaxies including the SMC and the LMC (Israel, Tacconi & Baas, 1995). The high metallicities of these type of galaxies are considered to be the remnants of their original host galaxies. As the SMC is thought to be the original host for the matter drawn out into the Magellanic Bridge, we would expect the line-widths of the Bridge CO emission regions to be similar to those of the SMC and Figure 5 shows that this is indeed the case. Braine et al. (2000) selected CO candidate emission regions on the basis of high H column density. They also concluded that the spatial co-incidence of H clumps and CO regions suggested that the CO region had formed after the tidal extraction event. From the lack of information of the spatial distribution of the CO emission region in the Bridge, it is difficult to say whether the CO emission region coincides exactly with the nearby H clump. At this stage however, the spatial and velocity positions of H clumps and the CO emission region appear to correspond. A future paper will examine this aspect in more detail.
At this stage then, it appears then that the narrow CO line-widths as measured in the Magellanic Bridge are not representative of those of observed TDGs, although we should bear in mind the differences in the progenitor galaxy types, and we should be careful in drawing parallels with this context.
6 Conclusions
We have detected a 12CO(1-0) emission region within the Magellanic Bridge. The line width and integrated intensity is compatible with other CO detections within the SMC, although it is somewhat weaker and cooler, implying a lower metallicity. The findings at this point appear to be consistent with studies of CO emission regions within the SMC where CO has been found to associated with high H integrated intensity and with 0.2. Estimates made from log-log model fits to SMC CO observations indicate that the Magellanic Bridge CO emission region is spatially small, and has a radius of 16 pc. The CO emission region has a narrow line-width compared with observations of the SMC and with other TDGs, lending support to findings that suggest the Bridge has a lower metallicity than the SMC. At this stage, a reliable estimation of H2 mass is not really possible from the small amount of spatial information, although these issues will be addressed in a future paper. This finding confirms for the first time that star formation through molecular cloud collapse is an active and current process within the Bridge.
Acknowledgements
The Authors would like to thank the referee, Dr. Frank Israel, for his helpful comments and suggestions for improvements on this paper. Thanks goes also to Dr. Tony Wong for essential advice on early drafts of the paper. We would also like to thank the Staff at the SEST facility and the European Southern Observatory. Finally, we would like to acknowledge the ATNF and CSIRO for the use of the Mopra Observatory.
References
Barranco, J.A., Goodman, A.A.,1998, ApJ, 504, 207B
Braine, J., Duc, P.-A., Lisenfeld, U., Charmandaris, O., Vallego, O., Leon, S., Brinks, E. 2001, A&A, 378, 51
Braine, J., Lisenfeld, U., Duc, P-A., Leon, S. 2001, Nat., 403, 867
Bica E.L.D., Schmitt H.R. 1995, ApJS, 101, 41
Demers, S., Battinelli, P., 1998, AJ 115, 154
Gardiner, L., Noguchi, M., 1996, MNRAS, 278, 191
Garwood, R.W., Dickey, J.M., 1989, ApJ, 338, 841
Grondin, L, Demers, S, Kunkel, W.E., 1992, AJ, 103, 4, 1234
Israel, F.P., Johansson, L.E.B., Lequeus, J., Booth, R.S., Nyman, L.,-A, Crane, et al. 1993, A&A, 276 , 25
Israel, F.P., Tacconi, L.J., Baas, F., 1995, A&A, 295, 599
Israel, F.P., 1997, A&A, 328, 471.
Kobulnickey, H.A., Dickey, J.M., 1999, A&A, 117, 908
Landman, D.A., Roussel-Dupr’e, R., Tanigawa, G., 1982, ApJ, 261, 732
Lehner, N., Sembach, K.R., Dufton, P.L., Rolleston, W.R.J., Keenan, F.P., 2001, ApJ, 551, 781
Pagel, B.E.J., Edmunds, M.G., Fosbury, R.A.E., Webster, B.L., 1978, MNRAS, 184, 569
Rolleston, W. R. J., Dufton, P. L., Fitzsimmons, A., Howarth, I. D., Irwin, M. J., 1993, A&A. 277,10
Rolleston, W.R.J., Dufton, P.L., McErlean, N.D., Venn, K.A., 1999, A&A, 348
Rubio, M., Garay, G., Montani, J., Thaddeus, P., 1991, ApJ, 368, 173.
Rubio, M., Leuqeus, J., Boulanger, F., 1993, A&A, 271, 9
Rubio, M., Lequeus, J., Boulanger, F., Booth, R.S., Garay, G., de Graauq, Th., Israel, F.P., et al. 1996, A&A supp. ser. 118, 263
Smoker, J.V., Keenan, F.P., Polatidis, A.G., Mooney, C.J., Lehner, N., Rolleston, W.R.J., 2000, A&A, 363, 451
Taylor, C.L., Walter, F.,Yun, M.S., 2001, ApJ, 562, L43
Taylor, C.L., Kobulnickey, H.A., Skillman, E.D., 1998, AJ, 116, 2748
Testor, G., Rola, C.S., Whiing, A.B., 1999, In: Y.-H.Chu Suntzeff, N.B., Hesser, J.E., Bohlender, D.A. ed., IAU #190, New Views of the Magellanic Clouds.
Westerlund, B.E., Glaspey, J., 1971, A&A, 10, 1