High Resolution Grating Spectroscopy of GRB 020405 with CHANDRA LETGS
Abstract
We present high-resolution X-ray spectroscopy of GRB 020405 obtained with the Low Energy Transmission Grating Spectrometer (LETGS) on board the Chandra X-ray Observatory starting 1.68 days after the burst. The spectrum appears featureless, with no evidence for emission lines, absorption edges, or narrow radiative recombination continua. The continuum can be fitted by a power law of photon index and temporal decay index , with a marginally significant excess column density of cold gas = cm-2 at the redshift of the host galaxy. The absence of iron lines indicates that the density of nearby surrounding material was unlikely to be very dense ( cm-3) at the time of the Chandra observation. In the case of recombination following photoionization in an optically thin medium, most ionic species would be completely stripped at lower gas densities than this. In the case of a power-law spectrum reflecting off a “cold”, opaque medium of low density, negligible emission features would be produced. Alternative to these possible explanations for the lack of emission features, any X-ray line emission taking place in a dense medium in a “nearby reprocessor” scenario might have been overwhelmed by the bright afterglow continuum. Although the absence of discrete features does not unambiguously test for a connection between GRB 020405 and nucleosynthesis, it emphasizes the need for high-resolution X-ray spectroscopy to determine the exact emission mechanism responsible for the reported discrete lines in other GRB afterglows.
1 Introduction
The nature of gamma-ray burst (GRB) progenitors remains a mystery despite the localization of 40 X-ray afterglows111See http://www.aip.de/jcg/grbgen.html. An increasing number of X-ray observations reporting discrete spectral features in GRB afterglows (Piro et al. 1999; Antonelli et al. 2000; Piro et al. 2000) has motivated attempts to find an explanation in terms of GRB progenitors. Thus far the claimed features are consistent with n = 2 1 transitions in all possible charge states of Fe, i.e., from Fe K-shell fluorescence at 6.4 keV to H-like Fe Ly at 6.95 keV. More recently Reeves et al. (2002) have reported the detection of H-like emission from multiple -elements including Si and S in the spectrum of GRB 011211; however, the statistical significance of those features is debatable (Rutledge & Sako 2002). The possible presence of Fe and/or -elements in the X-ray spectra of GRB afterglows could provide valuable information about the physical conditions in the vicinity of the progenitors.
Determining the relevant X-ray reprocessing mechanism in GRBs will involve the physical properties and geometry of the surrounding medium (see for instance Lazzati, Campana, & Ghisellini 1999; Paerels et al. 2000). Discrete spectral features are expected from hot gas when electron collisions cause excitations from the ground state. Emission lines can also arise via recombination if continuum photons (either from the burst itself or its afterglow) create a highly photoionized plasma. In certain cases fluorescence may be important if ions retain sufficient numbers of bound electrons. An important diagnostic that might discriminate between the different alternatives is the appearance of radiative recombination continua (RRC) produced by the return of unbound electrons to the ground state. RRC from a photoionized plasma resemble narrow emission lines, and could be used to verify that recombination is occurring. A 10 ks grating observation of GRB 991216 (Piro et al. 2000) showed a possible iron RRC that could represent the first evidence of a recombining plasma near a GRB. Nevertheless, and despite these efforts, the X-ray mechanism responsible for discrete features in GRBs is still uncertain due to limited spectral resolution and sensitivity of the existing observations (Paerels et al. 2000). In this letter we present results of the LETGS/ACIS-S spectroscopy of GRB 020405, and we show how density and geometry regulate the feasibility of detecting discrete lines in X-ray afterglows.
2 X-ray Observation of GRB 020405
GRB 020405 triggered the Third Interplanetary Network (IPN) on UT 2002 April 5.0288 with a 25-100 keV fluence erg cm-2 (Hurley et al. 2002) making it at the time the highest fluence above 25 keV for a localized burst since GRB 010629 (Ricker et al. 2001). The localization of a bright optical transient (Price, Schmidt, & Axelrod 2002a) and a relatively low foreground Galactic column density of = 4.3 cm-2 along this line of sight generated immediate interest in obtaining high-resolution X-ray grating spectroscopy of its afterglow.
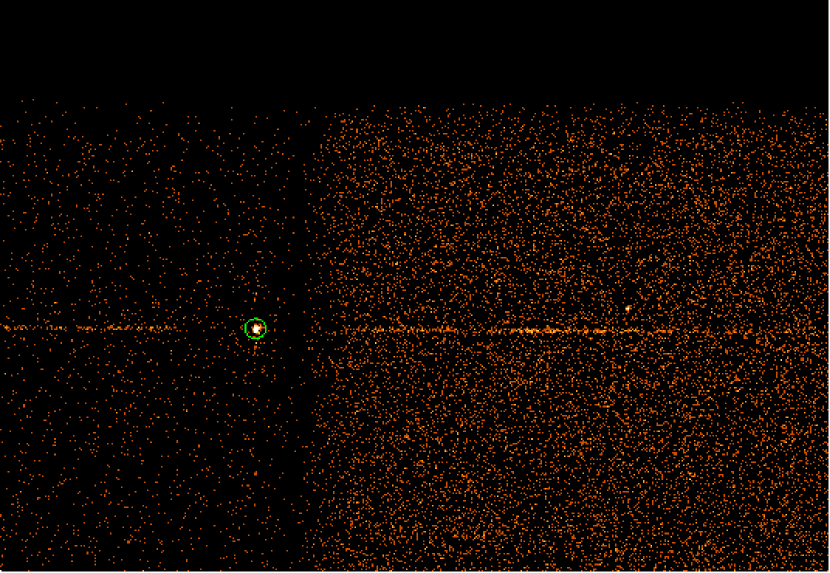
After a timely response by the Chandra X-ray Observatory, the observation of GRB 020405 started on UT 2002 April 6.711 using the LETGS in conjunction with the ACIS detector for a total usable exposure time of 50.6 ks before the satellite went into Earth occultation near perigee. At the time of the final Chandra trigger we still lacked knowledge of the redshift, therefore the observation was designed with a displacement along the grating dispersion axis, Y-OFFSET=. The offset placed the 0th-order image on the front-illuminated ACIS-S2 chip (Figure 1) while the ACIS-S3 and ACIS-S1 backside-illuminated chips, with higher quantum efficiency, covered higher spectral orders in the wavelength range 1.7 Å 28.9 Å and 28.5 Å 55.8 Å respectively. A priori, this configuration includes redshifted H-like lines of Ni, Co, Fe, Ca, Ar, S, Si, Al, Mg, Ne, and O as well as a few L-edges and He-like lines from a number of metals assuming an average GRB redshift2 .
3 Temporal and Spectral Analysis
The standard Chandra data products were processed with the destreak tool to correct a minor flaw in the readout of the chips222http://asc.harvard.edu/ciao/threads/destreak/. Subsequently, the instrument and mirror response were generated using the “makearf” and “makermf” tools. The final 0th and 1st-order spectra were then extracted using the proper grating effective area function (ARF) and redistribution matrix file (RMF) for each setting. For the timing analysis we used counts extracted from a circular aperture centered on the 0th-order image (we obtain consistent results using the dispersed data). A light curve of the LETGS events as a function of time shows a decay of the X-ray afterglow of GRB 020405 (Figure 2). The flux can be characterized as a power law (where t stands for time after the initial burst event) with .
The spectral analysis was undertaken using the spectral fitting package XSPEC. We analyzed the +1 and –1 orders individually as well as coadded. The results obtained in each case are statistically consistent. A fit of the coadded 1st-order extracted spectrum is well represented by an absorbed power law with photon index = 1.74 0.22 and column density = (1.94 1.14) cm-2 ( = 0.26). Rather than leaving as a free parameter, we also fitted a power-law model with Galactic and redshifted absorption at the host redshift, (Masetti et al. 2002; Price et al. 2002b) by treating the Galactic absorption along the line of sight, = 4.3 cm-2, as a fixed parameter. The best fit for such a model has = 1.72 0.21 with an absorbing column density at the host cm-2 ( = 0.26). Figure 3 shows the coadded 1st-order spectrum and power-law fit including residuals. The X-ray flux (0.2-10 keV) = (1.36 0.25) ergs s-1 cm-2, measured 1.71 days after the burst, with a normalization constant photons keV-1 cm-2 s-1 at 1 keV is similar to the flux reported for the bright GRB 010222 at the same epoch (in’t Zand et al. 2001). Although the value of is not highly constraining, it suggests that absorption at the host is non-negligible.
The X-ray flux, in comparison with optical photometry obtained around the same epoch, 1.7 days after the burst (Bersier et al. 2002, Price et al 2002b), can be used to derive a broad-band slope . Remarkably, this is identical to the X-ray spectral index itself, . However, a smooth extrapolation through the photometric points is not indicated, since fits to the spectrum yield slope (Price et al. 2002b) or (Bersier et al. 2002), the later even after correcting for Galactic extinction. Thus, the optical slope is steeper than the X-ray, seeming to require somewhere a concave upward inflection in the spectrum, which is inconsistent with basic synchrotron afterglow theory. This kind of discrepancy is common in afterglow spectra (e.g., Halpern et al. 1998), and is most simply understood as requiring additional dereddening of the optical spectrum to account for local extinction in the host. In this case, the marginally significant derived from the fit to the X-ray spectrum, if accompanied by typical amounts of optical extinction, would be enough to restore a concave downward shape to the broad-band spectrum.
Alternatively, this broad-band spectrum can be described as having an X-ray excess, which would require a mechanism in addition to synchrotron emission to be operating. For example, an X-ray contribution from inverse Compton scattering may be indicated, as was deduced by modelling of the broad-band afterglow of GRB 000926 by Harrison et al. (2001).
Of the simple synchrotron models involving expansion into a uniform-density medium (Sari, Piran, & Halpern 1999), the observed combinations of spectral slope and temporal decay in the optical and X-ray are most consistent with the evolution of a jet-like afterglow after both the cooling break and the jet break have passed. However, the required electron energy power-law slope would be slightly less than 2, which violates the assumptions of the model from which the relations and were derived. A different environment in which the medium has a stellar-wind density profile should be considered, because its predictions allow a more reasonable value of . In the adiabatic case where the cooling frequency has not yet passed, (Chevalier & Li 2000). For example, an acceptable fit in the wind scenario has , , and . A wind model should be of interest in the context of evidence for a massive progenitor star from the possible detection of a supernova in the late-time decay curve (Price et al. 2002b).
The 1st-order spectrum for the whole observation shows no evidence for discrete emission features, absorption edges or narrow RRC signatures across the spectrum. The edge seen around 5.62 Å corresponds to an instrumental absorption edge in gold material used in the LETGS. In addition to searching for features in the summed observation, the data were divided into equal time intervals of various durations (= 5.1 ks, 10.1 ks, 16.87 ks) to test for transient features that might have been present for part of the observation, as was reported in the case of GRB 970508 (Piro et al. 1999). The search for transient features did not produce any detection at the 3 level. We also looked for evidence of discrete features in the 0th-order spectrum. Although there are no features evident, the detection limits are not as sensitive as in the dispersed spectra because of the reduced spectral resolution and efficiency of the ACIS-S2 chip.
In order to quantify the absence of discrete features, we make a simplified assumption and adopt a fixed discrete line width = 0.46 keV in the GRB rest frame ( = 0.27 keV at ). This value is borrowed from the Fe line measurement in the GRB 991216 spectrum as reported by Piro et al. 2000. We then proceeded to fit Gaussian line profiles at their redshifted energies for multiple transitions and used the power-law continuum level to derive the line upper limits listed in Table 1. Finally, we determined upper limits for the rest-frame equivalent widths at the redshifted location of the transitions listed in Table 1.
4 X-ray Line Emission Mechanisms
The main objective of this grating spectroscopy was to acquire a sensitive soft X-ray spectrum to derive constraints on material in the proximity of the GRB. This is in fact the brightest case where X-ray spectroscopy has been obtained for a GRB in which a SN-like signature in the late-time decay curve (Price et al. 2002b) has been reported. A significant detection of Fe peak elements and particularly medium- elements (C through Si), where the highest spectral sensitivity for this choice of instrument is achieved, could have helped establish the nature of GRB progenitors. Unfortunately, the absence of discrete features in the spectrum of GRB 020405 does not provide a direct link between GRB 020405 and nucleosynthesis. Nevertheless we use the observed X-ray spectrum to place tentative constraints on the relevant emission mechanisms.
4.1 Collisional Excitation
There has been a resurgence of interest in the possible role of collisional excitation as a line emission mechanism in GRBs. The reason is mainly the MEKAL plasma model fit to the reported spectral emission lines from GRB 011211 (Reeves et al. 2002). A brief review of the thermal history of GRB 020405 is needed to evaluate the importance of collisional excitation to its X-ray afterglow emission. During the first 60 seconds, the burst bathes the progenitor gas with photons of average energy 0.1 MeV (Price et al. 2002b). For the prompt spectrum and peak energy of the burst (Band et al. 1993), the photon temperature averages K. However, we note that the Compton time scale required to equilibrate is much longer than the duration of the burst unless the electron number density cm-3 (Paerels et al. 2000). In other words, unless the medium is very dense, the Compton temperature of the prompt emission will not be reached. Current numerical models of proposed progenitor collapse have considered central densities of the required order (MacFadyen, Woosley, & Heger 2001). Nonetheless, even if occurring at early times, such a transient effect will probably be short lived because the plasma cools as the afterglow begins. In fact, the plasma temperature will settle to a new value corresponding to the balance between Compton heating and cooling and determined by the afterglow spectral parameters. Consequently, in the nonrelativistic limit, the temperature of the emitting material should not exceed the afterglow Compton temperature given by Ross, Fabian, & Young (1999) and expressed as
| (1) |
where , = 0.1 keV, and = 100.0 keV gives for .
Additional losses due to bremsstrahlung and atomic transitions continue to cool the plasma below as the cooling time scale becomes comparable to the duration of the afterglow. The absence of statistically significant emission in the X-ray spectrum implies that collisional excitation does not play a significant role in driving line emission by the time of the X-ray observation. In short, collisional excitation by afterglow photons might be important only when there is a sufficiently enough dense medium ( cm3) for Compton interactions to equilibrate, and if an additional heating mechanism is present that can maintain the gas around temperatures , as suggested by Paerels et al. (2000).
4.2 Recombination & Fluorescence
As the ionizing afterglow continuum encounters the external medium, discrete emission might also be excited by recombination or fluorescence. Depending on the optical depth and geometry of the medium, we can refer to this mechanism as either transmission or reflection (Vietri et al. 2001). In transmission, an optically thin medium () might produce photon cascades following recombination. In reflection, emission can be produced by the afterglow spectrum reflecting off an optically thick slab ( 1). Although the line equivalent widths of order a few keV reported in prior observations favor reflection over transmission, we will consider both possibilities here. The structure of recombination in either case will be determined by the ionization parameter (Tarter, Tucker, & Salpeter 1969) where is the ionizing luminosity, is the number density and the distance from the ionizing source.
To start, we derive the constraint on density for recombination taking place in an optically thin, homogeneous medium. Nominally, since the Chandra observation ended 2.27 days after the GRB any emitting material must have been located within a radius of the GRB where
| (2) |
where is the angle between the observer and the emitting material as seen from the GRB. Furthermore the light-distance traveled in the rest frame in the duration of the X-ray observation is cm.
Next we adopt a time-dependent X-ray luminosity
| (3) |
with energy index where corresponds to the jet solid angle. Price et al. (2002b) estimated a jet opening angle of for GRB 020405 where is the particle density in the nearby medium. However, since the solid angle of the X-ray continuum is poorly constrained at the time of our observation, which may overlap the “jet break,” we leave as a free parameter in the following discussion. At , GRB 020405 has a luminosity distance = 4505 Mpc, assuming a km s-1 Mpc-1, , cosmology. Hence
| (4) |
where is the distance from the ionizing source in units of cm and the number density in units of cm-3.
As noted above, the state of the gas, including the ionization fraction for each species, is largely determined by the ionization parameter . In order to estimate more accurately as a function of , we ran the XSTAR code (Kallman & Bautista 2001). XSTAR produces ionization fractions for H, He, C, N, O, Ne, Mg, Si, S, Ar, Ca, Fe, and Ni using the appropriate photoionization and recombination rates. For our model we adopted an input with power-law energy index =0.72 and a homogeneous medium with solar chemical composition within the radius of emission . The output of XSTAR shows that the ionization fraction of bound Fe+25 starts to be significant near , reaching a maximum at . Other species require lower ionization parameters for significant ionization stages with bound electrons to be present.
In order to constrain the density of the medium, we express the recombination luminosity of any line as
| (5) |
where is the element abundance, is the line energy, the ionization fraction, the recombination coefficient (Seaton 1959). Assuming , an ionization fraction of order 0.1 (possibly overestimated), and standard solar abundances, the upper limit to the Fe K line luminosity listed in Table 1 translates into an upper limit in density
| (6) |
This expression shows that significant ionization fractions require densities 5 cm-3 for species to be recombining under conditions of ionization equilibrium. For lower densities, most species including Fe would be completely stripped, which would account for the absence of discrete features in the spectrum of GRB 020405. Moreover, the medium becomes optically thick near n 2 cm-3. The range of ionization fraction maxima for Fe+25 and other species is relatively narrow and could serve as an indicator of the recombination mechanism in transmission as evolves with time due to the afterglow decay. Another caveat in this analysis is our assumed standard solar abundances. Supersolar compositions (10–100 times solar) would relax the restrictions on density by the appropriate factor, as the line luminosity is linearly dependent on both abundance and density.
The reflection model for an afterglow spectrum off a “cold”, optically thick medium has been investigated numerically by a number of groups (Ballantyne & Ramirez-Ruiz 2001; Lazzati, Ramirez-Ruiz, & Rees 2002). In particular, the reflection model has been put forth to explain the X-ray spectrum of GRB 991216 (see for instance Vietri et al. 2001). Using XSTAR once more with the estimated power law spectrum, solar abundance and radius of emission , we find that reflection models appear most efficient for ionization parameters . This result is consistent with previous work (Ballantyne & Ramirez-Ruiz 2001; Kallman, Mészáros, & Rees 2001). When line emission from Fe and other elements is absent, any geometry with the optimal ionization parameter () implies a particle density of order cm-3 at the assumed emitting region . Lower column densities increase the ionization parameter and the quoted models tend to become near-perfect reflectors thus exhibiting negligible emission features (Ross, Fabian, & Brandt 1996). A near-perfect reflector is also consistent with the absence of emission features in the spectrum of GRB 020405.
Below the ionization stage Fe+23, Fe K fluorescence emission might follow photoionization. Although the fluorescent line luminosity is typically independent of the ionization parameter , fluorescence is usually important when (Kallman, Mészáros, & Rees 2001). This implies that fluorescence might only occur if cm-3 for emission material within . The non-detection of Fe K at 6.4 keV appears to rule out significant fluorescence in a solar abundant medium.
4.3 Afterglow Continuum: The Photon Curtain Effect
Two general classes of models have been put forward to explain the reported GRB X-ray features. In the first instance, the “distant reprocessor” model assumes that the emitting material in a optically thick shell or ring is initially far enough from the afterglow front. Possible conditions of this scenario were discussed in §4.2 (See also Weth et al. 2000; Böttcher 2000). On the other hand, the “nearby reprocessor” model requires stellar-like gas densities near the GRB site and an ionizing continuum provided by an expanding bubble of magnetized plasma breaking through the stellar envelope (Mészáros & Rees 2001), by a pair screen scattering a substantial fraction of -rays backward (Kumar & Narayan 2002), or by continuing emission from the GRB source, e.g., a relativistic wind from a millisecond pulsar (Rees & Mészáros 2000). One difficulty when considering the “nearby reprocessor” model under the absence of significant line emission arises from our basic ignorance of the continuing ionizing source close to the progenitor. This is because the afterglow photons emitted by the jet at larger radii render disentangling the contribution close to the progenitor an almost infeasible task (Rees & Mészáros 2000). This effect is problematic for the detection of line emission as well since a “photon curtain” of afterglow continuum could swamp any discrete line emission. In GRB 020405, the bright continuum could mask line emission occurring well within a radius of emission () even for dense media ( cm-13). In summary, a long-lasting, bright afterglow continuum might hinder the detection of faint discrete line in the “nearby reprocessor” model unless favorable conditions that might attenuate the afterglow continuum (i.e. off-axis explosions, dark bursts?) are in place at the time of the observation.
5 Conclusions and Future Observations
Our analysis of various discrete X-ray emission models show that the pure power-law spectrum of GRB 020405 is adequately explained by a low-density medium with cm-3, or alternatively by a “photon curtain” effect produced by the afterglow continuum in a dense “nearby reprocessor” scenario. In the future, as the rapidity of localization improves, high-resolution spectroscopy could play a decisive role in resolving the emission mechanism (Paerels et al. 2000).
Figure 4 shows a simulated Gaussian line profile for Fe K with line width and flux identical to those reported for GRB 991216 (Piro et al. 2000), added to the observed power-law spectrum of GRB 020405. A Fe K line with similar properties would have been clearly detected in our LETGS spectrum. But quite possibly the major accomplishment of the Chandra LETGS in grating spectroscopy could come in the detection of medium- elements, , where its higher effective area and sensitivity are superior to other instruments on board Chandra. Continuous high-resolution spectroscopy might also provide an avenue to detect a change in the emission mechanism as a function of time i.e., from recombination to fluorescence. In summary, our results confirm the need for further high-resolution observations to improve the significance of previous claims of detections for discrete features in GRB afterglows.
References
- (1) Antonelli, L. A. et al. 2000, ApJ, 545, L39
- (2) Ballantyne, D. R., & Ramirez-Ruiz, E. 2001, ApJ, 559, L83
- (3) Band, D., et al. 1993, ApJ, 413, 281
- (4) Bersier, D., et. al 2002, preprint (astro-ph/0206465)
- (5) Böttcher, M. 2000, ApJ, 539, 102
- (6) Chevalier, R. A., & Li, Z.-Y. 2000, ApJ, 536, 195
- (7) Halpern, J. P., Thorstensen, J. R., Helfand, D. J., & Costa, E. 1998, Nature, 393, 41
- (8) Harrison, F. A., et al. 2001, ApJ, 559, 123
- (9) Hurley, K. et al. 2002, GCN Circ. 1325
- (10) in’t Zand, J. J. M., et al. 2001, ApJ, 559, 710
- (11) Kallman, T. R., & Bautista, M. 2001, ApJ, 133, 221
- (12) Kallman, T. R., Mészáros, P., & Rees, M. J. 2001, preprint (astro-ph/0110654)
- (13) Kumar, P. & Narayan, R. 2002, preprint (astro-ph/0205488)
- (14) Lazzati, D., Campana, S., & Ghisellini, G. 1999, MNRAS, 304, 31
- (15) Lazzati, D., Ramirez-Ruiz, E., & Rees, M. 2002, ApJ, 572, L57
- (16) MacFadyen, A., Woosley, S., & Heger, A. 2001, ApJ, 550, 410
- (17) Masetti, N., Palazzi, E., Pian, E., Hjorth, J., Castro-Tirado, A., Boehnhardt, H., & Price, P. 2002, GCN Circ. 1330
- (18) Mészáros, P. & Rees, M. J. 2001, ApJ, 556, L37
- (19) Paerels, F., Kuulkers, E., Heise, J., & Liedahl, D. A. 2000, ApJ, 535, L25
- (20) Piro, L., et al. 1999, ApJ, 514, 73
- (21)
- (22) Piro, L., et al. 2000, Science, 290, 955
- (23) Price, P. A., Schmidt, B. P., & Axelrod, T. S. 2002a, GCN Circ. 1326
- (24) Price, P. A., et al. 2002b, preprint (astro-ph/0208008)
- (25) Rees, M. J., & Mészáros, P. 2000, ApJ, 545, L73
- (26) Reeves, J. N. et al. 2002, Nature, 416, 512
- (27) Ricker, G., et al. 2001, GCN Circ. 1075
- (28) Ross, R. R., Fabian, A. C., & Brandt, W. N. 1996, MNRAS, 278, 1082
- (29) Ross, R. R., Fabian, A. C., & Young, A. J. 1999, MNRAS, 306, 461
- (30) Rutledge, R. E., & Sako, M. 2002, preprint (astro-ph/0206073)
- (31) Sari, R., Piran, T., & Halpern, J. P. 1999, ApJ, 519, L17
- (32) Seaton, M. J. 1959, MNRAS, 119, 81
- (33) Tarter, C. B., Tucker, W. H., & Salpeter, E. E. 1969, ApJ, 156, 943
- (34) Vietri, M., Ghisellini, G., Lazzati, D., Fiore, F., & Stella, L. 2001, ApJL, 550, L43
- (35) Weth, C., Mészáros, P., Kallman, T., & Rees, M. J. 2000,ApJ, 534, 581
- (36)
| Ion | ) | EW(keV)aaRest-frame equivalent width measurement based on a fixed line width model and continuum level derived from the power-law fit. | bbIndicates lower limit of recombination coefficient assuming T K at the time of the observation. | ||
|---|---|---|---|---|---|
| Ni XXVIII | 8.00 | 5.0 | 2.33 | 3.42 | 1.78 |
| Co XXVII | 7.40 | 3.5 | 1.63 | 3.11 | 8.60 |
| Fe XXVI | 6.97 | 1.12 | |||
| Fe XXV | 6.70 | 1.00 | |||
| Fe XXIV | 6.40 | 1.03 | |||
| Ca XX | 4.11 | 3.9 | 1.42 | 1.42 | 2.29 |
| Ca XIX | 3.90 | 4.5 | 1.60 | 2.29 | |
| Ar XVIII | 3.32 | 4.7 | 1.58 | 1.07 | 3.63 |
| Ar XVII | 3.14 | 3.7 | 1.22 | 3.63 | |
| S XVI | 2.62 | 3.1 | 0.95 | 7.77 | 1.62 |
| S XV | 2.46 | 5.2 | 1.56 | 1.62 | |
| Si XIV | 2.01 | 4.7 | 1.42 | 5.39 | 3.55 |
| Al XIII | 1.73 | 5.6 | 1.47 | 4.39 | 2.95 |
| Mg XII | 1.47 | 6.9 | 1.71 | 3.51 | 3.80 |
| Mg XI | 1.35 | 7.9 | 1.88 | 3.80 | |
| Na XI | 1.24 | 4.4 | 1.02 | 2.75 | 2.14 |
| Ne X | 1.02 | 5.5 | 1.15 | 2.09 | 1.23 |
| Ne IX | 0.92 | 6.4 | 1.24 | 1.23 | |
| O VIII | 0.65 | 6.1 | 0.93 | 1.10 | 8.51 |
| O VII | 0.57 | 6.0 | 0.82 | 8.51 | |
| N VII | 0.50 | 7.1 | 0.87 | 7.45 | 1.12 |
| C VI | 0.37 | 6.8 | 0.65 | 4.75 | 3.63 |