The Draco and Ursa Minor dwarf spheroidals.
A comparative study.
††thanks: Based on observations made with the Italian Telescopio Nazionale
Galileo (TNG) operated on the island of La Palma by the Centro
Galileo Galilei of the CNAA (Consorzio Nazionale per l’Astronomia e
l’Astrofisica) at the Spanish Observatorio del Roque de los Muchachos
of the Instituto de Astrofisica de Canarias.
Abstract
We present photometry of two wide ( arcmin2) fields centered on the low surface brightness dwarf spheroidal galaxies Draco and Ursa Minor. New estimates of the distance to these galaxies are provided ( and ) and a comparative study of their evolved stellar population is presented. We detect for the first time the RGB-bump in the Luminosity Function of UMi () while the feature is not detected in Draco. Photometric metallicity distributions are obtained for the two galaxies and an accurate analysis to determine the intrinsic metallicity spread is performed by means of artificial stars experiments. The adopted method is insensitive to stars more metal poor than and it rests on the assumpion that the age spread in the considered populations is small (i.e. the impact of the actual age spread on the colors of the RGB stars is negligible). We find that, while the average metallicity of the two galaxies is similar ( and ) the metallicity distributions are significantly different, having different peak values ( and ) and different maximum metallicities. We suggest that such differences may be partly responsible for the difference in HB morphology between the two galaxies. The intrinsic metallicity spread is in UMi and in Draco. We demonstrate that the inner region of UMi is significantly structured, at odds with what expected for a system in dynamical equilibrium. In particular we show that the main density peak of UMi is off-centered with respect to the center of symmetry of the whole galaxy and it shows a much lower ellipticity with respect to the rest of the galaxy. Moreover, UMi stars are shown to be clustered according to two different characteristic clustering scales, as opposite to Draco, which instead has a very symmetric and smooth density profile. The possible consequences of this striking structural difference on our ideas about galaxy formation are briefly discussed. Combining our distance modulus with the more recent estimates of the total luminosity of UMi, we find that the mass to light (M/L) ratio of this galaxy may be as low as , a factor 5-10 lower than current estimates.
1 Introduction
The Draco (, ) and Ursa Minor (, ) dwarf spheroidal (dSph) galaxies are the faintest known members of the Local Group of galaxies and they are among the lowest surface brightness members of the group (Mateo, 1998). They appear to be dominated by very old (age Gyr) and metal deficient () stellar populations (see Mateo, 1998; Carney & Seitzer, 1986; Aparicio, Carrera & Martinez-Delgado, 2001; Grillmair et al., 1998; Mighell & Burke, 1999; Dolphin, 2002), thus they may represent a very early and elementary stage of the evolution of the building blocks that may have had a primary role in the assembly of the Milky Way galaxy (see Bellazzini, Ferraro & Pancino, 2001b). Furthermore, they are reported to have the highest Mass to Light (M/L) ratio of any other known galaxy (e.g., up to for Draco, and , for UMi, see Kleyna et al., 2001; Armandroff, Olszewski & Pryor, 1995). Hence their stellar content may just represent the handful of baryons trapped in a system whose true nature is that of a huge dark halo. All these exceptional properties have made these galaxies a classical case of study. Nevertheless, serious observational problems (e.g., the very low surface brightness that requires very wide field photometry to obtain statistically significant samples of members stars) have hampered our knowledge of these intriguing stellar systems.
Draco and UMi are twin galaxies under many aspects: they have a similar distance from the center of the Galaxy, similar masses and luminosities, similar metal content and are both devoid of gas (see Table 3 for a summary of their physical parameters). In this context, a comparative study performed with strictly homogeneous observational material and with the same data reduction / data analysis techniques may reveal interesting features. Here we present the results of a comparative analysis, performed by obtaining well calibrated (V,I) photometry of the evolved stars of Umi and Draco over a field of view arcmin2, under strictly homogeneous conditions (see Bellazzini et al., 2001, for a discussion of the possible problems associated with the comparison of non-homogeneous photometries).
The plan of the paper is as follows: in §2 we describe the observational material, the data reduction process and the photometric calibration; in §3 we present the Color Magnitude Diagrams (CMD) and the results of artificial stars experiments; §4 is devoted to the estimate of the distance to Draco and Umi; in §5 we study the properties of the Red Giant Branch of the two galaxies. In §6 we compare the structures of Dra and UMi and we demonstrate that the inner region of UMi is significantly structured and that its stars are clustered according to two different characteristic scale-lenghts. §7 is dedicated to the discussion of our results.
2 Observations and Data Reduction
2.1 Observations
The data were obtained at the 3.52 Italian telescope TNG (Telescopio Nazionale Galileo - Roque de los Muchachos, La Palma, Canary Islands, Spain), using DoLoRes, a focal reducer imager/spectrograph equipped with a pixels thinned and back-illuminated Loral CCD array (gain, read-out noise ADU rms). The pixel scale is arcsec/px, thus the total field of view of the camera is . The observations were carried out during three nights (March 19, 20 and 21, 2001), under average seeing conditions ( arcsec). The first and third nights of the run were photometric. The scientific exposures taken during the second night were calibrated indirectly by using the data acquired in the photometric nights.
Each galaxy was sampled with a square mosaic of nine partially overlapping fields, covering a total field of fiew of . For each field two V and two I exposures ( s in each filter for Dra, and s for UMi) were secured.
2.2 Data Analysis
All the raw images were corrected for bias and flat field, and the overscan region was trimmed using standard IRAF111IRAF is distributed by the National Optical Astronomy Observatory, which is operated by the Association of Universities for Research in Astronomy, Inc., under cooperative agreement with the National Science Fundation. procedures. Each pair of images, in each band, has been averaged, so that the final analysis was performed on averaged V and I images.
The PSF-fitting procedure was performed independently on each V and I average image, using a version of DoPhot (Schechter, Mateo, & Saha, 1993) modified by P. Montegriffo at the Bologna Observatory to read images in double precision format. The frames were searched for sources adopting a 5- threshold, and the spatial varations of the PSF were modeled with a quadratic polynomial. A final catalogue listing the instrumental V,I magnitudes for all the stars in each field has been obtained by cross-correlating the V and I catalogues. Only the sources classified as stars by the code have been retained. The spurious sources erroneously fitted by DoPhot (as cosmic rays, bright background galaxies etc.) have been removed by hand from the catalogues.
Nine different catalogs (one for each sub-field of the mosaic) were obtained for each galaxy. These catalogue were reported to a homogeneous photometric system using the large sets of stars in common among the various fields. The magnitudes of the stars in common among adjacent fields were averaged. A homogeneous total catalogue of instrumental magnitudes and positions was finally obtained obtained for each mosaic field.
2.3 Photometric calibration
The absolute calibration has been obtained from several repeated observations of Landolt (1992) standard fields, including all the stars listed in the extended catalogue of calibrators provided by Stetson (2000). The coefficents of atmospheric extintion () were directly obtained by repeated observations of the same standard field at different airmasses. Accurate estimates of the aperture correction were obtained with a large number of bright and isolated stars. The final calibration equations and are shown in Fig. 1.

The accuracy of the photometric calibration was checked by comparison with the independent (V,I) photometry of the Draco dSph (kindly provided by Prof. P. Stetson, private communication), and with the V photometry of UMi from Stetson (2000). The results of this test are shown in Fig 2 where the difference between our photometry (subscript t.w., e.g. this work) and the one by Stetson (subscript S00) is plotted as a function of magnitude for both galaxies. Unfortunately no previous I band photometry of UMi is available. The comparison suggests that the global uncertainty in the calibration is lower than mag in each passband, over the whole range of color sampled. The equations shown in Fig. 1 were applied to the catalogs described in §2.2 to produce the final calibrated catalogs that are reported in Table 1 and Table 2. In each table we report: (column 1) the identification number, (col. 2 and 3) the V magnitude and its error as estimated by DoPhot (see §3.1, below), (col. 4 and 5) I magnitude and error, (col. 6 and 7) the position in the mosaic in pixels, (col. 8 and 9) the position in the sky in equatorial coordinates at the equinox 2000.0, (col. 10) the classification of the identified variable stars, if available and (col. 11) the name of the identified variable stars according to the nomenclature indicated in the table note. The photometric errors as estimated from artificial stars experiments will be shown and discussed in §3.1.

3 The Color Magnitude diagram
The final (V, V-I) Color Magnitude Diagrams (CMD) of the two galaxies are shown in Fig. 3. In both cases our photometry reaches the base of the Red Giant Branch (RGB) at .
The RGBs are well defined and steep, typical of metal poor stellar systems. The RGB of UMi appears to be narrower than the one of Draco, suggesting a smaller metallicity spread or a similar metallicity spread but a lower mean metal content. In the CMD of UMi a hint of the Asymptotic Giant Branch (AGB) bump (see Ferraro et al., 1999) can be noted (at ,) while the corresponding feature of Draco is probably hidden by the larger extent of contamination by foreground and background stars. Note the sharp color cut-off of the distribution of field stars at , corresponding to the Main Sequence Turn Off (MSTO) of the Galactic halo/thick disk stars (Morrison et al., 2000). Both Eskridge & Schweitzer (2001) and Shetrone, Coté & Stetson (2001) found that some stars lying to the blue of the upper RGB are members of the respective galaxy, either in Draco or in UMi. The same authors have also demonstrated that all of these stars are not first-ascent red giants, but carbon stars instead.
Most of the Horizontal Branch (HB) stars lie in the range in UMi and in Draco. We have counter-identified 65 variable stars in UMi from the catalogue of Nemec, Wehlau & Mendes de Oliveira (1988, hereafter N88), that cover our whole field of view. In Fig. 3 we have marked the type ab RR Lyrae with open squares, the type c RR Lyrae with open triangles and the Anomalous Cepheids with open circles, after the classification by the same authors. In Draco 56 variable stars were counter-identified in the central field, from the study by Baade & Swope (1961). Since an explicit classification is not provided by Baade & Swope (1961) we marked all the RR Lyrae variables with stars, while the only Anomalous Cepheid identified is plotted as an open circle, as in the previous case. However, it has to be recalled that, according to Baade & Swope (1961), the large majority of RR Lyrae in Draco are of type ab (see also Nemec, 1985).
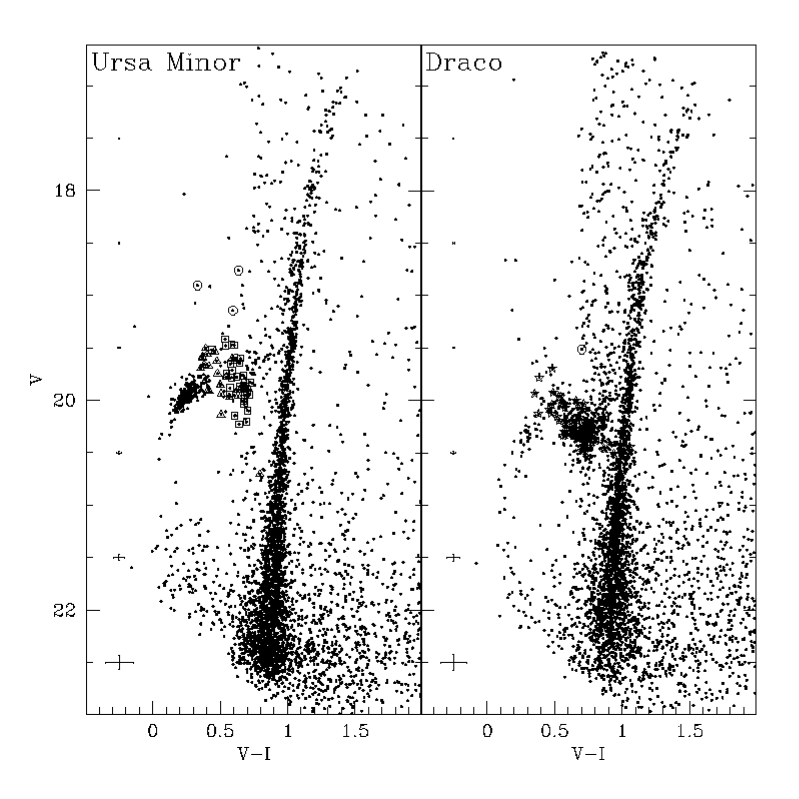
As already noted by other authors the morphology of the two HBs is very different. UMi has only an handful of HB stars to the red of the instability strip, a significant number of RR Lyrae variables of both Bailey’s types and a well populated blue tail reaching and . On the other hand the HB of Draco is well populated in its red part and has a sparse blue tail, reaching . As can be seen from Fig. 3 there is a large number of stars in the red part of the instability strip (see also Fig. 4, below), suggesting that the census of RR Lyrae variables in this galaxy is far from complete. A modern CCD search for variables over a wide field of view is urged.
Finally, at and the upper part of a Blue Plume is evident in both CMDs. This is a well known feature of the CMD of these galaxies and has been preferentially interpreted as a sequence of genuine Blue Straggler stars, e.g., the result of the evolution of binary stars (Carney & Seitzer, 1986; Grillmair et al., 1998; Mighell & Burke, 1999; Carrera et al., 2002; Aparicio, Carrera & Martinez-Delgado, 2001).
3.1 Artificial stars experiments
We have performed extensive artificial stars experiments in the central field of each mosaic, i.e. the fields with the highest stellar density. We take the results from these fields as representative of the whole mosaics. More than 5000 stars per field have been extracted from a Luminosity Function (LF) similar to the observed one, and with colors lying on the observed RGB ridge line of the galaxies, following the methods described in detail in Bellazzini et al. (2002a, b). The artificial stars have been simultaneously added to the V and I frames, at a time, with a minimum distance among them of px, to avoid undesired interference among artificial stars (see Bellazzini et al., 2002b, for details and references). The stars are simulated with the observed Point Spread Function and the complete data-reduction process has been repeated for all the frames “enriched” with the artificial stars.

In the present context we performed the artificial stars experiment to obtain:
-
1.
A realistic estimate of the photometric error as a function of magnitude, by comparing the a priori known input magnitudes with the measured (output) magnitudes. This result is shown in Fig. 4. The average error in lower than 0.05 mag in both passbands for and for fainter magnitudes.
-
2.
The effect of the “observation plus data reduction” process on the measured magnitudes and colors of stars lying along the RGB of a Simple Stellar Population (SSP; e.g. a population of stars all having the same age and chemical composition; see Renzini & Fusi Pecci, 1988). This result (shown in the upper panels of Fig. 5) will be very useful to discriminate the color spread due to the intrinsic metallicity dispersion from the observational scatter.
-
3.
The completeness factor (, i.e. the ratio between the artificial stars correctely recovered and measured and the total number of simulated stars) as a function of magnitude. The lower panels of Fig. 5 show that, in both mosaics, the completeness is very high ( %) down to .

4 The distance to UMi and Dra
4.1 Relative distance
As a first step we determine the relative distance modulus of the two galaxies. Since they two are affected by the same amount of interstellar extinction (E(B-V) Mateo, 1998; Schlegel, Finkbeiner & Davis, 1998) and they share a similar metal content (Mateo, 1998), such estimate can be obtained by finding the best match between the HBs. The upper panel of Fig. 6 shows a zoomed view of the HB of UMi. The RR Lyrae are plotted as open stars. The stars not recognized as variables by N88 but lying in the range of color and magnitude covered by the RR Lyrae sampled at random phase are plotted as dots, while the stars to the red and to the blue of this region are plotted as solid circles. The solid line in the instability strip is the mean RR Lyrae level () according to N88. The solid heavy line is the ridge line tracking the mean of the HB distribution of UMi. The dashed lines are displaced by mag from the ridge line and roughly bounds all the non-variable HB stars of UMi..

In the lower panel of Fig. 6 the HB ridge line of UMi has been shifted to match the HB of Draco, that has been plotted with the same symbols used above. The fit is made difficult by the different HB morphology, but the solution obtained here with a shift of mag in V and in V-I appears as the best possible match. The derived relative distance modulus is . The result is in good agreement with the difference of moduli that can be obtained from Table 2 of Mateo (1998), i.e. .
4.2 Comparison with template clusters
An indirect estimate of and of the distance modulus can be obtained by finding a match with the HB of well studied template clusters of similar metallicity, for which a robust direct estimate of is available (see, e.g. Montegriffo et al., 1998, and references therein).
In Fig. 7 we report the results of the comparison with the photometry of M 68 () by Walker (1994). The HB of UMi (upper panel) and Draco (lower panel) are plotted with the same symbols as Fig. 6, while the stars of M 68, shifted to match the HB of UMi and Dra, are represented by open circles. The solid line is the mean level of the RR Lyrae in M 68 (, according to Walker, 1994) after the application of the shift needed to provide the match.
A good match is found between the HB of M 68 and UMi applying a shift of mag in V to the stars of M 68. Using the above quoted of M 68, and propagating all the uncertainties is inferred, in excellent agreement with the estimate by N88. We derive also the level of the Zero Age Horizontal Branch (, a quantity that is best suited for comparison with theoretical models) by applying the same to the value of M 68 reported by Ferraro et al. (1999, hereafter F99), . We obtain . Finally, taking into account the difference in reddening and adopting from F99 we obtain the following estimate for the distance modulus of UMi: , inclusive of all the uncertainties.

The HB morphology of Draco has no counterpart among the galactic globular clusters of similar metallicity. Hence, the fit with the HB of M 68 - shown in the lower panel of Fig. 7 -is worse than that found for UMi and do not provide a well constrained solution. However, with the adopted shift we obtain results that are in full agreement with the differential distance between UMi and Draco derived in §4.1. With the same procedure described above we obtain for Draco: , and
In Fig. 8 are reported the results of the comparison with the HST photometry of M 92 () by Ferraro and co-workers (Ferraro et al., in preparation), that is also in good agreement with the well calibrated ground-based photometry by Johnson & Bolte (1998). The symbols and the procedure are the same adopted in Fig. 7 for the comparison with M 68.
Also in this case a good match is obtained for UMi (upper panel), with the shifts reported in the figure. We adopt larger uncertainties in the derived quantities, with respect to the case of M 68, since M 92 is slightly more metal poor than UMi (and Draco). Adopting from Kopacki (2001) we obtain , again in excellent agreement with N88 as well as with the results from Fig. 7. Adopting from F99 it is obtained , in agreement with what found above. Finally, adopting from F99, it is obtained .

M 92 appears to provide a better match to the HB of Draco, with respect to M 68 (Fig. 8, lower panel). With the same assuptions as above, we obtain for Draco: , and . The overall agreement with the results obtained from the comparison with M 68 is fully satisfying.
In conclusion, we adopt the weighted mean of the results obtained above for , and . The final results are , , for UMi, and , , for Draco. The adopted distance moduli are and
4.3 A consistency check: the RGB Tip
The use of the Tip of the Red Giant Branch (TRGB) as a standard candle is a powerful technique to estimate the distances to galaxies that host old stellar populations (see Madore & Freedman, 1998, and refereces therein). Bellazzini, Ferraro & Pancino (2001a) have recently provided a new robust calibration of the zero-point of the relation between the absolute I magnitude of the tip () and the metallicity that is independent of the distance scale based upon classical standard candles (RR Lyrae, Cepheids). This new calibration prompted us to start a large observational programme aimed at a re-assessment of the distances to Local Group galaxies based on the TRGB technique. The present study is the first of a series describing the results of this program. Unfortunately, despite the large field sampled, UMi and Draco have too few stars (and a too low surface brightness) to allow an individual safe application of the TRGB technique (see Sakai, Madore & Freedman, 1996; Madore & Freedman, 1995, hereafter MF95). However, it is of great interest for the final scope of the project to check if the distance of these galaxies is consistent with the new TRGB distance scale.

To do this check we adopt the shift derived in §4.1 to move Draco at the distance of UMi and we try to detect the TRGB from the merged sample, having now a number of stars nearly double with respect to each individual case. In the left panel of Fig. 9 we report the composite (I;V-I) CMD of the two galaxies together, after the application of the quoted shift to Draco. The right panels of Fig. 9 report the actual detection of the TRGB using the standard technique, as defined by Sakai, Madore & Freedman (1996). The sharp cut-off of the Luminosity Function (LF) of the RGB (that is the actual observational marker of the TRGB) is clearly visible in the histograms shown in the upper and middle right panels. The edge-detector Sobel filter shows the TRGB as the most pronounced peak at I=. The considered sample has 100 stars in the upper 1-magnitude bin, however, from the CMD of field stars we estimate that % of them are likely foreground sources. Hence the actual number of stars in the uppermost 1-mag bin is in fact . By means of numerical simulations MF95 showed that a reasonably safe detection of the TRGB can be made only if , thus it is likely that our detection overestimates the actual I magnitude of the tip. To quantify this systematic error we repeat the MF95 numerical experiment. We adopted the ridge line of M 68 as an RGB template and a model RGB-LF of the same form as the one used by MF95, imposing a cut-off at . Then we randomly generated 100 synthetic RGBs for each of the following cases: , and we detected the tip of each synthetic RGB with the standard technique. Observational errors extracted from a gaussian distribution with similar to those of the observed stars were added to each synthetic star before the TRGB detection. The average of the 100 simulated RGBs and the corresponding standard deviations are plotted as a function of in Fig. 10. The results by MF95 are confirmed: for the estimate from the standard technique is within mag from the true TRGB and the standard deviation is mag. The efficiency of the method drops suddenly for and the associated uncertainty becomes or larger. The difference between the true luminosity of the tip and the observed one can be modeled with a first order polinomial as a function of , for :
In the present case, with , , thus our final estimate for the TRGB location is , where we have considered also the uncertainties associated with the correction and with the Dra-UMi shift we have applied to obtain the considered merged sample. The galaxies are dominated by a metal poor population quite similar to that of the template used by Bellazzini, Ferraro & Pancino (2001a), that obtained at , for the globular cluster Centauri. Adopting , we obtain and for UMi and Draco respectively, in good agreement with the results of §4.2.

Hence we conclude that the distance moduli derived in §4.2 are fully consistent with the TRGB distance scale as calibrated by Bellazzini, Ferraro & Pancino (2001a).
5 The stellar content of Umi and Draco
5.1 The RGB bump
The RGB-Bump is an evolutionary feature occurring along the RGB which flags the point where the H-burning shell crosses the chemical discontinuity left by the maximum penetration of the convective envelope. Theoretical models predict that the position of the RGB-Bump is mainly driven by metallicity, with a mild dependence on age (see F99 and references therein).
From the observational point of view the feature was observed for the first time in a globular cluster by King, Da Costa & Demarque (1985) and it was only recently identified in a significant number of clusters (Fusi Pecci et al., 1990; Zoccali et al., 1999, F99). The first detection of the RGB-Bump in a galaxy is very recent too. Majewski et al. (1999) identified a double RGB-bump in the Sculptor dwarf spheroidal and took this evidence as indicative of the presence of two populations of different metallicities. A very similar feature has been revealed also in the Sextans dSph by Bellazzini, Ferraro & Pancino (2001b). At present, these are the only two detections of the RGB-bump ever obtained in stellar systems other than globulars.
The change in the slope of the cumulative luminosity function (LF) and the excess of star counts in the differential LF of the RGB are the main tools to identify the RGB-Bump. In particular Fusi Pecci et al. (1990) suggest that the change in the slope of the cumulative LF is the safest indicator of the RGB-Bump. In Fig. 11 the differential and cumulative LFs of the RGB in the region of the bump are shown for both galaxies.

The RGB-bump is clearly detected in UMi at . This is the first single RGB-bump ever detected in a galaxy. On the other hand, there is no sign of this feature in the LF of Draco. We argue that a larger spread of metallity and/or age in the stellar population of Draco, with respect to UMi, is responsible for the smearing of the RGB-bump feature in this galaxy (see §5.2). This suggests that these dSphs - that are quite similar under many aspects (see Bellazzini, Ferraro & Pancino, 2001b, and references therein) - had different evolutionary histories at early times.
The magnitude difference between the RGB-bump and the HB level () has been used by Fusi Pecci et al. (1990), and later by F99 and Zoccali et al. (1999), to compare the observations with the theoretical predictions. The parameter is mainly a function of the metallicity and it has only a mild dependence on age. Adopting the ZAHB levels obtained in §4.2, we obtain for UMi . Since it has been shown that UMi is dominated by a very old population that formed in a rather short timescale (Carrera et al., 2002; Mighell & Burke, 1999; Feltzing, Gilmore & Wyse, 1999; Dolphin, 2002) we can safely use the parameter as an indicator of the mean metal content of the old stars. We use the data by F99 to obtain a fit of as a function of , adopting the metallicity scales by Zinn & West (1984) (ZW) and Carretta & Gratton (1997) (CG). It is found:
5.2 The metallicity distributions
In Fig. 12 the (I,V-I) distribution of the upper RGB of UMi (left panel) and Draco (right panel) are compared with the ridge lines of the template globular clusters NGC 6341, NGC 6205 and NGC 288, from left to right, taken from the homogeneous set by Saviane et al. (2000). In the Zinn & West (1984) metallicity scale the templates have and respectively, while in the Carretta & Gratton (1997) scale their metallicities are and respectively. The metallicities, distance moduli and reddenings of the templates are taken from F99. For the two galaxies we adopted the estimates of §4. The meaning of the horizontal lines and of the large empty symbol will be discussed in §5.2.1.

The large majority of the UMi RGB stars are enclosed between the ridge lines of NGC 6341 and NGC 6205, implying a mean metallicity around in good agreement with the result found in §5.1 as well as with previous estimates, either photometric or spectroscopic (see Carrera et al., 2002; Shetrone, Coté & Sargent, 2001, and references therein). The RGB of Draco seems slightly redder than the one of UMi, suggesting a mean metallicity , also in agreement with previous estimates (see Aparicio, Carrera & Martinez-Delgado, 2001; Shetrone, Coté & Sargent, 2001, and references therein). Both galaxies result significantly more metal rich (by dex) if the CG metallicity scale is adopted, as a natural consequence of the higher metallicity value of all the adopted templates in this scale. Independently of the assumed scale, it is clear that the color spread along the RGB of both galaxies is significantly larger than the photometric scatter (see Fig. 4), thus we confirm the presence of an intrinsic metallicity spread (Shetrone, Coté & Sargent, 2001; Carrera et al., 2002; Aparicio, Carrera & Martinez-Delgado, 2001).

The RGB color of old populations is mainly driven by the metal content of the stars. Based on this principle, photometric Metallicity Distributions (MD) can be obtained by suitable interpolation between a grid of metallicity templates, a technique that has been widely applied in recent years (see, e.g. Holland, Fahlman & Richer, 1996; Harris & Harris, 2000; Saviane et al., 2000, and references therein). Here we obtained the MDs shown in Fig. 13 and Fig. 14 by interpolating in color between the RGB ridge-lines of the adopted templates (see Fig. 12) for the stars in the magnitude range . While the accuracy of the single metallicity estimate is low, the main characteristics of the distribution as a whole (as, for instance, its mean and dispersion) are quite robust, being based on a large number of stars. This technique is particularly appropriate in the present case since we know that both galaxies are dominated by very old stellar populations (Mighell & Burke, 1999; Grillmair et al., 1998; Dolphin, 2002; Aparicio, Carrera & Martinez-Delgado, 2001; Carrera et al., 2002). However, the actual metallicity spread derived with this technique (a) is the convolution of the intrinsic metallicity spread with the color spread due to observational scatter and, (b) the impact of this latter factor depends on the mean metallicity, since the same observational scatter should produce a larger (apparent) metallicity spread in the low metallicity regime, where the RGB ridge lines are steeper, with respect to the high-metallicity regime. In fact, decreases with increasing metallicity. To deal with this problems we compare the observed photometric MDs with those of the recovered artificial stars shown in Fig. 4, that closely model the CMD of a SSP observed and reduced under the same conditions as real stars.

In Fig. 13 the MD of Draco (right panels) and the MD of corresponding synthetic SSP (left panels; see Fig. 5) are compared. All the MDs are normalized to their maximum value. The upper panels show the histograms in the ZW scale. The total number of included stars is reported in the upper right corner. The middle and lower panels show the generalized histograms (continuous lines) in the ZW scale and in the CG scale, respectively (see Holland, Fahlman & Richer, 1996; Laird et al., 1988, and references therein). The measured standard deviation () is reported in the upper right corner of each panel. The MD of the synthetic SSP represents the response of the whole procedure to the pure observational scatter, or in other words is the observed version of a true metallicity distribution having the form of a Dirac delta function. The plots in the left panels of Fig. 13 demonstrate that the observational scatter produce a sizeable (spurious) metallicity spread. To obtain a sensible measure of the true intrinsic metallicity spread we have to deconvolve this “response function” from the observed distributions shown in the right panels of Fig. 13. The dotted lines are the gaussian distributions obtained by deconvolving the response function from a gaussian distribution having the same mean and standard deviation of the observed distributions. The standard deviation of the dotted curves is a good estimate of the true intrinsic metallicity spread .
In the ZW scale the MD of Draco spans more than 0.6 dex. The mean and median metallicities are , while the mode is . The intrinsic scatter is dex. There is a marginal indication of a secondary peak at lower metallicty, but the statistical significance of this feature is low, thus we don’t comment further on it. These estimates are in good agreement with the results of the spectroscopic analysis by Lehnert et al. (1992) and Shetrone, Coté & Sargent (2001). The detailed comparison between our photometric estimates and the study of Shetrone, Coté & Sargent (2001) is discussed in §5.2.1, below. Our method is insensitive to very metal poor stars (), so they are obviously not represented in our metallicity distribution. However from Fig. 12 it may be evinced that the number of possible RGB stars bluer (i.e. more metal poor) than the NGC 6341 template (at ) should be small in both galaxy (see §5.2.1 for further details).
In Fig. 14 the MDs of UMi and of its synthetic SSP are reported in the same way as in Fig. 13. It can be appreciated that though the photometric scatter is very similar for Draco and UMi (see Fig. 4) the response function has a larger in the case of UMi. This is due to larger sensitivity of metallicity to color at the most metal poor regime described above. In the ZW scale the MD of UMi spans a range nearly as wide as that of Draco. The mean and median metallicities are , while the mode is . The intrinsic scatter is dex. Also in this case the agreement with results of other studies (Shetrone, Coté & Sargent, 2001; Aparicio, Carrera & Martinez-Delgado, 2001) and with the constraints obtained in §5.1 is quite good.
From the comparison of the MDs of the two galaxies we can conclude that Draco is slightly less metal deficient than UMi, in average, and it presents a slightly larger metallicity spread. The parameters obtained from the photometric MDs (for Draco and UMi and for both metallicity scales) are summarized in Table 3.
The MDs in the CG scale are remarkably similar to the MDs in the ZW scale described above, but, as expected, are shifted to higher metallicities and show a slightly larger spread, thus the conclusions drawn above are unchanged. On the other hand, it is important to remark that the comparison of the observed distributions with chemical evolution models would lead to different conclusions depending on the assumed metallicity scale. In particular, by adopting the CG scale, one should conclude that the first stars in Draco and UMi formed from an ISM already relatively enriched and reached a more advanced stage of chemical evolution than suggested by the ZW scale. This kind of uncertainties in the metallicity scales may have other dangerous drawbacks, hampering our interpretation of astrophysical data in several cases (see, e.g. Catelan et al., 2001).
5.2.1 Comparison with spectroscopic estimates
A detailed comparison with the recent results by Shetrone, Coté & Sargent (2001) may be useful to check the consistency between high-resolution spectroscopic abundances and photometric metallicity estimates. The stars observed by Shetrone, Coté & Sargent (2001) are plotted in Fig. 12 as large empty symbols. Different symbols are adopted according to the metallicity estimates by Shetrone, Coté & Sargent (2001). Circles are stars with , pentagons have , squares have , and triangles have (actually, there are only two stars in this latter bin both having ). In both panels of Fig. 12, the dashed line is the expected level of the TRGB with the adopted distance moduli (from §4.2) and the TRGB calibration by Bellazzini, Ferraro & Pancino (2001a). The dotted lines enclose the full range of uncertainty in the expected magnitude of the TRGB, including observational and calibration uncertainties.
First of all we note that all the considered stars have , to within the uncertainties. This is compatible with the hypothesis that they are first ascent RGB stars, as suggested by Shetrone, Coté & Sargent (2001). Second, the metallicity rank derived from spectroscopy is correctly reproduced by our photometry: stars with higher spectroscopic metallicity estimates lie on redder RGB loci. Finally, the zero-point of the spectroscopic scale is in good agreement (within the uncertainties) with that derived from our photometry, if the CG metallicity scale is adopted. Three out of four of the stars in the more metal poor metallicity bin (circles) have and lie around the ridge line of NGC 6341 (). The two more metal rich stars (triangles, ) are slightly bluer than the ridge line of NGC 6205 (). Hence both the metal rich and the metal poor zero-points seems to agree quite well. The only exception is the star # 119 in Draco that is slightly redder than the ridge line of NGC 6341 and that, according to Shetrone, Coté & Sargent (2001) has . We have no suggestion to reconcile such a large discrepancy between color and spectroscopic metallicity, except for trying to repeat both measures.
If the ZW scale is adopted for the templates shown in Fig. 12 the consistency in the metal poor zero-point is preserved ( for NGC 6341) but a serious problem emerges at the metal rich end, where the two stars with lie to the blue of the template and the template (NGC 288) is more than 0.1 mag redder than these stars. The problem with star # 119 is not mitigated by the assumption of the ZW metallicity scale. Thus it appear that the adoption of the GC metallicity scale provide a much higher degree of consistensy between spectroscopic and photometric metallicity estimates, at least in the present case. The above comparison may suggest that the metallicities by Shetrone, Coté & Sargent (2001) are consistent with the CG scale which is also based on high-resolution measures.
Finally, another possible source of uncertainty in the photometric metallicity estimates is the small difference in the average abundance of -elements between Dra and UMi and the template clusters (see Shetrone, Coté & Sargent, 2001, and discussion therein).
5.3 Populations gradients
Radial population gradients are ubiquitous in dwarf galaxies (see Harbeck et al., 2001; Saviane et al., 2001; Hopp et al., 2000; Tosi et al., 2001, and references therein). Almost in all cases old/metal poor stars are found to be more abundant in the outer regions of dwarf galaxies, while more metal rich and/or younger stars are preferentially found near center of galaxies (Harbeck et al., 2001). Here we look for population gradients by using the fraction of blue HB stars (i.e. those with ) in different concentric radial annuli. The small number of available HB stars limits the spatial resolution to just three annuli. The results are shown in Fig. 15. In UMi (upper panel), the fraction of BHB stars appears to rise slightly in the inner 4 arcmin. However the effect is at less than , and the data are consistent with no population gradient, in agreement with what found by Carrera et al. (2002). The opposite effect is found in Draco (lower panel): the BHB fraction drops by a factor 2 in the inner 4 arcmin, i.e. the classical gradient described above, with more metal rich and/or younger stars clustered in the central region. The significance of the result is just marginal (), thus not in disagreement with the null detection reported by Aparicio, Carrera & Martinez-Delgado (2001).

6 Structure
We take advantage of our well defined CMDs to select likely members of UMi and Draco with which reliable density contour maps can be obtained. The upper panels of Fig. 16 show the adopted selections, while in the lower panels of the same figure the isodensity contour maps of the selected members of UMi and Draco are shown. Our maps cover the inner regions of the galaxies, within 1-2 core radii (), and are obtained by computing the stellar density on an uniform grid with points spaced by 100 px. At each point of the grid the density is computed over a circle of radius arcmin. This choice provides a suitable degree of smoothing and minimizes the effects of possible small empty regions (f.i, saturated stars or dead CCD columns). The continuous lines are isodensity contours starting from 1 and spaced by 0.5 . The innermost contour corresponds to 4.5 for UMi and to 6.0 for Draco. To give a term of comparison Kleyna et al. (1998) - using a sample with similar limiting magnitude - found a very similar value for the maximum density of UMi () and estimated the density of the background to be 0.31 at a distance of arcmin from the center of UMi, much farther out than our outermost isodense.
The structure of the two galaxies, as shown in Fig. 16, is in excellent agreement with previous results (Irwin & Hatzidimitriou, 1995; Kleyna et al., 1998; Piatek et al., 2002; Odenkirchen et al., 2001): the ellipticity, position angle and the ratio between the central surface brightness are the same as reported in the review by Mateo (1998). Draco is more dense and has a much smoother profile with respect to UMi. Its isodensity contours are quite regular, showing just a marginal trend toward more boxy shapes in the outer parts. On the other hand the inner contours of UMi appear quite structured and asymmetrical and deserve a deeper analysis and discussion.
The detection of small scale clustering and asymmetric structures in the inner parts of UMi has been claimed by many different authors since the early ’80 (see, e.g. Olszewski & Aronson, 1985; Irwin & Hatzidimitriou, 1995; Kleyna et al., 1998; Battinelli & Demers, 1999; Demers & Battinelli, 2001; Eskridge & Schweitzer, 2001), but a clear-cut demonstration of the statistical significance of such structures is still lacking. In Fig. 16 the isodensity contours up to 3.0 appear quite elongated but similar in shape and symmetrical. On the other hand the peak of density (;) is clearly off-centered with respect to the center of symmetry of the outer contours (;). We note that the density contrast between the density peak and the last symmetric contour is larger than 4 , i.e. quite significant. It is also remarkable that the off-centered main density peak displays a much rounder shape, with respect to the rest of the galaxy. On the other hand, the dotted contour (corresponding to a density of 3.2 ) is reported to show that the substructures in the NE region of the galaxy that are clearly visible in the maps by Irwin & Hatzidimitriou (1995) and Kleyna et al. (1998) are present also in our sample but have a low density contrast with respect to the last symmetric contour, thus low statistical significance, as concluded also by Kleyna et al. (1998).

It is important to remark that the only other spheroidal galaxy of the Local Group that has a clearly off-centered density peak is the Sagittarius dSph, whose structure is greatly strained by the Galactic tidal field (see Ibata et al., 1997; Newberg et al., 2002). Independent evidence of the effects of the Galactic tidal fields on UMi has been reported by Martinez-Delgado et al. (2001).
Kleyna et al. (1998) found significant asymmetry in the distribution of stars along the major axis. Here we concentrate on the clustering properties of UMi stars. We define as the distance of a given star to its n nearest neighbour. In the following we will show the results obtained with , i.e. the distance to the 200 nearest neighbour, but we remark that the results are preserved for a very wide range of (). In the upper panel of Fig. 17 the distributions of are shown for three template samples having the same dimensions of the observed ones ( member stars per galaxy). The dotted curve is the distribution of a sample randomly drawn from a uniform distribution. The continuous line and dashed lines are the distributions of samples drawn from an elliptical Gaussian distribution having and , and and , respectively, where a and b are the semi-major and semi-minor axis of the galaxies, as listed by Mateo (1998). It can be easily appreciated that (1) more concentrated (denser) systems have distributions peaked at shorter lenghts and (2) independently of the assumed density profile, the distributions of symmetric and smooth systems show a single major peak, marking the characteristic clustering scale, followed by a very sharp cut-off. In these systems there are no stars having shorter than the cut-off value.
In the middle panel of Fig. 17 the distribution of Draco is presented. The observed distribution is very well reproduced by its template: the characteristic clustering scale is px and no star with clustering scale shorter than the cut-off ( px) is observed. On the other hand, the distribution of UMi (shown in the lower panel of Fig. 17) is quite different from that of Draco and from the smooth/symmetric templates. The major peak and the cut-off are well reproduced by the corresponding template but there is a clear secondary peak at shorter scale lenghts with respect to the main cut-off. The presence of this secondary peak shows that there are two characteristic scales of clustering in UMi, a longer one ( px ) associated with the general properties of the system and a shorter one ( px ) associated with the more compact structures corresponding, to the off-centered density peak.

Can the observed distribution of UMi arise by chance (i.e. small number fluctuations) from an intrinsically smooth and unstructured system ? To answer this question we extracted 1000 random samples from the model assumed for the UMi template shown in the upper panel of Fig. 17 and for each of them we computed the fraction of stars having lower than the observed cut-off (, hereafter , for brevity), fixed at px. The distribution of the of the simulated samples is shown in Fig. 18. The observed fraction () is indicated by a dotted line. Fig. 18 shows that (a) in no case a sample having equal or greater than the observed value has been extracted from the unstructured model, (b) the highest value reached by a simulation () is significantly lower than the observed one, and (c) 95 % of the simulated samples have . We conclude that the observed presence of two characteristic clustering scales is a real and statistically significant property of UMi.

Finally, we find that the spread in magnitude of the blue HBs of Draco and UMi are small and compatible with the observational scatter at that magnitude. Thus we can’t see any sign of the significant elongation along the line of sight that was required in the model by Klessen & Kroupa (1998) to explane the large velocity dispersion observed in dSph galaxies without the need of massive dark matter halos (see also Aparicio, Carrera & Martinez-Delgado, 2001).
7 Discussion
The distance estimates to Draco and UMi derived in §4 are tied to the distance scale introduced by F99 and compatible with the TRGB scale introduced by Bellazzini, Ferraro & Pancino (2001a). The F99 scale is fully consistent with the scale based on the revised Hipparcos parallaxes by Carretta et al. (2000). F99 showed that their distance moduli of globular clusters are tipically mag larger than those tied to traditional calibrating relation. This is probably the main reason why we find distance moduli for UMi and Draco that are larger by mag than what generally found in literature (see, e.g. Mateo, 1998, and references therein). We note also that, independently of the distance scale, our procedure of HB matching leads to results that are in excellent agreement with works based on the RR Lyrae (e.g., N88 Nemec, 1985) while a sensible mismatch is noticed with respect to the Main Sequence fitting technique adopted by Mighell & Burke (1999), using HST data. We argue that the problems with the absolute photometric calibration of HST-WFPC2 data may be at the origin of the observed differences.
The comparison with the recent distance estimates by Aparicio, Carrera & Martinez-Delgado (2001) (for Draco) and Carrera et al. (2002) (for UMi) is of particular interest. Aparicio, Carrera & Martinez-Delgado (2001) derived a distance modulus to Draco by (1) estimating from the observed HB and (2) by adopting the classical relation by Lee et al. (1999). They obtain , compatible with our estimate within the uncertainties, but their final distance modulus () is 0.34 mag smaller than ours. However, if the above quoted systematic difference of mag between the F99 distance scale and the scale by Lee et al. (1999) is taken into account the consistency between the two estimates is clearly recovered. On the other hand, Carrera et al. (2002) derived the mean level of RR Lyrae in UMi by a comparison with template globular cluster of similar metallicity, i.e. the same method adopted here. Moreover, the distance moduli of the template clusters were taken from Reid (1999) who derived them from Main Sequence fitting to Hipparcos subdwarfs. With this approach Carrera et al. (2002) obtained and in excellent agreement with our results.
Independently of the above considerations, it is important to remark that the actual uncertainty on state-of-the-art distance estimates to Draco and UMi remains %, in spite of all efforts. It is clear that classical distance indicators are unefficient in this context and valid alternatives are certainly needed. The search for detached double-lined eclipsing binaries (DD-EB) is now possible with new generation instruments and may be very rewarding, given the high binary fraction that has been reported for these two galaxies (Olszewski, Pryor & Armandroff, 1996).
7.1 Evolutionary history
The metallicity distributions presented here confirm (with larger samples, with respect to existing spectroscopic surveys) that the stellar populations of both galaxies have a sizeable spread in metal content. Since they are dominated by very old stars, we shall conclude that significant self-enrichment took place in these systems in a quite short time scale (i.e., few Gyr) at very early epochs. The same conclusions have been previously reached for Sculptor (Majewski et al., 1999) and Sextans (Bellazzini, Ferraro & Pancino, 2001b). Shetrone, Coté & Sargent (2001) have shown that some of the stars of UMi, Dra and Sex show abundance patterns significantly different from those typical of Galactic halo stars. In particular it has been suggested (Ikuta & Arimoto, 2002) that the transition from an -enhanced regime to nearly solar ratios occurred at a much lower [Fe/H] value than in our own Galaxy. This evidence led Shetrone, Coté & Sargent (2001) to conclude that it is unlikely that systems like UMi and Draco gave a significant contribution to the assembly of the Galactic halo. We remark here that this conclusion is correct only for satellites that would have been accreted by the Milky Way in an advanced stage of their chemical evolution. A very early accretion (i.e., within Gyr from the onset of star formation) or simply a very early stripping of the gaseous component by the Galaxy wouldn’t leave any peculiar chemical signature in a Galactic halo largely composed by building blocks like Draco, UMi or Sextans (as they were in their first Gyr of “stellar” life).
Our results show also that, while the average metallicity of the two galaxy is similar, the difference in the MDs is significant. The MD of UMi peaks at and barely reaches while that of Draco peaks at and reaches . This fact has to be taken into account, in particular in the interpretation of the great difference in HB morphology between the two galaxies. Dra and UMi are not a good “second parameter pair” (see Bellazzini et al., 2001, and references therein): a sizeable part of the HB morphology difference may be due to the differences in the actual MD. The large population of binaries (and Blue Stragglers) hosted by the galaxies (Olszewski, Pryor & Armandroff, 1996) may also be have some impact on the observed HB morphology, especially in the case of Draco (see Fusi Pecci et al., 1992; Bellazzini et al., 2001, 2002a; Carney et al., 2001, and references therein).
7.2 A striking structural difference: not so twins after all?
Draco and UMi have similar distance from the center of the Galaxy, similar luminous mass and similar star formation histories. Both are thought to have high M/L ratios and probably have also similar orbits, since they have similar radial velocities and (possibly) proper motions (see Mateo, 1998; Scholz & Irwin, 1994; Schweitzer, Cudworth & Majewski, 1997). In spite of that, while Draco shows a very symmetrical and smooth profile out to a very large distance from the center (Odenkirchen et al., 2001; Piatek et al., 2002), we have demonstrated that even the innermost regions of UMi are strongly structured and asymmetrical. The presence of a massive and extended CDM halo should have inhibited the formation of any significant substructure in the stellar component of UMi. The star formation activity cannot be responsible of the disturbed structure of this galaxy since significant star formation episodes have ceased many Gyr ago. Furthermore we accurately checked for possible differences in the stellar populations between the off-centered (and nearly round) density peak of UMi and its outer regions and we found none.
Ferraro, Bellazzini & Pancino (2002) showed that a small self-gravitating stellar system is embedded into the main body of the peculiar globular cluster Cen. This stellar system has likely managed to preserve its individuality over many Gyr, while orbiting into the stellar halo of the cluster. A similar possibility could be envisaged also to explain the origin of the peculiar density peak of UMi. The process of hyerarchical merging is expected to be scale-free, thus the records of the formation of a galaxy like UMi from smaller fragments may be still detectable today (see Fellhauer & Kroupa, 2000), possibly favoured by the fact that the putative fragment we are considering is much denser than the stellar medium it is embedded in. The main argument against this hypothesis is the already reported observational evidence that the stellar population in the density peak does not differ from the average UMi population (as opposite to the Cen case, see Ferraro, Bellazzini & Pancino, 2002, and references therein). Large high-resolution spectroscopic surveys may possibly provide more stringent indications on the viability of this scenario.
While we are writing, a new preprint was posted (Palma et al., 2002) in which our results about the structure of UMi are fully confirmed222However the clustering properties of UMi stars are not considered in that work.. Furthermore Palma et al. (2002) were able to follow the structure of UMi out to a distance of deg from the center and demonstrated that (1) the galaxy is elongated along the direction of its proper motion vector and (2) the outer isodensity contours of UMi have the typical S-shape of tidally disturbed stellar systems. If it will be spectroscopically confirmed that the stars in the S-shaped structures are unbound, or the signature of apparent rotation will be found, this would directly disprove a specific prediction of the CDM simulations (Hayashi et al., 2002). In any case, the strongly disturbed structure of UMi provides a severe challenge to standard CDM scenarios, above all if the comparison with Draco is considered333In fact, the presently available observations of Draco are very well fitted by the predictions of CDM models (Hayashi et al., 2002). Moreover, Palma et al. (2002) showed that previous estimates of the total luminosity of UMi had missed a significant amount of light that is found at large distances from the center of the galaxy. Their estimate of total luminosity is 2.7 times larger than previous ones. Taking this into account and considering the (possible) effects of anisotropic velocity dispersions they were able to reduce the mass to light ratio of UMi down to . If we include in this computation the effects of our larger distance modulus (and assuming , after Mateo, 1998) we obtain , just a factor 4 larger than the typical M/L of ordinary globular clusters.
From the above discussion it appear that further observational and theoretical efforts are still needed to fully understand the nature of UMi and Draco. It is quite possible that we have some fundamental lesson to learn from these faint and unassuming stellar systems.
References
- Aparicio, Carrera & Martinez-Delgado (2001) Aparicio, A., Carrera, R., & Martinez-Delgado, D., 2001, AJ, 122, 2524
- Armandroff, Olszewski & Pryor (1995) Armandroff, T.E., Olszewski, E.W., & Pryor, C., 1995, AJ, 110, 2131
- Azzopardi, Lequeux & Westerlund (1986) Azzopardi, M., Lequeux, J., & Westerlund, B.E., 1986, A&A, 161, 232
- Baade & Swope (1961) Baade, W., & Swope, H.H., 1961, AJ, 66, 300
- Battinelli & Demers (1999) Battinelli, P., & Demers, S., 1999, AJ, 117, 1764
- Bellazzini, Fusi Pecci, & Ferraro (1996) Bellazzini, M., Fusi Pecci, F., & Ferraro, F.R., 1996, MNRAS, 278, 947
- Bellazzini, Ferraro & Pancino (2001a) Bellazzini, M., Ferraro, F.R., & Pancino, E., ApJ, 556, 635
- Bellazzini, Ferraro & Pancino (2001b) Bellazzini, M., Ferraro, F.R., & Pancino, E., MNRAS, 327, L15
- Bellazzini et al. (2001) Bellazzini, M., Fusi Pecci, F., Ferraro, F.R., Galleti, S., Catelan, M., & Landsman, W.B., 2001, AJ, 122, 2569
- Bellazzini et al. (2002a) Bellazzini, M.,Fusi Pecci, F., Messineo, M., Monaco, L., Rood, R.T., 2002a, AJ, 123, 1509
- Bellazzini et al. (2002b) Bellazzini, M.,Fusi Pecci, F., Montegriffo, P., Messineo, M., Monaco, L., Rood, R.T., 2002b, AJ, 123, 2541
- Carney & Seitzer (1986) Carney, B.W, & Seitzer, P., 1996, AJ, 92, 23
- Carney et al. (2001) Carney, B.W, Latham, D.W., Laird, J.B., Grant, C.E., & Morse, J.A., 2001, AJ, 122, 3419
- Carrera et al. (2002) Carrera, R., Aparicio, A., Martinez-Delgado, D., Alonso-Garcia, J., 2002, AJ, 123, 3199
- Carretta & Gratton (1997) Carretta, E., & Gratton, R. 1997, A&AS, 121, 95 (CG)
- Carretta et al. (2000) Carretta, E., Gratton, R.G., Clementini, G., & Fusi Pecci, F., 2000, ApJ, 533, 215
- Catelan et al. (2001) Catelan, M., Bellazzini, M., Landsman, W.B., Ferraro, F.R., Fusi Pecci, F., & Galleti, S., 2001, AJ, 122, 3171
- Demers & Battinelli (2001) Demers, S., & Battinelli, P., 2001, A&A, 377, 425
- Dolphin (2002) Dolphin, A., 2002, MNRAS, 332, 91
- Eskridge & Schweitzer (2001) Eskridge, P.B., & Schweitzer, A.E., 2001, AJ, 122, 3106
- Fellhauer & Kroupa (2000) Fellhauer, M., & Kroupa, P., 2000, in Massive Stellar Clusters, A. Lancon and C. Boily Eds., San Francisco: ASP, ASP Conf. Ser., 211, 241
- Feltzing, Gilmore & Wyse (1999) Feltzing, S., Gilmore, G., & Wyse, R.F.G., 1999, ApJ, 516, L17
- Ferraro et al. (1999) Ferraro, F.R., Messineo, M., Fusi Pecci, F., De Palo, A., Straniero, O., Chieffi, A., & Limongi, M., 1999, AJ, 118, 1738 (F99)
- Ferraro, Bellazzini & Pancino (2002) Ferraro, F.R., Bellazzini, M., & Pancino, E., 2002, ApJ Letters, in press, (astro-ph/0206145)
- Fusi Pecci et al. (1990) Fusi Pecci, F., Ferraro, F.R., Crocker, D.A., Rood, R.T., & Buonanno, R., 1990. A&A, 238, 95
- Fusi Pecci et al. (1992) Fusi Pecci, F., Ferraro, F.R., Corsi, C.E., Cacciari, C., Buonanno, R., 1992, AJ, 104, 1831
- Grillmair et al. (1998) Grillmair, C.J., et al., 1998, AJ, 115, 144
- Harbeck et al. (2001) Harbeck, D., Grebel, E.K., Holtzman, J., Guhathakurta, P., Brandner, W., Geisler, D., Sarajedini, A., Dolphin, A., Hurley-Keller, D., & Mateo, M., 2001, AJ, 3092
- Harris & Harris (2000) Harris, G.L.H., & Harris, W.E., 2000, AJ, 120, 2423
- Hayashi et al. (2002) Hayashi, E., Navarro, J.F., Taylor, J.E., Stadel, J., & Quinn, T., 2002, ApJ, submitted (astro-ph/0203004)
- Holland, Fahlman & Richer (1996) Holland, S., Fahlman, G.G., & Richer, H.B., 1996, AJ, 112, 1035
- Hopp et al. (2000) Hopp, U., Schulte-Ladbeck, R. E., Crone, M., & Greggio, L., 2000, in The Galactic Halo : From Globular Cluster to Field Stars, A. Noels et al. Eds., Liege: Institut d’Astrophysique et de Geophysique, p. 399
- Ibata et al. (1997) Ibata, R.A., Wyse, R.F.G., Gilmore, G., Irwin, M.J., & Suntzeff, N.B., 1997, AJ, 113, 634
- Ikuta & Arimoto (2002) Ikuta, C., & Arimoto, N., 2002, A&A, in press, (astro-ph/0204399)
- Irwin & Hatzidimitriou (1995) Irwin, M., & Hatzidimitriou, D., 1995, MNRAS, 277, 1354
- Johnson & Bolte (1998) Jhonson, J., Bolte, M., 1998, AJ, 115, 693
- Kinemuchi et al. (2002) Kinemuchi, K., Smith, H.A., LaCluyzé, A.P., Clark, C.L., Harris, H.C., Silbermann, & N., Snyder, L.A., in Radial and Nonradial Pulsations as Probes of Stellar Physics, IAU Coll. 185, C. Aerts, T.R. Bedding, and J. Christensen-Dalsgaard Eds., S. Francisco: ASP, ASP Conf. Ser., 259, 130
- King, Da Costa & Demarque (1985) King, C.R., Da Costa, G.S., & Demarque, P., 1985, 229, 674
- Klessen & Kroupa (1998) Klessen, R.S., & Kroupa, P., 1998, ApJ, 143, 155
- Kleyna et al. (1998) Kleyna, J.T., Geller, M.J., Kenyon, M.J., Kurtz, M.J., & Thorstensen, J.R., 1998, AJ, 115, 2359
- Kleyna et al. (2001) Kleyna, J., Wilkinson, M.I., Evans, N.W., & Gilmore, G., 2001, ApJ, 563, L115
- Kopacki (2001) Kopacki, , 2001, A&A, 369, 862
- Laird et al. (1988) Laird, J.B., Rupen, M.P., Carney, B.W., Latham, D.W., 1988, AJ, 117, 1313
- Landolt (1992) Landolt, A.U., 1992, AJ, 104, 340
- Lee, Freedman & Madore (1993) Lee, M.G., Freedman, W.L., & Madore, B.F., 1993, ApJ, 417
- Lee et al. (1999) Lee, Y.-W., Yoon, S.-K., Lee, H.-C., & Woo, J.-H., 1999, in Spectrophotometric Dating of Stars and Galaxies, ASP Conf. Series, S. Francisco: ASP, 192, 185
- Lehnert et al. (1992) Lenhert, M.D., Bella, R.A., Hesser, J.E., & Oke, J.B., 1992, ApJ, 395, 466
- Madore & Freedman (1995) Madore, B.F., & Freedman, W.L., 1995, AJ, 109, 1645
- Madore & Freedman (1998) Madore, B.F., & Freedman, W.L., 1998, in Stellar Astrophysics for the Local Group, A. Aparicio, A. Herrero, & F. Sanchez eds., (Cambridge: Cambridge University Press), 305
- Majewski et al. (1999) Majewski, S.R., Siegel, M.H., Patterson, R.J., Rood, R.T., 1999, ApJ, 520, L33
- Martinez-Delgado et al. (2001) Martinez-Delgado, D., Alonso-Garcia, J., Aparicio, A., & Gomez-Flechoso, M.A., 2001, ApJ, 549, L66
- Mateo (1998) Mateo, M., 1998, ARA&A, 36, 435
- Mighell & Burke (1999) Mighell, K.J., & Burke, C.J., 1999, ApJ, 118, 366
- Montegriffo et al. (1998) Montegriffo, P., Bellazzini, M., Ferraro, F.R., Martins, D., Sarajedini, A., & Fusi Pecci, F., 1998, MNRAS, 294, 315
- Morrison et al. (2000) Morrison, H.L., Mateo, M., Olszewski, E.W., Harding, P., Dohm-Palmer, R.C., Freeman, K.C., Norris, J.E., & Morita, M., 2000, AJ, 119, 2254
- Nemec (1985) Nemec, J.M., 1985, AJ, 90, 204
- Nemec, Wehlau & Mendes de Oliveira (1988) Nemec, J.M., Wehlau, A., & Mendes de Oliveira, C., AJ, 96, 528 (N88)
- Newberg et al. (2002) Newberg, H.J., et al., 2002, ApJ, 569, 245
- Odenkirchen et al. (2001) Odenkirchen, M., et al., 2001, AJ, 122, 2538
- Olszewski & Aronson (1985) Olszewski, W.W., & , Aronson, M., 1985, AJ, 90, 2221
- Olszewski, Pryor & Armandroff (1996) Olszewski, E.W., Pryor, C., & Armandroff, T.E., 1996, AJ, 111, 750
- Palma et al. (2002) Palma, C., Majewski, S.R., Siegel, M.H., Patterson, R.J., & Ostheimer, J.C., 2002, AJ, submitted (astro-ph/0205194)
- Piatek et al. (2002) Piatek, S., Pryor, C., Armandroff, T.E., & Olszewski, E.W., 2002, AJ, 123, 2511
- Reid (1999) Reid, I.N., 1999, ARA&A, 37, 191
- Renzini & Fusi Pecci (1988) Renzini, A., & Fusi Pecci, F., 1988, ARA&A, 26, 199
- Sakai, Madore & Freedman (1996) Sakai, S., Madore, B.F., & Freedman, W.L., 1996, ApJ, 461, 713
- Sanders (2002) Sanders, R.H., 2002, ARA&A, in press (astro-ph/0205012)
- Saviane et al. (2000) Saviane, I., Rosenberg, A., Piotto, G., & Aparicio, A., 2000, A&A, 355, 966
- Saviane et al. (2001) Saviane, I., Held, E., Momany, Y., Rizzi, L., 2001, Mem. Soc. Astron. Ital., 72, 773
- Schechter, Mateo, & Saha (1993) Schechter, P., Mateo, M., & Saha, A. 1993, PASP, 105, 1342
- Scholz & Irwin (1994) Scholz, R.D., & Irwin, M.J., 1994, in Astronomy from wide-field Imaging, H.T. Mac Gillivray et al. Eds., Dordrecht: Kluwer, IAU Symp., 161, 535
- Schweitzer, Cudworth & Majewski (1997) Schweitzer, A.E., Cudworth, K.M., & Majewski, S.R., 1997, in Proper Motions and Galactic Astronomy, R.M. Humphreys Ed., S.Francisco: ASP, ASP Conf. Ser., 127, 103
- Shetrone, Coté & Stetson (2001) Shetrone, M.D., Coté, P., & Stetson, P.B., 2001, PASP, 113, 1122
- Shetrone, Coté & Sargent (2001) Shetrone, M.D., Coté, P., & Sargent, P.B., 2001, ApJ, 548, 592
- Schlegel, Finkbeiner & Davis (1998) Schlegel, D.J., Finkbeiner, D.P., & Davis, M., 1998, ApJ, 500, 525
- Stetson (2000) Stetson, P. , 2000, PASP, 112, 925
- Tosi et al. (2001) Tosi, M., Sabbi, E., Bellazzini, M., Aloisi, A., Greggio, L., Leitherer, C., Montegriffo, P., 2001, AJ, 122, 1271
- Walker (1994) Walker, A., 1994, AJ, 108, 555 (W94)
- Zinn & West (1984) Zinn, R., & West, M.J., 1984, ApJS, 55, 45 (ZW)
- Zoccali et al. (1999) Zoccali, M., Cassisi, S., Piotto, G., Bono, G., Salaris, M., 1999, ApJ, 518, L49
| ID | V | I | Var. type | Var. n. | ||||||
|---|---|---|---|---|---|---|---|---|---|---|
| 10018 | 16.858 | 0.005 | 15.342 | 0.005 | 246.08 | 365.12 | 15h 08m 27.2s | 67 10 07.7 | 0 | 0 |
| 10019 | 17.018 | 0.006 | 15.628 | 0.006 | 399.38 | 462.34 | 15h 08m 34.4s | 67 10 34.2 | 0 | 0 |
| 10020 | 16.542 | 0.004 | 15.717 | 0.005 | 754.09 | 801.17 | 15h 08m 51.2s | 67 12 07.0 | 0 | 0 |
| 10021 | 16.579 | 0.005 | 15.620 | 0.008 | 1959.44 | 817.81 | 15h 09m 48.4s | 67 12 09.3 | 0 | 0 |
| 10023 | 16.928 | 0.004 | 15.679 | 0.006 | 838.95 | 1488.32 | 15h 08m 55.4s | 67 15 15.9 | 0 | 0 |
| 10024 | 16.458 | 0.005 | 15.569 | 0.008 | 873.74 | 1918.16 | 15h 08m 57.2s | 67 17 14.2 | 0 | 0 |
| 10025 | 17.714 | 0.005 | 16.489 | 0.005 | 548.78 | 65.36 | 15h 08m 41.5s | 67 08 44.9 | 0 | 0 |
| 10026 | 17.459 | 0.006 | 16.467 | 0.009 | 102.13 | 160.05 | 15h 08m 20.4s | 67 09 11.5 | 0 | 0 |
| 10028 | 18.090 | 0.006 | 15.754 | 0.007 | 1399.35 | 279.70 | 15h 09m 21.7s | 67 09 42.5 | 0 | 0 |
Note. — A sample of the photometric catalog. The complete catalog is available in ASCII format in the electronic edition of the paper. The variable stars are numbered after the nomenclature by N88 (column 11) and classified according the same authors (column 10: 1 = RRab; 2 = RRc; 3 = Anomalous Cepheids; 4 = unclassified variables).
| ID | V | I | Var. type | Var. n. | ||||||
|---|---|---|---|---|---|---|---|---|---|---|
| 10069 | 16.744 | 0.004 | 15.963 | 0.003 | 1295.30 | 338.62 | 17h 20m 34.3s | 57 51 56.4 | 0 | 0 |
| 10085 | 17.510 | 0.004 | 16.742 | 0.003 | 1375.32 | 999.17 | 17h 20m 37.2s | 57 54 58.2 | 0 | 0 |
| 10086 | 17.478 | 0.003 | 16.802 | 0.003 | 1145.29 | 1051.62 | 17h 20m 29.3s | 57 55 13.1 | 0 | 0 |
| 10090 | 16.989 | 0.004 | 15.710 | 0.002 | 505.79 | 1158.47 | 17h 20m 07.2s | 57 55 43.5 | 0 | 0 |
| 10091 | 17.313 | 0.003 | 15.744 | 0.003 | 1828.06 | 1218.93 | 17h 20m 52.9s | 57 55 57.8 | 0 | 0 |
| 10097 | 17.112 | 0.003 | 15.816 | 0.002 | 463.32 | 1303.23 | 17h 20m 05.7s | 57 56 23.4 | 0 | 0 |
| 10100 | 17.212 | 0.004 | 15.759 | 0.002 | 262.30 | 1511.18 | 17h 19m 58.8s | 57 57 20.9 | 0 | 0 |
| 10109 | 17.193 | 0.003 | 16.272 | 0.002 | 1456.76 | 1651.69 | 17h 20m 40.2s | 57 57 57.7 | 0 | 0 |
| 10110 | 16.948 | 0.003 | 15.746 | 0.002 | 270.94 | 1652.71 | 17h 19m 59.2s | 57 57 59.8 | 0 | 0 |
Note. — A sample of the photometric catalog. The complete catalog is available in ASCII format in the electronic edition of the paper. The variable stars are numbered after the nomenclature by Baade & Swope (1961) (column 11). In column 10 only the known Anomalous Cepheid V141 is flagged with Var. type = 3.
| UMi | Draco | ref. | |
|---|---|---|---|
| E(B-V) | 0.03 | 0.03 | M98 |
| 19.86 0.09 | 20.28 0.10 | ||
| 20.02 0.09 | 20.44 0.10 | ||
| 19.40 0.06 | |||
| 19.41 0.12 | 19.84 0.14 | ||
| P02, O01 | |||
| P02, O01 | |||
| 0.80 | 0.29 | IH95 | |
| M98, P02, this work | |||
| [mag/] | M98 | ||
| (ZW) | |||
| (ZW) | |||
| (CG) | |||
| (CG) | |||
| 0.10 | 0.13 | ||
| 0.12 | 0.15 |
Note. — A summary of relevant observational parameters for UMi and Dra. If no explicit reference is indicated, the estimated obtained in the present analysis is reported. The reported has been obtained adopting our distance moduli. Legenda of the previously undefined acronyms: P02 = Palma et al. (2002); O01 = Odenkirchen et al. (2001); IH95 = Irwin & Hatzidimitriou (1995). The reported values of have been obtained from the apparent total magnitudes listed by M98 (corrected according to the results by P02, in the case of UMi) and the distance moduli obtained in the present analysis.