Abstract
We present unique radio observations of SS433, using MERLIN, the VLBA, and the VLA, which allow us to, for the first time, properly image and derive a meaningful spectral index for the ‘ruff’ of equatorial emission which surrounds SS433’s jet. We interpret this smooth ruff as a wind-like outflow from the binary.
1 SS433’s ruff of equatorial emission
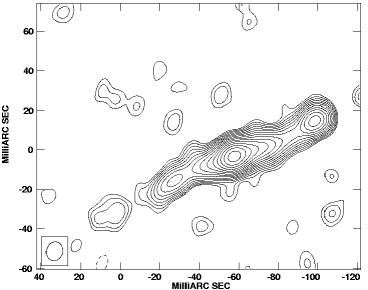
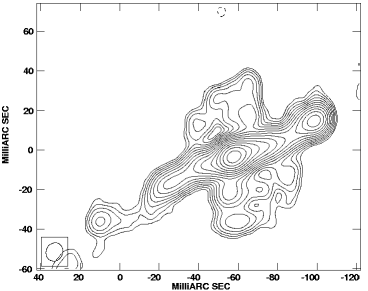
The central quarter-arcsecond of SS433’s appearance at 5 GHz is rich in structure: both compact and smooth features may be found. To image this at radio wavelengths requires an interferometer with sufficiently long baselines to give adequate resolution. Those long baselines will act as a spatial frequency filter which only detects compact emission; they are insensitive to larger-scale structures. At a frequency such as 5 GHz, short baselines are also needed to faithfully detect smoother extended emission. We illustrate this in Figure 1: the left figure shows the central region of SS433 imaged using only the VLBA; the right figure shows the same region, with the same contour levels, on the same epoch, at the same frequency, at the same resolution, using the same VLBA data, but adding in also the shorter baselines of MERLIN. In the left figure the only believable brightness structure is that associated with SS433’s familiar jet, although hints of surrounding emission are also seen. On the right figure, a wide smooth structure surrounding the jet appears, which we [Blundell et al(2001)] have termed SS433’s ruff. Since the spatial filtering depends on the baseline length as measured in wavelengths, it is most severe at the highest frequencies, and even the VLBA alone can detect the ruff at 1.4 GHz [Blundell et al(2001)].
The spectral index of any extended emission may only be measured if that emission has been properly sampled at both frequencies. With VLBA data alone one can simply not detect the ruff at 5 GHz, while at 1.4 GHz it is obvious; the undersampling at high frequencies would lead to the derivation of a spuriously steep spectral index. Time variability is a further complication, making it essential to observe the two frequencies simultaneously. The observations we presented in [Blundell et al(2001)] at 1.4 GHz and at 5 GHz were taken on the same day (1998 Mar 7), and included the VLBA, MERLIN, and the VLA. This is thus a unique dataset: there are sufficient short baselines at high frequency to adequately sample the emission, and both frequencies were observed quasi-simultaneously. We find a flat spectral index for the anomalous emission (see below). Paragi et al. [Paragi et al(2002a)] claim a steep spectral index; but their high-frequency data are undersampled (as they pointed out in [Paragi et al(1999)]), and their observations at the different frequencies are not simultaneous. Those data do not therefore usefully constrain the spectral index.
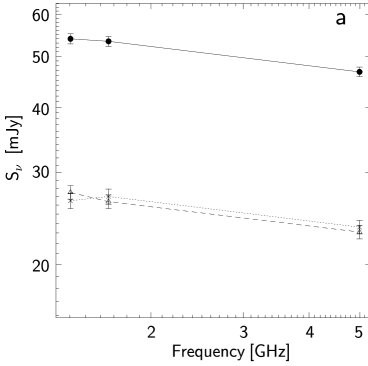
Our measurements of the distribution of the spectral index across SS433’s ruff are shown in Figure 2. The spectral indices of the ruff were measured after convolving our images to a common beam of mas2 HPBW. The resulting total flux densities, measured in identical boxes in these images, which were chosen to avoid the jet but include the full ‘ruff’ emission, are shown in Figure 2. The spectral index for the combined (northern+southern) emission is (, where is the flux density at frequency ). Most resolved synchrotron sources are characterized by ; indeed, is normally considered the signature of thermal bremsstrahlung emission as is often observed in outflows from symbiotic binaries [Seaquist, Taylor, & Button(1984), Mikołajewska & Ivison(2001)]. The complication here is that the peak surface brightness corresponds to a brightness temperature of at 1.4 GHz, implying a similar lower limit to the physical temperature of a thermally-emitting plasma.
| Measurements from | Measurements from | |
| VLBA only | VLBA & MERLIN | |
| Northern ruff | 3.5 mJy | 22.8 mJy |
| Southern ruff | 3.1 mJy | 27.4 mJy |
| without short baselines | with short baselines |
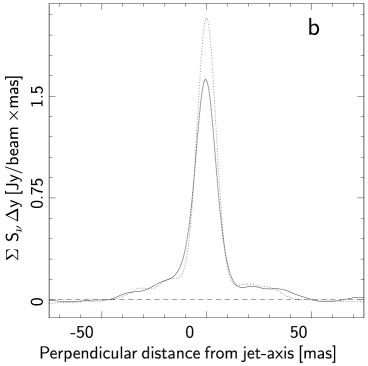
The distribution of the flux density perpendicular to the jet is shown in Figure 2, which suggests that the spectral index is indeed almost flat throughout the ruff, and shows that the emission extends to at our sensitivity, or . Note also that the ruff is roughly symmetric about the jet.
2 The origin of the smooth emission
The most straightforward interpretation of the radio emission is that it arises from mass outflow from the binary system that is enhanced towards the orbital plane. Such mass loss could either (i) come from the companion (most likely an O or B star), (ii) be a disc wind from the outer parts of the accretion disc or (iii) arise from mass loss from a proto-common envelope surrounding the binary components. The detection of this mass loss will have important implications for our understanding of the evolutionary state of this unique system. It has been a long-standing puzzle how SS433 can survive so long in a phase of extreme mass transfer () without entering into a common envelope phase where the compact object spirals completely into the massive companion (for a recent discussion see [King, Taam & Begelman(2000)]). Since the theoretically predicted mass-transfer rate exceeds even the estimated mass-loss rate in the jets (; [Begelman et al(1980)]), [King, Taam & Begelman(2000)] proposed that most of this transferred mass is lost from the system in a radiation-pressure driven wind from the outer parts of the accretion disc [King & Begelman(1999)]. A related problem exists in some intermediate-mass X-ray binaries (IMXBs). Models of the IMXB Cyg X-2 [King & Ritter(1999), Podsiadlowski & Rappaport(2000), Kolb et al.(2000), Tauris, van den Heuvel, & Savonije(2000)] show that the system must have passed through a phase where the mass-transfer rate was , exceeding the Eddington luminosity of the accreting star by many orders of magnitude, without entering into a common-envelope phase, and where almost all the transferred mass must have been lost from the system. The observed emission in SS433 presented here may provide direct evidence of how such mass loss takes place.
The existence of a disc-like outflow was first postulated by [Zwitter, Calvani, & D’Odorico(1991)] to explain the variation with precession phase of the secondary minimum in the photometric light curve. [Fabrika(1993)] proposed a disc-like expanding envelope caused by mass-loss from the outer Lagrangian point L2 to explain the blue-shifted absorption lines of H I, He I and Fe II (see also [Mammano, Ciatti & Vittone(1980)], whose spectrum shows that all the emission lines seen in SS433 have P-Cygni profiles indicating the presence of outflowing gas). [Filippenko et al.(1988)] observe remarkable double peaked Paschen lines, with speeds close to 300 .
A rough estimate for the mass-outflow rate, described in our paper [Blundell et al(2001)] is:
where mJy, kpc, km s-1, GHz, ( is the Gaunt factor for free-free emission, ).
One of the major uncertainties in this estimate is the velocity of the outflow, though a velocity of km s-1 is similar to that of the lines seen by [Filippenko et al.(1988)] and is close to the characteristic orbital velocity of SS433, as one might expect for an outflow from the binary system rather than either binary component. Furthermore, if this outflow started soon after the supernova explosion which formed the compact object yr ago and whose impressively circular remnant is seen clearly in the images of [Dubner et al.(1998)], a velocity of km s-1 implies an extent of the outflow of arcmin (for kpc). Indeed, this is exactly the size of the extended smooth emission seen by [Dubner et al.(1998)] and suggests that this may be the outer extent of the same outflow. The inferred mass-loss rate, yr-1, is much higher than any reasonable mass-loss rate from an O-star primary and suggests that it is connected with the unusual short-lived phase SS433 is experiencing. It could be mass loss from a common envelope that has already started to form around the binary, or a hot coronal wind from the outer parts of the accretion disc driven, e.g., by the X-ray irradiation from the central compact source.
Acknowledgments
K.M.B. thanks the Royal Society for a University Research Fellowship. We warmly thank the conference organisers for a very stimulating meeting.
References
- Begelman et al(1980). Begelman, M.C., Hatchett, S.P., McKee, C.F., Sarazin, C.L., Arons, J., 1980, ApJ, 238, 722
- Blundell et al(2001). Blundell, K.M., Mioduszewski, A.J., Muxlow, T.W.B., Podsiadlowski, Ph., Rupen, M.P., 2001, ApJ, 562, L79
- Dubner et al.(1998). Dubner, G.M., Holdaway, M., Goss, W.M., & Mirabel, I.F., 1998, AJ, 116, 1842
- Fabrika(1993). Fabrika, S.N., 1993, MNRAS, 261, 241
- Filippenko et al.(1988). Filippenko, A.V., Romani, R.W., Sargent, W.L.W., & Blandford, R.D., 1988, AJ, 96, 242
- King & Begelman(1999). King, A.R. & Begelman, M.C. 1999, ApJ, 519, L169
- King & Ritter(1999). King, A.R. & Ritter, H. 1999, MNRAS, 309, 253
- King, Taam & Begelman(2000). King, A. R., Taam, R. E., & Begelman, M. C. 2000, ApJ, 530, l25
- Kolb et al.(2000). Kolb, U., Davies, M, King, A., & Ritter, H. 2000, MNRAS, 317, 438
- Mammano, Ciatti & Vittone(1980). Mammano, A., Ciatti, F., & Vittone, A. 1980, A&A, 85, 14
- Mikołajewska & Ivison(2001). Mikołajewska, J. & Ivison R.J., 2001, MNRAS, 324, 1023
- Paragi et al(1999). Paragi Z., Vermeulen R.C., Fejes I., Schilizzi R.T., Spencer R.E., & Stirling A.M., 1999, A&A, 348, 910
- Paragi et al(2002a). Paragi Z., Fejes I., Vermeulen R.C., Schilizzi R.T., Spencer R.E., & Stirling A.M., 2002a, in Proc. 6th European VLBI Network Symposium, eds Ros E., Porcas R.W., Lobanov A.P. and Zensus J.A, astro-ph/0207061
- Paragi et al(2002b). Paragi Z., Fejes I., Vermeulen R.C., Schilizzi R.T., Spencer R.E., & Stirling A.M., 2002n, these proceedings; astro-ph/0208125
- Podsiadlowski & Rappaport(2000). Podsiadlowski, Ph. & Rappaport, S. 2000, ApJ, 529, 946
- Seaquist, Taylor, & Button(1984). Seaquist, E.R., Taylor, A.R., & Button, S. 1984, ApJ, 284, 202
- Tauris, van den Heuvel, & Savonije(2000). Tauris, T.M., van den Heuvel, E.P.J., & Savonije, G.J. 2000, ApJ, 530, L93
- Zwitter, Calvani, & D’Odorico(1991). Zwitter, T., Calvani, M., & D’Odorico, S. 1991, A&A, 251 92