Correlations between X-ray and radio spectral properties of accreting black holes
Abstract
We study correlations betwen X-ray spectral index, strength of Compton reflection, and X-ray and radio fluxes in accreting black holes (Seyferts and black-hole binaries). We critically evaluate the evidence for the correlation of the X-ray spectral index with the strength of Compton reflection and consider in detail statistical and systematic effects that can affect it. We study patterns of spectral variability (in particular, pivoting of a power law spectrum) corresponding to the X-ray index-flux correlation. We also consider implications of the form of observed X-ray spectra and their variability for interpretation of the correlation between the radio and X-ray fluxes. Finally, we discuss accretion geometries that can account for the correlations and their overall theoretical interpretations.
keywords:
accretion, accretion discs – binaries: general – galaxies: Seyfert – radiation mechanisms: thermal – X-rays: galaxies – X-rays: stars.1 INTRODUCTION
X-ray and soft -ray (hereafter X) spectra from luminous accreting black holes (hereafter BH), i.e., AGNs and BH binaries, commonly show a distinct component due to Compton reflection (Lightman & White 1988; Magdziarz & Zdziarski 1995) of the primary continuum from a cold medium (e.g., Pounds et al. 1990; Nandra & Pounds 1994; Magdziarz et al. 1998; Weaver, Krolik & Pier 1998; Zdziarski, Lubiński & Smith 1999, hereafter ZLS99; Done, Madejski & Życki 2000; Eracleous, Sambruna & Mushotzky 2000; Done et al. 1992; Gierliński et al. 1997; Zdziarski et al. 1998; Życki, Done, & Smith 1998; 1999; Gilfanov, Churazov & Revnivtsev 1999, 2000, hereafter GCR00; Revnivtsev, Gilfanov & Churazov 1999, 2001). A very interesting property of Compton reflection with a number of potential physical implications is that its relative strength, , where is the solid angle of the cold reflector as seen from the hot plasma, correlates with some other spectral and timing properties of many sources (e.g., ZLS99; GCR00).
Another correlation often found in both Seyferts and BH binaries is between X-ray spectral index and X-ray flux (e.g., Chiang et al. 2000; Done et al. 2000; Nowak, Wilms & Dove 2002; Zdziarski et al. 2002b, hereafter Z02; Lamer et al. 2003; Gliozzi, Sambruna & Eracleous 2003). The X-ray flux is also correlated with the level of radio emission in the hard states of BH binaries (Corbel et al. 2000; Gallo, Fender & Pooley 2003). All these correlations appear to reflect fundamental properties of BH accretion flows. We critically study the correlations, relationships between them, their theoretical models, and the corresponding physical implications. In Appendix A, we present properties of spectral variability due to a power-law pivoting, which process is closely related to the flux-index correlation as well as it puts constraints on the interpretation of the radio–X-ray correlation. In spectral fits, we use xspec (Arnaud 1996).
2 Correlation of Compton reflection with spectral index
2.1 Results of fits to data
The first to find a correlation of Compton reflection with another spectral property were Ueda, Ebisawa & Done (1994), who found that correlates with the X-ray photon spectral index, , in the BH candidate GX 339–4, albeit their result was based on only five observations (by Ginga). Later, 23 Ginga observations of BH and neutron-star binaries were found to obey the same correlation (Zdziarski 1999).
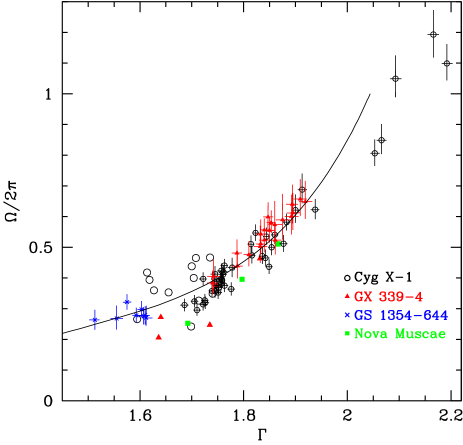
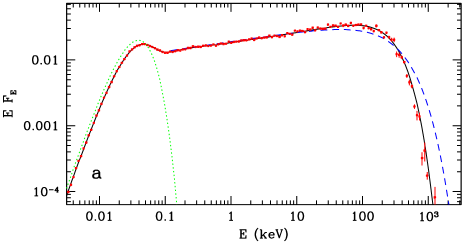
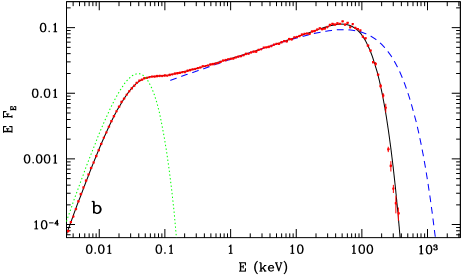
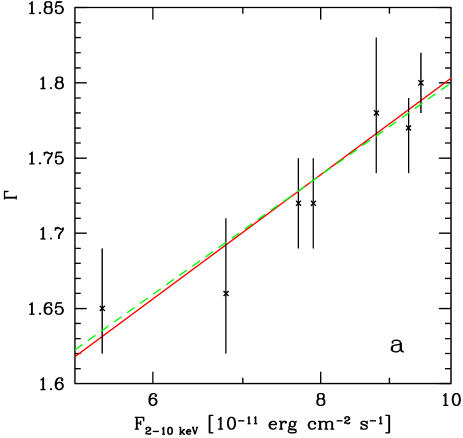
The reality of the correlation has been unambiguously confirmed in the RXTE data for the luminous BH binaries Cyg X-1, GX 339–4 and GS 1354–644 (Gilfanov et al. 1999; GCR00; Revnivtsev et al. 2001). Fig. 1 presents those RXTE results, as well as the Ginga results for 20 observations of Cyg X-1, GX 339–4 and Nova Muscae. These results were mostly obtained with spectra constrained to energies below a few tens of keV. However, in many instances, we also have at our disposal broad-band spectra extending to several hundred of keV, where almost the entire range of the reflection spectrum is found to fit the data very well, together with thermal Comptonization (e.g., the hard states of Cyg X-1, Gierliński et al. 1997, and GX 339–4, Zdziarski et al. 1998), as illustrated in Fig. 2.
The - correlation is also seen in Fourier-resolved spectra, i.e., corresponding to variability in a given range of Fourier frequencies (Revnivtsev et al. 1999, 2001; Gilfanov et al. 1999). Very importantly, the strength of reflection was also found to correlate with the low-frequency QPO centroid frequency and with the degree of the relativistic smearing of the Fe K line (associated with reflection, Życki & Czerny 1994), see fig. 4 in Gilfanov et al. (1999) figs. 1.4 and 1.6 in GCR00, fig. 2 in Revnivtsev et al. (2001), and Gilfanov et al., in preparation.
We note that the above results concern BH binaries in their luminous (and mostly hard) states. Existing data are insufficient to constrain reflection in quiescent states of BH binaries. However, given the prevalent theoretical interpretation of the correlation as due to feedback between a cold accretion disc and hot plasma (Section 5.1), we do not expect it to be present in quiescence as the disc is then cut off at a large radius (e.g., Narayan & Yi 1995) and Comptonization of synchrotron photons usually dominates X-rays (e.g., Wardziński & Zdziarski 2000). Analogously, we do not expect an - correlation in low-luminosity AGNs.
The picture of the correlation disappearing with the decreasing luminosity is indeed confirmed in the BH transient GS 2023+338. The results of Życki et al. (1999) show an - correlation in the initial luminous hard state, but then the spectrum substantially softened at an approximately constant when the luminosity decreased by a factor . This effect is most likely due to the onset of the dominance of Comptonization of synchrotron photons with decreasing luminosity (Wardziński & Zdziarski 2000). Similarly, reflection is weak in the transient XTE J1118+480 (Frontera et al. 2001b; Miller et al. 2002), which maximum luminosity was only about of the Eddington one111An additional complicating factor in measuring reflection in this halo system is its likely overall low metallicity, which possibility was considered by Frontera et al. (2001b), but not by Miller et al. (2002), who only considered the case of a low Fe abundance at all other abundances kept solar. Thus, the actual value of in this object may still be found by the former authors..
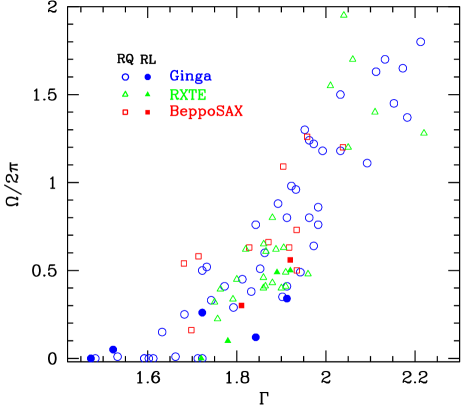
The first to report an - correlation in an AGN were Magdziarz et al. (1998), in the Seyfert-1 galaxy NGC 5548. Then, ZLS99 showed the presence of a strong - correlation in 47 Ginga observations of 23 AGNs (mostly Seyfert 1s and a few intermediate-type AGNs). Matt (2001) presented a compilation of BeppoSAX results for Seyfert 1s, and found that is correlated with in the full sample at the confidence level of , and if one object in which the measurement of the continuum was probably affected by a soft excess is not taken into account. A similar sample was later studied by Perola et al. (2002, hereafter P02b). Zdziarski & Grandi (2001, hereafter ZG01) showed that Compton reflection in broad-line radio galaxies (also called radio-loud Seyfert 1s), albeit weaker on average than in radio-quiet AGNs, is still consistent with the same correlation. Nandra et al. (2000, hereafter N00) found an - correlation in multiple RXTE observations of the Seyfert galaxy NGC 7469. Papadakis et al. (2002, hereafter P02a) have found this correlation in the average properties of four Seyferts. Fig. 3 summarizes those (and some other) results.
It is, however, of importance to consider possible effects that may lead to spurious - correlations. We consider below in detail statistical and systematic effects.
2.2 Statistical effects
The main statistical effect is due to the fitted strength of reflection and spectral index for a single observation being correlated to certain degree, resulting in a skewness of their joint error contour. Any data have limited statistics, and then the same intrinsic –20 keV spectrum can be fitted within some confidence limit with either a somewhat harder index and less reflection or a softer index and more reflection. This effect is more important for AGNs than for BH binaries, as the former have usually significantly lower statistics.
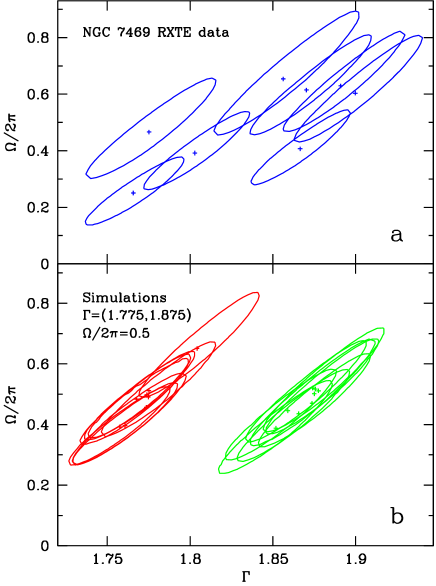
As usual with this type of effects, its importance decreases with increasing statistics. As shown in Fig. 4a, the extent of typical error contours for Seyferts is much less than the global extent of the correlation, and the inclination of an individual contour is also significantly steeper from that of the correlation. Thus, it is already very unlikely that statistical effects alone can account for this distribution.
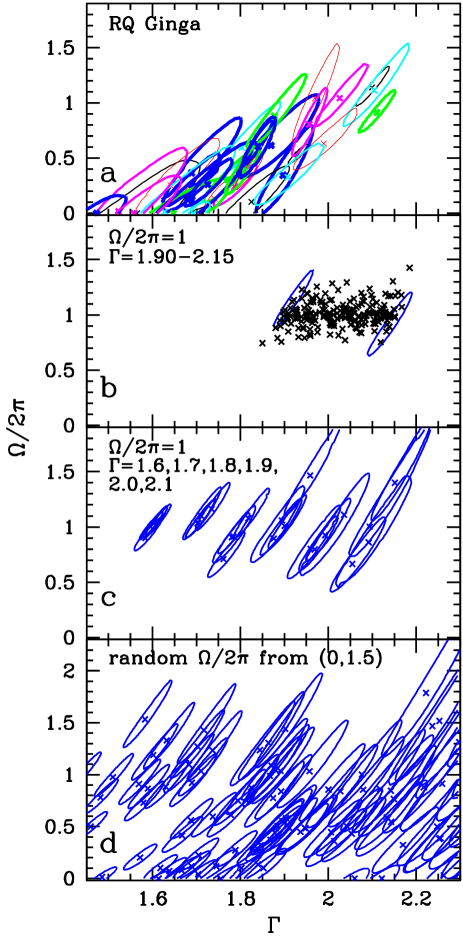
Then, Vaughan & Edelson (2001, hereafter VE01) considered 120 simulated RXTE spectra based on observations of MCG –6-30-15 with short exposure times of –3.7 ks and the top layer of the RXTE PCUs 0–2. They used a power-law model with in a relatively narrow range, –2.15 for 90 per cent of the simulated spectra, and constant reflection at . They fitted the simulated spectra with and as free parameters. The fitted values of formed a skewed elongated contour extending from to .
Given the assumed narrow range of , the contour obtained by them is equivalent (except for some spread in the values of and the exposure time) to the statistical error contour for two parameters. Indeed, the typical error bars provided by VE01 are comparable to the extent of their contour. However, based on the extent of this contour, VE01 stated that the above statistical effect casted serious doubts on the claim of the correlation by ZLS99.
However, most of the error contours of ZLS99 (Fig. 4a) and of those corresponding to RXTE and BeppoSAX results of Fig. 3 are much smaller than the contour obtained by VE01 due to much better statistisc. In particular, the typical statistics in the Ginga spectra is an order of magnitude better than those of the 1-orbit simulated spectra of VE01. Also, the shape of the error contour of VE01 is significantly different from those observed (Fig. 3). Already based on the above, the suggestion of VE01 is unlikely to be correct.
In order to quantitatively study this issue, we have generated 208 simulated RXTE spectra (assuming a 0.5 per cent systematic error, which we estimated from our fits to Crab data) with the range of of 1.90–2.15 (similar to that of VE01) and the constant . In the simulations, we have assumed a source with the constant 2–10 keV flux of 3.5 (flux unit is erg cm-2 s-1 hereafter in this paragraph) and the exposure of 50 ks for PCUs 0–2 and 30 ks for PCUs 3–4, similar to that of observations of NGC 7469, see Section 2.5 below. The product of the flux and exposure roughly corresponds to typical RXTE measurements shown in Fig. 3. For example, NGC 5548 has the flux in the range of –10, exposures of –40 ks (Chiang et al. 2000; see also Section 2.5 below), IC 4329A has the flux of , exposure of ks (Done et al. 2000), and 3C 120 has the flux of , exposure of ks (Eracleous et al. 2000). The results are shown in Fig. 4b. We clearly see that the obtained distribution is very different from those in Fig. 3 and 4a. It is also different from the contour of VE01 due to the better statistics.
In Fig. 4b, we also show two representative error contours. We see that although they correspond to only , they do provide a good measure of the spread of almost all the simulated points. This overestimate of statistical errrors by xspec is due to the corresponding overestimate of background errors (added in quadrature to the total ones) discussed by N00 and VE01. In order to account for this effect, N00 did not include background errors in their data at all, and VE01 performed simulations to estimate the actual errors. In the case of the Ginga data of ZLS99, the standard xspec procedure was followed. Thus, the error contours on Fig. 4a are somewhat overestimated. However, this is a conservative approach, which can only reduce the measured strength of an actual correlation but will not lead to an appearance of a spurious one. Therefore, we find the suggestion of Edelson & Vaughan (2000) (based on the results of VE01) that the correlation of ZLS99 could be spurious due to inadequate modeling of errors to be incorrect.
Results of simulations with a larger range of the input (and other assumptions similar to those above except for the systematic error being now 0.01) are shown in Fig. 4c. These results also show how the fitted values of and correlate with the ones assumed. We see no systematic effects here apart from the dispersion of the fitted value of increasing with the increasing (due to decreasing photon statistics at high energies).
To further study possible contributions from statistical effects, we have also performed analogous simulations (using the exposure time, 5.4 ks, and response as for a Ginga observation of NGC 3516222The Ginga spectra available to us are already background-subtracted, and their errors have been calculated including the uncertainty of the background. On the other hand, simulations give errors neglecting the effect of the background. For this particular source, this results in a decrease of the errors roughly corresponding to an increase of the exposure by a factor of . Thus, this set of simulations corresponds to the actual exposure of ks, which is still a half of the actual average exposure in the data of ZLS99 of 20 ks. On the other hand, the effect of background errors in xspec is generally overestimated (N00, VE01), and thus the present simulations may better represent the actual uncertainties than those in Figs. 4b-c.) assuming to be random in the 0–1.5 range. Results for 100 simulated spectra are shown in Fig. 4d. We see that the obtained distribution is still very different from that of Fig. 4a.
Our results confirm the finding of ZLS99 that the probability that a spectrum with measured to be at the high end of the extent of the correlation shown in Fig. 4a would correspond in reality to a point at a low end of the correlation is extremely low. ZLS99 noted that contours are skewed and elongated (see Fig. 4a), and thus used a statistical method taking into account the correlated errors while looking for the actual functional dependences between parameters. Based on comparison of the resulting values of (Bevington & Robinson 1992), ZLS99 determined the probability of the correlation appearing by chance as . The exact value may be somewhat different because the model with an allowed dependence yields (which reflects the intrinsic spread of the data). Still, the probability of reducing from 312 (assuming constant ) to 115 (allowing for a phenomenological dependence as a power law) by chance is in any case .
2.3 Intrinsic spread and small data samples
We see in Figs. 1, 3 and 4a that apart from the correlation between and , there is also a clear intrinsic spread of the values of those parameters in the observed - space. This spread is caused by varying model assumptions used in the references on which Figs. 1, 3 are based, differences in calibration of different instruments, and, last but not least, fluctuations due to some physical effects (e.g., orientation) superimposed on the overall dependence. The last effect is rather common in astrophysics, in which it is very rare that any two quantities are correlated without any influence of other parameters of the system. In the case of BH binaries, we see a full width of or so for a given , whereas it is for Seyferts.
Thus, a finding of no - correlation in a small sample cannot be taken as a proof of the lack of it, even if the statistical quality of data is very good. Furthermore, a sample with poor statistics cannot be considered a basis of a proof for either presence or absence of the correlation. For example, the data points for GX 339–4 by Wilms et al. (1999) have so large error bars and so limited range of and that no statement about the correlation can be made at all. In the case of that source, the actual presence of a strong correlation (see Fig. 1) has later been established by Revnivtsev et al. (2001) and Nowak et al. (2002). Then, P02b claimed the - correlation to be relatively weak in their sample of Seyferts. However, the error bars in their data are large enough for their data to permit the actual presence of a strong correlation. The same holds for the similar data set of Matt (2001), who raised the issue of the influence of statistical effects on the correlation found by him in the BeppoSAX data but presented no calculations to test it.
2.4 Systematic effects
Various systematic effects might affect the best fit values of the and and can lead to biased estimates and to contradiction between results obtained by different instruments and using different spectral models. In certain circumstances these effects could potentially lead to appearance of spurious corelations between parameters. These effects are considered below.
N00 noted that a background subtraction with a systematic relative error with a specific power-law dependence on energy (reaching 0.03 at 20 keV) may produce a spurious - correlation in their RXTE data for NGC 7469. However, it is easy to see that this would be the case only if the dominant variability pattern corresponded to a pivot point at low energies, keV. Apart from the specific case of NGC 7469, we show in Section 3 that the typical pivot energy in Seyferts is keV, which, in turn, would produce an - anticorrelation. Thus, this explanation cannot be general. Also, in Section 2.5 below, we reanalyze the data of N00 with an updated PCA background model and recover the same correlation. Furthermore, we consider it extremely unlikely that background would be undersubtracted in the same way in AGNs observed by Ginga, BeppoSAX, and RXTE.
Then, Weaver et al. (1998), and later P02b and Malzac & Petrucci (2002, hereafter MP02), noted that a correction needs to be made to account for the high-energy cutoff in the spectra. Namely, the lower the cutoff the fewer incident photons are available for reflection, and then the fitted value of increases. A related important effect not noticed by P02b is the downward curvature of the incident model spectrum (present in the e-folded power law but not necessarily in Comptonization models) being compensated by an increase in the reflection strength. These two effects help to explain the offset between the Ginga and BeppoSAX results at low values of reflection noticed by Lubiński & Zdziarski (2001), and seen in Fig. 3. On the other hand, P02b notice that the resulting correction to cannot by itself remove the presence of the correlation.
We also point out here the existence of an important correction to the X-ray index not taken into account by P02b. It is the difference between the asymptotic low-energy index, , of an e-folded power law,
| (1) |
(where is the photon number), and the actual X-ray index between two energies, and . The latter equals , where
| (2) |
and the second equality corresponds to keV (limiting the range with possible dominance of a soft X-ray excess or effects of ionized absorption) and keV, used by ZLS99. At keV assumed by them, , which is negligibly small. Thus, the correlation presented in ZLS99 concerns the actual hard X-ray index.
On the other hand, this model fitted to BeppoSAX data on Seyferts by P02b (see also Matt 2001) yield generally lower values of . Then, the fitted values of increase somewhat with respect to those corresponding to fits with no cutoff. For example, for keV, the fitted value of increases by per cent (P02b). However, as pointed out above, the value of the index needs to be corrected as well, with . In fact, the two points P02b found to disagree with the correlation of ZLS99 both require substantial corrections in . In particular, keV fitted by P02b for Mrk 509 yields a rather large , increasing the 3–20 keV index from (P02b) to . Taking into account both corrections, to and , makes the BeppoSAX results (Matt 2001; P02b) quite compatible with those from Ginga of ZLS99 (see Fig. 3).
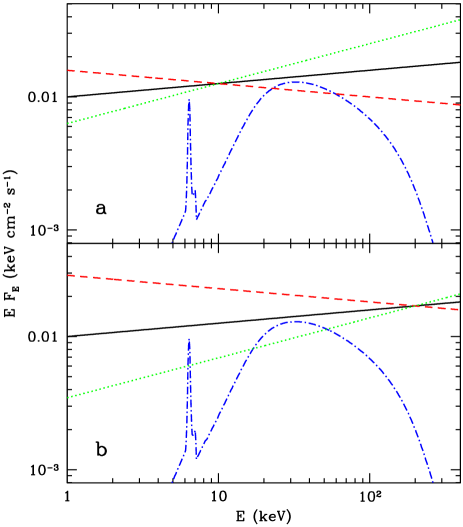
Furthermore, we point out that an e-folded power law is actually a very bad model for thermal Comptonization, which physical model fits well the spectra of Seyferts at high energies (e.g., Zdziarski, Poutanen & Johnson 2000). For spectral parameters characteristic to both Seyferts and BH binaries, thermal Comptonization has a much sharper cutoff (following an extended, power-law like, part of the spectrum) than that of the e-folded power law. This is illustrated in Figs. 5a, b for two cases approximately spanning the range of parameters of P02b. This further demonstrates that of the e-folded power law model has no direct physical meaning. The inadequacy of the e-folded power law model was also noted by MP02, who have found that the sharper cutoffs of the thermal Comptonization spectra lead to the increase of the value of being substantially less than that for the e-folded power law.
Concluding, results of fits with e-folded power laws need to be treated with caution. We also note that Zdziarski et al. (1995) and Gondek et al. (1996) obtained values of keV for the average Seyfert spectra using data from the CGRO/OSSE detector (which affords coverage to significantly higher energies than BeppoSAX), i.e., substantially higher than those from BeppoSAX.
In general, there are many other potential systematic effects that can affect the absolute determination of , e.g., due to an approximate treatment of ionization of the reflecting medium. Then, in order to test the reality of the correlation, we should ask whether a given set of fits properly ranks the spectra by the reflection strength. This issue was addressed by Gilfanov et al. (1999, see their fig. 7) and Revnivtsev et al. (2001, see their fig. 3) in the case of Cyg X-1 and GX 339–4, respectively. They have shown that the ratio of the count spectrum fitted with a higher value of to that fitted with a lower value itself has the shape characteristic to Compton reflection. This confirms that fits using relatively simple reflection models do provide a correct ranking in the values of .
We would also like to comment on the use of a normalization of the reflection spectrum of Nandra & Pounds (1994) and N00. They characterized the strength of reflection by the 1-keV flux, , of a power law with the same as the incident one but normalized to . Although equivalent to using the measured , this definition may lead to a spurious systematic correlation between and . To illustrate it, let us consider constant. A common variability pattern of the X-ray power law spectra of both AGNs and BH binaries is variable with an approximately constant pivot energy, ,
| (3) |
where is the normalization at , and usually keV (see Section 3 below). Then,
| (4) |
i.e., is strongly positively correlated with even if the actual reflection solid angle remains constant. Thus, we advise against using this measure of reflection. (We note, however, that the specific data for NGC 7469 of N00 show uncorrelated with the X-ray flux, in which case the above effect is not critical and probably does not affect substantially results of that paper.)
2.5 Single objects vs. samples
Another issue to bear in mind when considering evidence for and against the - correlation are the distinctions between different classes of sources and between samples of sources and repeated observations of a single source. The evidence for the presence of this correlation in Seyferts was given by ZLS99 mostly for broad-line Seyfert 1s as a class. Repeated observations of single Seyferts give mixed results, sometimes showing the correlation in a given source (e.g., Magdziarz et al. 1998 for NGC 5548; N00 for NGC 7469, also see below), and sometimes not, e.g., in IC 4329A (Done et al. 2000) and some other sources (P02b).
Fig. 6a shows - contours for RXTE observations the Seyfert 1 NGC 7469 (the inclination was assumed to be ). The data are the same as those of N00, but they have been reextracted by us using the LHEASOFT 5.2 version of the PCA response matrix and the background model. We used PCUs 0–4 whenever available and grouped the data in 4-day segments, and included a 0.5 per cent systematic error. This yields the exposure times of –70 and –50 ks for the PCUs 0–2 and 3–4, respectively. The contours clearly show a correlation (which would become even stronger after the reduction of the statistical errors discussed by N00 and VE01, see also Section 2.2). In order to test its reality, we have generated simulated spectra (using the same exposures and fluxes as for the actual data), a selection of them shown in Fig. 6b for two assumed values of . In all cases, we find the statistical dependence to be much steeper than the observed one. Thus, we confirm the corresponding conclusion of N00, who also ruled out the origin of the correlation in NGC 7469 from statistical effects (see their appendix).
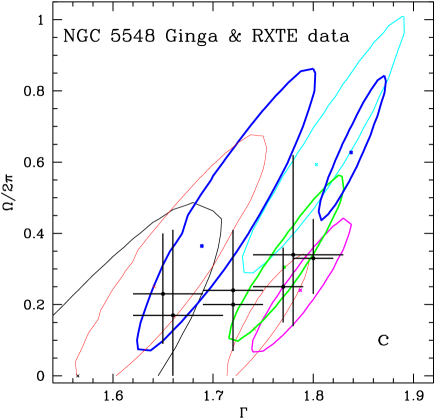
Fig. 6c shows the results for NGC 5548 from Ginga by ZLS99 (contours) and from RXTE by Chiang & Blaes (2003) (error bars). Note good agreement between both sets of measurements after the update of the RXTE instrumental response by Chiang & Blaes (2003) with respect to the original result of Chiang et al. (2000), who claimed a disagreement with ZLS99.
In the case of BH binaries, the correlation is seen both in a number of individual objects (Cyg X-1, GX 339–4, Nova Muscae in the hard state) as well as in those sources considered together (Fig. 1). On the other hand, it is certain that there are some BH binaries that do not obey the - correlation. In particular, a disapearance of the correlation with a decreasing Eddington ratio was pointed out in Section 2.1.
Although the data for Cyg X-1 in the soft state lie on the extrapolation of the dependence for the hard state for this and other sources (Fig. 1, see also fig. 5 of Gilfanov et al. 1999), the existing data appear insufficient to conclusively show the presence or absence of the - correlation within the soft state. On the other hand, Rau & Greiner (2003) claimed the presence of an - correlation in relatively soft states of GRS 1915+105. Then, Ballantyne, Iwasawa & Fabian (2001) did not find such a correlation in their sample of 5 narrow-line Seyfert 1s, which class of object is likely the extragalactic counterpart of the soft state of BH binaries (Pounds, Done & Osborne 1995). Similarly, Lamer et al. (2003) found no - correlation in the narrow-line Seyfert NGC 4051. The lack of the correlation in this object may be due to the domination of the emission process by non-thermal electrons (see Section 5.1), which possibility in soft-state sources was pointed out by ZLS99.
3 X-ray index-flux correlations
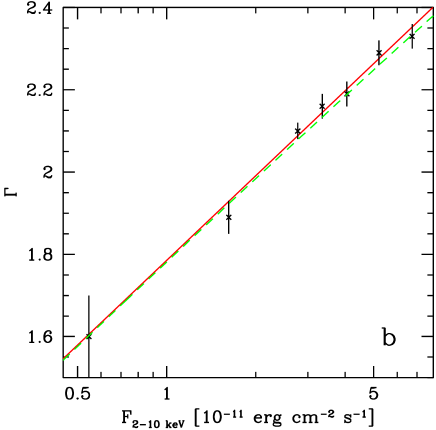
Another common correlation concerning spectra of accreting BHs is that between the X-ray spectral index, , and the X-ray flux, . A common situation in the hard state of BH binaries and Seyfert 1s is showing an increasing trend (although with often significant non-statistical scatter) with in an X-ray energy range, –. Examples of this behaviour is shown in Fig. 7 for the Seyferts NGC 5548 (Chiang & Blaes 2003) and NGC 4051 (Lamer et al. 2003). The - dependence can often be fitted by a power law (e.g., Chiang et al. 2000; Done et al. 2000), also for the data shown in Fig. 7. The linear dependences of in Fig. 7 yield , i.e., the departures from the linear correlation are compatible with being statistical only. On the other hand, the assumption of a constant results in and , respectively, and the F-test (Bevington & Robinson 1992) yields the probability that the fit improvement is by chance of and , respectively. Thus, the - correlations are highly significant statistically, which conclusion is also confirmed by application of the Spearman and Kendall rank correlation tests. Similar power-law correlations are found, e.g., in the hard state of Cyg X-1 on long time scales (Z02).
If the index increases from to while the energy flux increases from to , the two power laws intersect at the pivot energy,
| (5) |
with the following substitution if either equals 2,
| (6) |
If represents the ratio of the photon, rather than energy, fluxes, then above should be replaced everywhere by . The resulting variable power law is given by equation (3). A treatment of the effect of pivoting on average spectra and spectral variability is given in Appendix A.
In the cases of the data for NGC 5548 and NGC 4051, keV and 140 keV, respectively. As shown in Appendix A, the assumption of a constant results in an almost linear dependence between and the logarithm of the flux over some energy band. Indeed, the – energy flux, given by
| (7) |
and plotted in dashed lines in Fig. 7, almost coincide with the best-fit linear dependences.
| Object | – | 333Energy flux ratio except when noted. | Reference | |||
|---|---|---|---|---|---|---|
| [keV] | [keV] | |||||
| Cyg X-1 (hard state) | 3–12 | 1.4 | 2.0 | 3 | 40444Also observed in the broad-band, 1.5–300 keV, variability (Z02). | Z02 |
| Cyg X-3 (hard state) | 3–100 | NA | NA | NA | 555Implied by the 3–100 keV variability. | McCollough et al. (1999b) |
| 3C 120 | 0.3–2 | 1.70 | 2.03 | 2666Count rate ratio assumed here to represent photon flux ratio. | 5 | ZG01 |
| 3C 390.3 | 1–10 | 1.70 | 1.90 | 1.8777Calculated using the 1-keV normalization. | 90 | Woźniak et al. (1998) |
| 3C 390.3 | 2–10 | 1.61 | 1.79 | 2.1 | 300 | Gliozzi et al. (2003) |
| IC 4329A | 2–10 | 1.90 | 2.07 | 1.9 | 200 | Done et al. (2000) |
| IC 4329A | 2–10 | 1.75 | 1.95 | 2.2 | 240 | Madejski et al. (2001) |
| MCG –6-30-15 | 2–10 | 1.8 | 2.2 | 3.3d | 80 | VE01 |
| MCG –6-30-15 | 3–10 | 1.9 | 2.2 | 3.8888The (3–5)+(7–10) keV count rate ratio assumed here to approximate the 3–10 keV photon flux ratio. | 410 | P02a |
| Mrk 766 | 1–10 | 1.64 | 2.01 | 1.5e | 10 | Leighly et al. (1996) |
| NGC 3227 | 2–10 | 1.49 | 1.75 | 1.4 | 20 | Ptak et al. (1994) |
| NGC 3516 | 2–10 | 1.63 | 1.69 | 1.37 | 910 | Chiang (2002) |
| NGC 4051 | 3–10 | 1.3 | 2.6 | 26f | 60 | P02a |
| NGC 4051 | 2–10 | 1.60 | 2.33 | 12.3 | 140 | Lamer et al. (2003) |
| NGC 4151 | 2–10 | 1.4 | 1.7 | 6 | 2000 | Yaqoob et al. (1993) |
| NGC 5506 | 3–10 | 1.9 | 2.1 | 4f | 5000 | P02a |
| NGC 5548 | 2–10 | 1.65 | 1.80 | 1.73 | 180 | Chiang & Blaes (2003) |
| NGC 5548 | 3–10 | 1.8 | 2.0 | 3.2f | 1700 | P02a |
Table 1 gives a number of examples of the pivot energy in Seyferts, as well as in Cyg X-1 and Cyg X-3. Table 1 is based mostly on figures in published papers, and thus the numbers there are approximate only. Still, they unambiguously show that many Seyferts have the pivot energy at keV. A similar pattern is shown by MCG –5-23-16 (Zdziarski, Johnson & Magdziarz 1996). Although variable X-ray absorption may affect the correlation for NGC 4151 found by Yaqoob et al. (1993), the weak variability found above 50 keV (Zdziarski et al. 1996; Johnson et al. 1997) is consistent with the pivot at high energies.
Table 1 gives two examples of AGNs with the pivot at keV, 3C 120 and Mrk 766. In the cases of 3C 120 as well as Cyg X-1 in the hard state (where the seed photon energies are much higher than those in AGNs, which results in the pivot energy higher than that in 3C 120, see Z02), ZG01 and Z02 have shown that the spectral variability is consistent with the bolometric luminosity of the high-energy source being constant. This type of behaviour may also take place in the Seyfert 1H 0419–577, where keV (see fig. 3 in Page et al. 2002). However, Table 1 shows that this type of behaviour is certainly not the rule. The pivot at high energies implies the bolometric luminosity increasing with the softening of the source, as illustrated in Fig. 8. This is also confirmed by the 1–300 keV luminosity estimated by P02a for MCG –6-30-15, NGC 5506 and NGC 5548 to increase by a factor of for increasing within the ranges given in Table 1. A similar increase is shown for NGC 5548 in fig. 6a of Magdziarz et al. (1998). The results of Nowak et al. (2002, see their table 1 and fig. 3) imply the bolometric luminosity is increasing with the increasing 3–9 keV flux in the hard state of the BH binary GX 339–4. Some increase of the bolometric luminosity with increasing is also found in Cyg X-1 as the source gets close to a transition to the soft state (Z02).
In the case of MCG –6-30-15, Shih, Iwasawa & Fabian (2002) have found a - correlation in ASCA data to appear to saturate above certain count rate. They have interpreted this behaviour as due to a superposition of two power law components with constant indices, and the normalization of the softer power law was allowed to vary. This model also allows to explain an approximate constancy of the Fe K line flux with varying continuum flux in those data. Thus, this is an attractive model for MCG –6-30-15. On the other hand, data for many objects clearly show correlated hardness changes over rather broad bands (see the references above, e.g., P02a), which also rules out the above interpretation as general. Furthermore, the apparent saturation at a high seen by Shih et al. (2002) (and Merloni & Fabian 2001, hereafter MF01) might be an artifact of plotting against the linear flux999Often, the ratio of instrument counts in two bands (hardness ration) is plotted as a function of a count rate. The advantages of this choice are independence of possible revisions of the instrument response (giving the conversion between counts and photons), which revisions are relatively common in X-ray astronomy, and no need to assume a spectral model. Another choice is to plot the fitted spectral index against the fitted energy flux. Although both quantities depend on the response, the advantage of this choice is an ease of comparison with physical models. On the other hand, VE01, MF01 and Shih et al. (2002) show hybrid plots with the fitted against the instrumental count rate. The last two papers show a comparison of the results with a physical model by MF01 assuming the X-ray count rate to be proportional to the energy flux. This is obviously not strictly correct for a variable X-ray slope, possibly leading to inaccuracies in comparing data with theory. rather than . As discussed above (see also Appendix A), variability with a constant pivot energy results in a linear dependence between and , not itself. Indeed, the nonlinearity and saturation of in NGC 4051 claimed by Lamer et al. (2003) is specific to using a plot, and it disappears completely in a space (Fig. 7b).
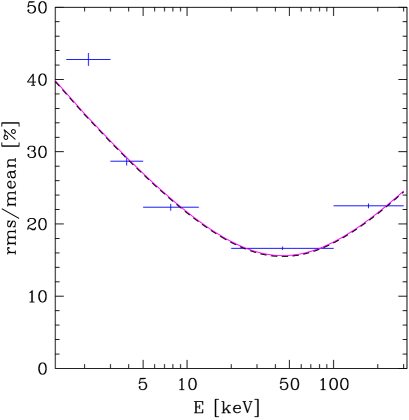
An important example of broad-band pivoting variability is given by of 1-day measurements of Cyg X-1 in the hard state over the 1.5–300 keV energy range (Z02). Pivoting is seen here directly in the ASM and BATSE data showing a linear correlation at low energies and an anticorrelation at high energies, not just being inferred from a - plot. The pivoting variability pattern can also be illustrated by energy-dependent fractional variability. The solid and dashed curves in Fig. 9 show the observed fractional rms variability as a function of energy is well modelled by the theoretical rms due to a variable with either constant and additional energy-independent variability or variable . We also see that an additional variable component is required at the lowest energies, which probably can be identified with the observed soft X-ray excess (Ebisawa et al. 1996; Frontera et al. 2001a; Di Salvo et al. 2001). Still, the 1.5–3 keV flux remains strongly anticorrelated with the 100–300 keV flux (Z02).
Results for Seyfert 1s similar to that shown in Fig. 9 for Cyg X-1 have been obtained by Markowitz & Edelson (2001). They show that the fractional variability in the 2–4 keV band in all of 9 Seyfert 1s studied by them is higher than that in the 7–10 keV band (for long-term measurements with 5-day intervals). Given the unknown shape of the dependence of rms on , it is not possible to uniquely translate their results into the pivot energies. Still, their results are compatible with keV.
The results above were obtained on time scales from days to years for both Seyferts and BH binaries in the hard state. Interestingly, the variability patterns in the two cases appear qualitatively similar. However, a month time scale in Seyferts corresponds to s in BH binaries in units of the light travel time accross the gravitational radius. Thus, the variability pattern presented here for AGNs physically corresponds to that on short-time scales in BH binaries. In agreement with this correspondence, Li, Feng & Chen (1999) find the 2–60 keV hardness anticorrelated with the flux (i.e., corresponding to a positive - correlation) in the hard state of Cyg X-1 at time scales of and 1–50 s. Thus, pivoting with a high pivot energy is likely to take place in the BH binaries on short time scales as well. On the other hand, the full picture of variability in the hard state is certainly more complicated that this. For example, Li et al. (1999) and Wen, Cui & Bradt (2001) find no or weak - correlation in Cyg X-1 on the 0.01–0.1 s and -day time scales, respectively, whereas it is very strong over hundreds of days (Z02).
Then, spectral state transitions change the character of the correlation qualitatively. In particular, the - correlation becomes strongly negative in the soft state of Cyg X-1 over time scales from 0.01 s to tens of days (Li et al. 1999; Wen et al. 2001; Z02).
4 Correlation between the X-ray and radio fluxes in BH binaries
A very interesting correlation between radio and X-ray fluxes in the hard state of accreting BH binaries has been discovered recently (Brocksopp et al. 1999; Corbel et al. 2000; Gallo et al. 2003; Markoff et al. 2003a). In particular, Gallo et al. (2003) show a strong correlation between the 15 GHz flux and the count rate from the ASM from daily measurements for 8 BH binaries in the hard state. There are two possible origins of this correlation. One is that the level of X-ray emission is related to the rate of ejection of radio-emitting clouds, forming a compact jet (e.g., Mirabel et al. 1998; Corbel et al. 2000). Another is that the X-ray emission of BH binaries is dominated by non-thermal emission of the jet (Markoff, Falcke & Fender 2001; Vadawale, Rao & Chakrabarti 2001; Markoff et al. 2003a, 2003b; Georganopoulos, Aharonian & Kirk 2002).
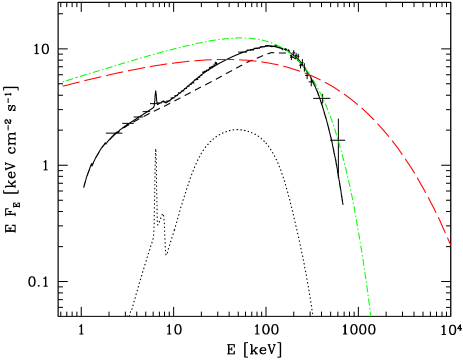
There are many strong arguments against the second interpretation (see also Poutanen & Zdziarski 2003). The broad-band X spectra of BH binaries in the hard state are very well modelled by thermal Comptonization and Compton reflection (e.g., Gierliński et al. 1997; Zdziarski et al. 1998; Frontera et al. 2001a, b; Wardziński et al. 2002; Z02), see Fig. 2. Apart from those broad-band studies, the evidence for the presence of Compton reflection from X-rays alone is extremely strong (e.g., Gilfanov et al. 1999; CGR00; Revnivtsev et al. 2001; Nowak et al. 2002). This implies that the X-ray emission is not strongly beamed away from the disc.
The thermal-Compton origin of the primary X-ray emission is strongly supported by a remarkable uniformity of both the energy (within a factor of ) and shape of the high-energy cutoffs of BH binaries in the hard state observed by OSSE (Grove et al. 1998). This cutoff is naturally accounted for by thermostatic properties of thermal Comptonization as well as pair production (e.g., Malzac, Beloborodov & Poutanen 2001), as it corresponds to the transition to relativistic temperatures. At higher temperatures, cooling becomes extremely efficient and copious pair production starts. This reduces the energy available per particle causing the temperature to decrease.
In the framework of the model with synchrotron emission of non-thermal electrons accelerated in the first-order Fermi process in a shock, the maximum energy of the synchrotron photons is given by balance of the acceleration and energy loss time scales. This gives the critical synchrotron energy corresponding to the maximum Lorentz factor of the accelerated particles, , as
| (8) |
where is the shock velocity, (satisfying ) gives the efficiency of the shock acceleration, is the fine-structure constant, is the pitch angle (with ) and is the electron rest energy. We see that for we can reproduce the high energy cutoff of BH binaries at keV, as pointed out by Markoff et al. (2001).
However, even with the fine-tuning of , the cutoff in the electron distribution is unlikely to be sharp. One effect is that of electron energy loss, which makes the steady-state distributions to cut off gradually (e.g., Kirk, Rieger & Mastichiadis 1998). Also, the conditions in the accelerating region (determining the efficiency parameter, ) are unlikely to be completely uniform. Under many astrophysical circumstancies, the shape of the tail of a distribution is given by an exponential cutoff (e.g., in a Maxwellian). If we assume the power law electrons, , are cut off as , the resulting synchrotron spectrum, , is given by,
| (9) |
where , is the exponential integral of the order , is the modified Bessel function of the second kind, the normalization constant is,
| (10) |
is the magnetic field strength, is the electron charge, is the Planck constant, and is the constant factor in the critical synchrotron energy, , corresponding to emission by electrons with the Lorentz factor ,
| (11) |
The spectrum of equation (9) exhibits a rather gradual cutoff, in fact much more gradual than that of a typical hard-state spectrum of Cyg X-1, as as illustrated in Fig. 2. Indeed, the synchrotron model of the hard state of Cyg X-1 shown in fig. 3a in Markoff et al. (2003b) overestimates the 1 MeV flux (McConnell et al. 2002) by a factor of 8 when matched to its 100 keV flux.
We have also studied various other forms of the electron high-energy cutoff. We have found that anything more gradual than a sharp cutoff at , when
| (12) |
gives photon spectra with cutoffs not strong enough to match the cutoff of Cyg X-1, as illustrated in Fig. 2.
A related issue is the spectral index of the spectrum. The model of Markoff et al. (2001) relies on particle acceleration in shocks. As they note, the accelerated electrons have then a power law index , where 1.5 corresponds to highly relativistic shocks. As the terminal bulk motion of jets in BH binaries is only mildly relativistic, with the typical bulk Lorentz factor of a few, it is unlikely that a shock close to the base of a jet is highly relativistic. Electron energy losses steepen the steady-state electron distribution by unity (e.g., Kirk et al. 1998), to an index , and the corresponding photon index is . Markoff et al. (2001) have been able to fit this model to the spectrum of XTE J1118+480, which has . However, many BH binaries have X-ray spectra harder than that (see Fig. 1). The resulting discrepancy is illustrated in Fig. 2, where we assumed the limiting in the synchrotron model spectra shown.
In order to deal with this rather serious problem, Markoff et al. (2003a) assumed that electron acceleration is continuous through the jet rather than confined to a shock. Then, the steady-state electron index equals that of the acceleration process (e.g., Kirk et al. 1998). Markoff et al. (2003a) do not specify details of this acceleration process. A natural candidate seems to be here the second-order Fermi acceleration in a turbulent medium (e.g., Jones 1994), in which case the electron index is constrained only by . This scenario is possible in principle, but then the acceleration depends on the unknown properties of the accelerating medium and equation (8), determining the high-energy cutoff, no longer applies.
The problems with the energy and shape of the high-energy cutoff are even more severe for the non-thermal Compton model (Georganopoulos et al. 2002). It requires that the product of the seed photon energy and the square of the maximum electron energy is fine-tuned, the high-energy cutoff in the electron distribution very sharp, and the seed photon distribution is very narrow. The last condition is not fulfilled in any of the models of Georganopoulos et al. (2002), which rely on scattering of either disk or stellar blackbody photons. Furthermore, the X-ray jet size in the model of Cyg X-1 of Georganopoulos et al. (2002) is cm, which is clearly inconsistent with the peak of the power spectrum per logarithm of frequency being at some occasions at Hz (e.g., Revnivtsev, Gilfanov & Churazov 2000).
As discussed in Section 2, the amplitude of Compton reflection and the Fe K flux (Section 6) imply that dense and rather cold material occupies a solid angle of as viewed from the X-ray source. Smearing of these components (e.g., Frontera et al. 2001a; Di Salvo et al. 2001; GCR00) and their correlation with (Sections 2, 6) clearly identify the reflector with the accretion disc (Section 5) and imply most of the X-ray source is within –100 gravitational radii from the BH. On the other hand, models of Markoff et al. (2001, 2003a, 2003b) and Georganopoulos et al. (2002) ignore that spectral components.
Yet another piece of evidence against a substantial part of X-rays being non-thermal is provided by spectral variability. In the case of Cyg X-1, the ASM/BATSE data show a pivot around –50 keV (Z02). This is consistent with both the X-ray hardness-flux data and the rms variability strongly increasing with decreasing X-ray energy, see Table 1 and Fig. 9, respectively. The characteristic from those data is –0.3. This power-law spectral variability when extended to the turnover energy (when the synchrotron source becomes optically thick) at eV (e.g., Markoff et al. 2001, 2003a) would imply variability below this energy by a factor of . However, the range of the variability of the 15 GHz flux correlated with the ASM flux in Cyg X-1 is only by a factor of several, basically the same as the range of the variability of the ASM flux itself (Gallo et al. 2003), contradicting the synchrotron origin of X-rays.
If both radio and X-rays were indeed due to non-thermal synchrotron emission (Markoff et al. 2001, 2003a, 2003b), their observed variability pattern should yield the X-ray rms virtually independent of energy. Then, in the model with non-thermal Comptonization of photons from the companion star (Georganopoulos et al. 2002), the seed photon flux is just constant, and the fractional variability should increase with photon energy globally. These model predictions are in strong disagreement with the data shown in Fig. 9, and, in particular, with the ASM 1.5–3 keV flux being stronly anticorrelated with the 100–300 keV flux from BATSE (Z02). A similar anticorrelation occurs in Cyg X-3 (McCollough et al. 1999b), and, in fact, the BATSE flux in that object is anticorrelated with radio flux (McCollough et al. 1999a).
On the other hand, if we extrapolate the rms dependence of Fig. 9 to low energies and make a plausible assumption of the fractional rms being , we obtain the characteristic energy of a fraction of keV. This is in very good agreement with the temperature of seed photons for thermal Comptonization observed in Cyg X-1 to be keV (Ebisawa et al. 1996; Di Salvo et al. 2001).
All these results strongly support the interpretation of the correlated radio emission as being due to ejection of clouds from the X-ray source, which could be similar to coronal mass ejections observed at the Sun. This interpretation is also supported by observed time lags of the radio emission with respect to the X-rays, e.g., in GRS 1915+105 (Mirabel et al. 1998). In fact, the base of the jet may be just the hot inner flow (e.g, Fender 2002). However, the electron distribution in that base is still thermal, as argued above.
Finally, we note a problem with internal consistency in the X-ray jet model of GRS 1915+105 of Vadawale et al. (2001). Namely, integrating the model non-thermal synchrotron emission shown in their fig. 4 yields the total jet luminosity of erg s-1 (at a distance of 12 kpc, jet velocity of , and adopted in that paper; note that this emission is beamed away from the observer). On the other hand, the total jet power given in that paper is erg s-1. This power includes the proton rest mass, and at the velocity of , the kinetic power is erg s-1. Thus, the jet radiative luminosity is times the kinetic power, which strongly violates energy conservation. Also, the radiative luminosity is usually much less than the kinetic power (unless the jet stops entirely, in which case only the two luminosities can be comparable), which furthermore increases the energy conservation problem.
5 Theoretical Interpretation
5.1 Feedback between cold and hot media
The - and - correlations occur likely due to interaction between cold and hot media. The former correlation (also manifesting itself as pivoting) is likely due to variability in the flux/luminosity of seed soft photons (emitted by some cold medium) irradiating a hot plasma being much stronger than the variability of the flux/luminosity from the hot plasma itself. The main radiative process in the hot plasma needs to be thermal Compton upscattering of the soft photons. Then, the larger the irradiating flux of seed photons, the softer and stronger the X-ray spectrum. This variability pattern in the case of a constant hot-plasma luminosity is shown, e.g., in fig. 3 of ZG01 and fig. 14 of Z02. The pivot point is then somewhere in the middle of the broad-band spectrum. If the hot-plasma luminosity increases as well but slower than the irradiating flux, the pivot is at high energies.
The emission of the cold medium irradiating the hot plasma may be partly (or wholly) due to reprocessing of the emission of the hot plasma. Then, the increased cooling of the hot plasma (which softens the X-ray spectrum) is associated with more Compton reflection (accompanying reprocessing by a Thomson-thick medium). This gives rise to an - correlation (ZLS99; CGR00).
The two patterns can occur together or independently. If the variability of soft seed photons is intrinsic (not from reprocessing), a - correlation will not be accompanied by an - one. This may happen in narrow-line Seyfert 1s. On the other hand, the variable seed photons may be due to reprocessing but from emission of a highly variable hot plasma. Then, there will be an - correlation but not a - one, which is the case for, e.g., Cyg X-1 on intermediate time scales (Gilfanov et al., in preparation).
A number of specific geometries have been proposed. In one, there is a variable radial overlap between the hot and cold accretion discs (ZLS99; Poutanen, Krolik & Ryde 1997). In another, the cold disc extends all the way to the minimum stable orbit and the hot plasma forms a corona with a mildly relativistic velocity directed either away from the disc or towards it (Beloborodov 1999a, 2001; Malzac et al. 2001). Also, static coronae have been considered in the context of spectral correlations (e.g., Haardt, Maraschi & Ghisellini 1997; MF01).
5.1.1 Variable overlap between hot and cold flows
ZLS99 have interpreted the - correlation as due to feedback in an inner hot (thermal) accretion flow surrounded by an overlapping cold disc. Then, the closer to the central BH the cold disc extends, the more cooling of the hot plasma by blackbody photons (both reprocessed and from intrinsic dissipation), and the softer the spectrum. The effect of the cooling by the UV photons of the X-ray emitting plasma is seen, e.g., in NGC 7469, where there is a positive correlation between the UV flux and (N00). Also, the - correlation (Section 3) indicates the dominant effect of plasma cooling by a variable seed-photon flux. At the same time, the cold disc subtends a larger solid angle from the point of view of the hot plasma, and thus there are more reflection photons in the spectrum. The solid curve in Fig. 1 shows the prediction of a simple version of this model (ZLS99).
This model also naturally accounts for the correlations of the reflection strength with both the QPO frequency and the degree of relativistic smearing seen in BH binaries (Gilfanov et al. 1999; GCR00; Revnivtsev et al. 2001). The correlation with the QPO frequency is expected because that frequency is very likely to be related in some way to the Keplerian frequency at the inner edge of the cold disc, which increases with the decreasing disc inner radius. At the same time, the closer the reflecting medium to the BH the higher the degree of the relativistic smearing.
The model naturally explains the pivoting behaviour of the X-ray spectra (manifesting itself in X-rays as a - correlation) as driven by the variable flux of irradiating seed photons (ZG01; Z02). Also, the specific - correlations observed in many accreting BHs indicate the bolometric luminosity increases in those sources with the increasing (Section 3). This scenario can account for this behaviour if the inner radius of the cold disk decreases with the increasing accretion rate. Such a behaviour is indeed postulated in models of advection-dominated accretion (e.g., Esin et al. 1997) as well as predicted by models of accretion disk evaporation (Meyer, Liu & Meyer-Hofmeister 2000; Różańska & Czerny 2000). On the other hand, it also appears likely that some instabilities can affect the disc truncation radius even if the bolometric luminosity remains approximately constant, which is observed in some objects (see Section 3).
Chiang & Blaes (2001, 2003) and Chiang (2002) have shown that detailed versions of this model can also explain the overall optical/UV/X-ray variability in a few Seyferts (NGC 3516, NGC 5548, NGC 7469). Note that their calculations require the variable overlap to be mostly achieved by the radius of the hot plasma being variable.
We note that this model does not readily explain sometimes observed (see Figs. 1, 3, 4a). Furthermore, scattering of the reflected photons in the hot flow will further reduce the observed (see a discussion in Beloborodov 2001). These problems can be possibly resolved by anisotropy of the emission of the hot plasma or the outer disc being concave. It is also possible that detections of such large reflection are due to imperfection of the spectral models used and/or data inaccuracies.
In the framework of this model, radio emission arises from outflows in the hot inner flow (e.g., Blandford & Begelman 1999). Such a scenario is described, e.g., in Fender (2002). Note that the jet emission in BH binaries is usually quenched in the soft state (Brocksopp et al. 1999; Corbel et al. 2000), in which the hot inner flow most likely disappears and is replaced by a hot corona (e.g., Gierliński et al. 1999).
5.1.2 Static coronae
Haardt et al. (1997) have studied spectral correlations in a static disc corona model. They found that if the corona is dominated by pairs, the 2–10 keV spectral index, is rather insensitive to changes of the flux in the same energy range, with typical for a change of the flux by 10. This is clearly much less than the observed spectral variability in many sources (Section 3), which rules out this model. The predictions for coronae not dominated by pairs depend, in turn, on the choice of the coronal optical depth, . At , would decrease with the flux, contrary to the data, but coronae with lower could be reconciled with data.
Then, MF01 found that static patchy coronae could reproduce the observed - correlations if the luminosity of an active region increases with its increasing size at a given height. The increased size increases the feedback of soft radiation from the disc, which makes, in turn, the spectrum softer. MF01 and Shih et al. (2002) have shown that this model fits well the - data for MCG –6-30-15 from RXTE and ASCA, respectively.
On the other hand, this model yields an - anticorrelation rather than correlation because an increased size at a given height (leading to the softening of the spectrum, see above) increases the degree of obscuration of the reflected radiation (Beloborodov 1999b, Malzac et al. 2001). This property is also shared by static disc coronae in general, and it follows from the dependencies shown by Haardt et al. (1997). Also, static coronae cannot by themselves explain the formation of radio jets.
5.1.3 Dynamic coronae
An interpretation of the - correlation alternative to the variable overlap of two accretion flows (Section 5.1.1) is that with mildly relativistic coronal inflows/outflows (Beloborodov 1999a; Malzac et al. 2001). The higher the speed of the coronal outflow, the less feedback with the underlying disc and the harder the spectrum. Inflows can, in turn, account for .
It is not clear how to account for the - correlation in this model. This correlation requires that the observed luminosity of the hot plasma either stays constant or increases with a decrease of the outflow velocity. On the other hand, an opposite behaviour of constant luminosity of the seed photons and variable luminosity of the hot plasma (which results in a - anticorrelation) is seen in the soft state of Cyg X-1 (Churazov, Gilfanov & Revnivtsev 2001; Z02), in which case coronal models are widely accepted (e.g., Poutanen et al. 1997; Gierliński et al. 1999; Churazov et al. 2001).
In the framework of this model, radio emission may arise from the jet being formed by the coronal outflow (Merloni & Fabian 2002). However, the quenching of the radio emission in the soft state (Brocksopp et al. 1999; Corbel et al. 2000) is not readily explained in this model.
5.1.4 Further physical implications
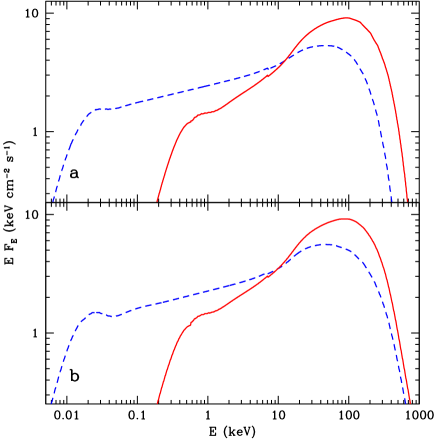
The feedback models explain the - correlation in terms of Comptonization of blackbody photons by a hot thermal plasma. The effective reflection solid angle in this model can be linked to the geometry of the source, which will also determine the amplification factor, , of the Comptonization process. On the other hand, the spectral index follows from the energy (and pair) balance. Since the characteristic blackbody seed photon energy is much lower in AGNs than in BH binaries, a generic prediction of these models is that for a given the value of will be higher in AGNs than that in BH binaries (Beloborodov 1999b; Malzac et al. 2001). This is illustrated in Fig. 10 (which calculations were performed using a code of Coppi 1999). When the plasma compactness (, where and are the luminosity and size, respectively), is low, pair production is negligible and the energy balance is satisfied by adjusting the electron temperature, , see Fig. 10a. On the other hand, at high compactness, the energy balance is achieved by adjusting the Thomson optical depth of the pairs, see Fig. 10b. (In the calculations shown in Fig. 10b, we assumed the presence of a weak high-energy power-law tail, containing 0.05 of the total energy beyond the Maxwellian electron distribution, as suggested by the results of McConnell et al. 2002.) The calculations shown in Fig. 10, with changing from 1.63 to 1.85 at the assumed , explain well the difference between the - correlations for the BH binaries (Fig. 1) and AGNs (Fig. 3).
An important issue here is also the possible presence of a correlation between and for a given . The feedback models require that the parameters of the hot thermal plasma adjust to variable cooling to satisfy the energy balance. If is constant, this can be done only by changing . Then, an increased cooling yielding an increase of is associated with a decrease of . On the other hand, it is possible that also changes, e.g., responding to changing accretion rate, which would produce a more complicated behaviour (e.g., Chiang & Blaes 2001, 2003). Also, if pairs are present, the main adjusting parameter is . In fact, in the example in Fig. 10b, the softening of the spectrum is associated with an increase (rather than decrease) of .
So far there are only limited observational data on correlation between and the high-energy cutoff. P02b found a positive correlation between and the e-folding energy in their sample of Seyfert 1s, which would be contrary to expectations of the simplest model with constant and the variability of due to changing . However, MP02 found that this correlation may be an artifact of the e-folded power-law model when used to fit thermal-Compton spectra. They simulated actual thermal Comptonization spectra at a constant keV and a range of , and then found that the simulated spectra when fitted by an e-folded power law yield a correlation resembling that of P02b.
5.2 Reflection from strongly ionized disc
Done & Nayakshin (2001) have shown that the optical depth of a highly ionized surface layer on top of a strongly irradiated accretion disc increases with the increasing hardness of the irradiating spectrum. This gives rise to an apparent - correlation as there is less unscattered reflection for harder spectra (although the actual reflection solid angle is constant). A separate mechanism is then needed to account for the - correlation, similarly to the case of the coronal outflow model.
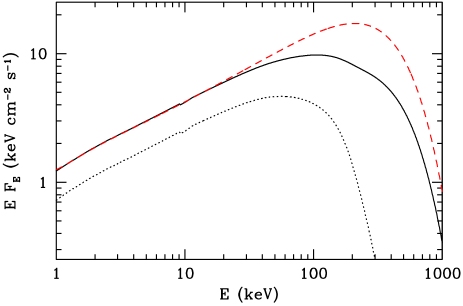
A diagnostic that could yield the actual solid angle of the reflector regardless of the ionization level is a measurement of reflection at high energies. Namely, the reflection spectrum is cut off at high energies with a functional form independent of the ionization state (White, Lightman & Zdziarski 1988). Fig. 11 illustrates this point for an incident spectrum from Comptonization (Poutanen & Svensson 1996) with keV and in spherical geometry, yielding the 2–10 keV index of . This corresponds to the case with the lowest fitted neutral reflection from a strongly ionized medium with the actual in Done & Nayakshin (2001). To illustrate this effect, we assumed that the reflecting medium is so strongly ionized that virtually no Fe K edge appears in the reflection component (dotted curve in Fig. 11). Although the reflected component is simply a power law at low energies, it still does have a high energy cutoff due to Klein-Nishina effects. The solid curve shows the total spectrum. Then, the dashed curve shows the incident spectrum without reflection normalized to coincide with the spectrum from the strongly ionized medium. We see that although the spectra at keV are indeed barely distinguishable, the form of their high-energy cutoffs is very different. Thus, this model can be tested using broad-band X spectra extending to several hundred of keV.
A set of –1000 keV spectra of Cyg X-1 in the hard state was analyzed by Gierliński et al. (1997), who found the form of the high-energy cutoff compatible with thermal Comptonization. Although those authors have not consider the ionized-reflection model, those spectra have not shown any hint of the softening of the cutoff of the type seen in the solid curve in Fig. 11; rather they indicated some additional hardening (interpreted by them as due to the presence of an additional spectral component from saturated Comptonization).
Independently of the present work, Barrio, Done & Nayakshin (2003) have recently fitted the ionized reflection model to broad-band spectral data from the PCA and HEXTE detectors of RXTE for Cyg X-1. They have found this model to be ruled out by the lack of a break in the HEXTE data, in favour of the model with a truncated disk and intrinsically weak reflection. Future tests of this model are highly desirable, e.g., using data from INTEGRAL and ASTRO-E2.
The effect shown in Fig. 11 also demonstrates that the albedo, , of a fully ionized medium energy-integrated over a spectrum characteristic to accreting BHs is still substantially less than unity (see also White et al. 1988). Indeed, in the specific case in Fig. 11, , only moderately larger than the corresponding albedo for a neutral reflector, . This shows that a fully ionized surface layer of an accretion disc would radiate substantial soft thermal flux even in the absence of an internal dissipation. This may rule out the ionized-disc model of the hard state of Cyg X-1 of Young et al. (2001). In general, the resulting constraints on the geometry will be relatively similar to those in the case of a nearly-neutral disc (e.g., Stern et al. 1995), and, in particular, will still rule out the presence of a homogeneous corona above the disc.
5.3 Time lags and reflection
N00 have pointed out that the presence of a constant reflection component from a distant medium (presumably a molecular torus) in AGNs together with a variable power law (from hot plasmas in the vicinity of the BH) can lead to an apparent correlation between and if reflection in the fitted model is tied to the variable power law. In particular, when the power law varies with a characteristic pivot energy of keV, the fitted - dependence will be positive (i.e., the softer the spectrum, the larger the relative contribution of reflection), as illustrated in Fig. 8a.
This idea has been developed in detail by MP02. They have considered cases with the pivot energy of 2, 5 and 10 keV, and have shown that the - dependence in Seyferts (Fig. 3) can be qualitatively explained by this type of model. However, we have shown in Section 3 that the pivot energy in many Seyferts is keV. Then, if this effect were important for a large fraction of Seyferts, an - anticorrelation (see Fig. 8b) would be observed for a large fraction of sources, in conflict with the data. This rules out the origin of the global - dependence in Seyferts from this effect. On the other hand, this effect may be important in some Seyferts, and may explain - anticorrelation in repeated observations of certain objects (Done et al. 2000; P02a).
As noted by MP02, this effect cannot play any role in BH binaries. Thus, this model requires completely different origin for the - correlations in those objects and in AGNs.
6 The Fe K emission
The results presented in Section 2 were mostly obtained by fits to the Compton-reflection continuum. However, the process of bound-free absorption in the reflecting medium is usually followed by emission of a fluorescent Fe K line, which equivalent width, , can be tied to that of the reflection (George & Fabian 1991; Życki & Czerny 1994). Conversely, if relativistic broadening is seen in the line emitted by the reflecting medium, the same broadening should be seen in the reflection spectrum. Thus, the measured parameters of the Fe K line should be in agreement with those of reflection. Such an agreement appears to be seen in BH binaries (Gilfanov et al. 1999; GCR00; Revnivtsev et al. 2001). Some disagreement in GX 339–4 claimed by Nowak et al. (2002) appears to be largely caused by a diffuse line component from the interstellar medium dominating in X-ray weak states of this source (Wardziński et al. 2002).
On the other hand, the situation is more complex in Seyferts. Unlike BH binaries, Seyferts possess significant Fe K line component from distant matter, e.g., the broad-line regions or molecular torii. Often, that distant matter is Thomson thin, and then it gives rise to the line but not to an Fe K edge, see, e.g., section 7.1 and fig. 13 in Woźniak et al. (1998). As shown in that figure, the optically-thin reflection component is then relatively negligible. Then, the presence of two line components, one constant (with or without associated reflection) and one variable in addition to a variable intrinsic component may cause a rather complex behaviour of variability. For example, the presence of constant line and reflection and a power law pivoting at keV leads to an anticorrelation of and measured with respect to the power law (see Fig. 8a, also MP02). Such an effect might have been seen by Chiang et al. (2000) in NGC 5548.
Given this complexity, it is important to self-consistently account for various components of the line and reflection, their relativistic broadening, and their connection to the incident spectral component. A self-consistent treatment should in general include at least two line components, narrow and broad, with the broadening (e.g., Gaussian or disc-like) and redshift of the latter applied in the same way to the reflection (e.g, Życki et al. 1998, 1999; GCR00, Lubiński & Zdziarski 2001; Zdziarski et al. 2002a). The strength of reflection should then be tied to that of the line (George & Fabian 1991; Życki & Czerny 1994). The dramatic effect of inconsistent treatment of the line and reflection is shown for the case of the disc broadening (Fabian et al. 1989) in fig. 3 of Zdziarski et al. (2002a).
Then, Shih et al. (2002) showed that Fe K line flux in MCG –6-30-15 remained approximately constant with varying 3–10 keV ASCA count rate. However, the formation of the line is due to photons only above 7.1 keV or more. In the case of MCG –6-30-15, , and then the fraction of the measured ASCA counts above 7 keV in their data is only . The fraction of counts above 8 keV, appropriate for a moderately ionized disc, possibly present in MCG –6-30-15 (e.g., Ballantyne & Fabian 2001), is as low as . Thus, the lack of a correlation between the 3–10 keV counts and the line photon flux cannot be taken as conclusive evidence against the Fe K photons being due to irradiation by photons from the observed continuum. Similarly, the fraction of counts above 7 and 8 keV in the MCG –6-30-15 data of VE01 is only and , respectively. The data of VE01 imply a pivot energy at about 80 keV (Table 1); thus, the variability of the flux above –8 keV will be in general less than that in the 2–10 keV band used by them (as also found by Markowitz & Edelson 2001 for Seyfert 1s in general).
As noted in Section 3 (as well as by MP02), there are many AGNs with the pivot at keV (e.g., 3C 120). Then, the 7–10 keV photon flux may be anticorrelated with the 2–10 keV one. Even if the pivot energy is in general at keV, occasionally the same object may show a pivot at keV, as in the case of NGC 5548 (Nicastro et al. 2000). Thus, it is important to use the band above the Fe K edge in studies of the continuum-line correlations.
Self-consistent treatments of the line and reflection was applied, e.g., to the Seyfert galaxy IC 4329A by Done et al. (2000), who found no disagreement between the line and reflection. A similar method was applied to NGC 4151 by Zdziarski et al. (2002a), who also found the broad-line component compatible with reflection, in spite of previous claims to the contrary (e.g., Wang, Zhou & Wang 1999). Then, Lubiński & Zdziarski (2001) have applied the same method to average ASCA spectra of Seyfert 1s and found the dependence of the of the broad component of Fe K lines to obey the dependence on compatible with that of the reflection continuum. Although Yaqoob et al. (2002) have pointed out that the statistical weights used by Lubiński & Zdziarski (2001) were not justified statistically, the effect of their correction appears to be only minor (Lubiński, in preparation). Indeed, the results of P02b for Seyfert 1s observed by BeppoSAX show an increase of with very similar to that obtained by Lubiński & Zdziarski (2001).
7 Conclusions
We have considered correlations between various spectral properties of accreting BHs in Seyfert galaxies and X-ray binaries, with particular emphasis on the correlations between the X-ray spectral index, strength of Compton reflection and the X-ray flux. The main results can be summarized as follows.
Using published data of the observations of Seyferts with Ginga, RXTE and BeppoSAX, we have critically re-evaluated the evidence for presence of correlation between the X-ray spectral index and strength of Compton reflection. We conclude that when considering a large number of observations of a large sample of objects, the existence of global correlation between these two parameters is established beyond any reasonable doubts.
Smallness of the error bars in comparison with the extent of the correlation and good agreement of the results obtained by various satellites confirm that the correlation cannot be an artifact caused by statistical or systematic effects. The ratios of the spectra with different values of reflection in BH binaries demonstrate that the correlation cannot be a consequence of a trivially inadequate spectral model. We note, however, that the particular values of the spectral index and, especially, of the strength of the Compton reflection, do depend on the details of the spectral approximation. This fact should taken into consideration when comparing results obtained by different authors.
The - correlation shows significant spread, larger than the statistical uncertainties of the data. It is not clear at present to which degree this spread is intrinsic to the sources and to which degree it is due to imperfectness of the spectral model and/or difference in the details of the spectral approximation.
Distinction should be made between classes of objects and multiple observations of individual objects. In the case of luminous BH binaries, spectral variability of individual sources obeys the general - correlation obtained for BH binaries as class. In the case of Seyfert galaxies, the correlations holds for a class of objects but can be violated for repeated observations of individual objects, remaining, however, within the spread of the global correlation. In our opinion, these results are still inconclusive and require further investigation as a number of complications are involved in the case of Seyfert galaxies in comparison with X-ray binaries. The most obvious among those are lower statistics due to significantly lower brightness of Seyferts and existence of molecular tori and broad line regions, which can give additional contribution to the reflected component, and uncorrelated with the Comptonized emission on short time scales.
The physical interpretion of the - and - correlations will advance our understanding of the geometry of the accretion flow in X-ray binaries and Seyfert galaxies and impose valuable constrains on the theoretical models. At present, the correlations appear to be a natural consequence of co-existence of cold media (e.g., an accretion disc) and a hot Comptonizing cloud in the vicinity of the BH. Their geometrical closeness results in double feedback between the two components of the accretion flow. The cold medium provides seed soft photons for the Comptonization as well as it reprocesses and reflects the hard radiation from the hot plasma. If significant fraction of soft seed photons is due to reprocessing of the hard radiation of the hot cloud, the more reprocessing results in more cooling of the hot plasma and, correspondingly, in the softer X-ray spectra. Among the several specific geometries proposed, the most promising appears to be the disc-spheroid model with variable overlap between the hot and cold components of the accretion flow.
Since the characteristic temperature of the accretion disk in AGNs is much lower than in BH binaries, a generic prediction of this type of models is that for a given value of reflection the value of the spectral index will be higher in AGNs than in BH binaries, This prediction is in good agreement with the observed behavior.
We presented a diagnostic to test an interpretation of the - correlation as due to strong ionization of the disc surface layer. It utilizes the independence of the Klein-Nishina cutoff in the reflected spectrum of the ionization state. Applied to existing data, this diagnostic does not support that interpretation.
We found that the pattern of broad-band spectral variability of Seyfert galaxies on day-to-month time scale includes a pivoting of a power law spectrum with the pivot at a high energy, usuallly above a few hundred keV. The pivoting well explains the linear correlations between the logarithm of the X-ray flux and seen in both BH binaries and Seyferts. Then, the observed high pivot energies rule out the interpretation of the - correlation is Seyferts as due to a time-lag effect.
We discuss also the correlation between X-ray and radio fluxes in BH binaries and its physical implications. We conclude that this correlation is most likely due to relation between the level of X-ray emission and the rate of ejection of radio-emitting clouds forming a compact jet. Although peculiar sources might exist, it seems highly unlikely that the correlation is due to synchrotron origin of the X-ray emission from BH binaries in general.
ACKNOWLEDGMENTS
This research has been supported by grants from KBN (5P03D00821, 2P03C00619p1,2) and the Foundation for Polish Science. We thank J. Poutanen, P.-O. Petrucci, J. Malzac, H. Falcke, M. Sikora, R. Moderski, S. Markoff and K. Leighly for valuable discussions and/or comments. We also acknowledge the referee for important comments on the original version of this work.
References
- [1] Arnaud K. A., 1996, in Jacoby G. H., Barnes J., eds., Astronomical Data Analysis Software and Systems V, ASP Conf. Series Vol. 101, San Francisco, p. 17
- [2] Ballantyne D. R., Fabian A. C., 2001, MNRAS, 323, 506
- [3] Ballantyne D. R., Iwasawa K., Fabian A. C., 2001, MNRAS, 323, 506
- [4] Barrio F. E., Done C., Nayakshin S., 2003, MNRAS, in press
- [5] Beloborodov A. M., 1999a, ApJ, 510, L123
- [6] Beloborodov A. M., 1999b, in Poutanen J. & Svensson R., eds., High Energy Processes in Accreting Black Holes. ASP Conf. Ser. Vol. 161, San Francisco, ASP, p. 295
- [7] Beloborodov A. M., 2001, Adv. Sp. Res., 28, 411
- [8] Bevington P. R., Robinson K. D., 1992, Data Reduction and Error Analysis for the Physical Sciences, 2nd Ed., New York, McGraw-Hill
- [9] Blandford R. D., Begelman M. C., 1999, MNRAS, 303, L1
- [Brocksopp et al. 1999] Brocksopp C., Fender R. P., Larionov V., Lyuty V. M., Tarasov A. E., Pooley G. G., Paciesas W. S., Roche P., 1999, MNRAS, 309, 1063
- [10] Chiang J., 2002, ApJ, 572, 79
- [11] Chiang J., Blaes O. M., 2001, ApJ, 557, L15
- [12] Chiang J., Blaes O.M., 2003, ApJ, in press
- [13] Chiang J., Reynolds C. S., Blaes O. M., Nowak M. A., Murray N., Madejski G. M., Marshall H. L., Magdziarz P., 2000, ApJ, 528, 292
- [14] Churazov E., Gilfanov M., Revnivtsev M., 2001, MNRAS, 321, 759
- [15] Coppi P. S., 1999, in Poutanen J. & Svensson R., eds., High Energy Processes in Accreting Black Holes, ASP Conf. Ser. Vol. 161, San Francisco, ASP, p. 375
- [16] Corbel S., Fender R. P., Tzioumis A. K., Nowak M., McIntyre V., Durouchoux P., Sood R., 2000, A&A, 359, 251
- [17] Di Salvo T., Done C., Życki P. T., Burderi L., Robba N. R., 2001, ApJ, 547, 1024
- [18] Done C., Nayakshin S., 2001, ApJ, 546, 419
- [19] Done C., Mulchaey J. S., Mushotzky R. F., Arnaud K., 1992, ApJ, 395, 275
- [20] Done C., Madejski G. M., Życki P. T., 2000, ApJ, 536, 213
- [] Ebisawa K., Ueda Y., Inoue H., Tanaka Y., White N. E., 1996, ApJ, 467, 419
- [Edelson & Vaughan(2000)] Edelson R., Vaughan S., 2000, BAAS, 32, 4.16
- [21] Eracleous M., Sambruna R., Mushotzky R. F., 2000, ApJ, 537, 654
- [22] Esin A. A., McClintock J. E., Narayan R., 1997, ApJ, 489, 865
- [23] Fabian A. C., Rees M. J., Stella L., White N. E., 1989, MNRAS, 238, 729
- [Fender(2002)] Fender R., 2002, LNP Vol. 589, Relativistic Flows in Astrophysics, p. 101
- [24] Frontera F. et al., 2001a, ApJ, 546, 1027
- [25] Frontera F. et al., 2001b, ApJ, 561, 1006
- [26] Gallo E., Fender R., Pooley G. G., 2003, in Durouchoux Ph., Fuchs Y., Rodriguez J., eds., Proceedings of the 4th Microquasar Workshop, Center for Space Physics, Kolkata, in press (astro-ph/0207551)
- [Georganopoulos, Aharonian, & Kirk(2002)] Georganopoulos M., Aharonian F. A., Kirk J. G., 2002, A&A, 388, L25
- [27] George I. M., Fabian A. C., 1991, MNRAS, 249, 352
- [28] Gierliński M., 2000, PhD thesis, N. Copernicus Astron. Center, Warsaw
- [29] Gierliński M., Zdziarski A. A, Done C., Johnson W. N., Ebisawa K., Ueda Y., Haardt F., Phlips B. F., 1997, MNRAS, 288, 958
- [30] Gierliński M., Zdziarski A. A., Poutanen J., Coppi P. S., Ebisawa K., Johnson N. W., 1999, MNRAS, 309, 496
- [31] Gilfanov M., Churazov E., Revnivtsev M., 1999, A&A, 352, 182
- [32] Gilfanov M., Churazov E., Revnivtsev M., 2000, in Zhao G., et al., eds., Proc. 5th CAS/MPG Workshop on High Energy Astrophysics, Beijing, Sci. Techn. Press, p. 114 (GCR00)
- [33] Gliozzi M., Sambruna R. M., Eracleous M., 2003, ApJ, 584, 176
- [34] Gondek D., Zdziarski A. A., Johnson W. N., George I. M., McNaron-Brown K., Magdziarz P., Smith D., Gruber D. E., 1996, MNRAS, 282, 646
- [35] Grandi P., Maraschi L., Urry, C. M., Matt, G., 2001, ApJ, 556, 35
- [36] Grove J. E., Johnson W. N., Kroeger R. A., McNaron-Brown K., Skibo J. G., 1998, ApJ, 500, 899
- [37] Haardt F., Maraschi L., Ghisellini G., 1997, ApJ, 476, 620
- [38] Johnson W. N., McNaron-Brown K., Kurfess J. D., Zdziarski A. A., Magdziarz P., Gehrels N., 1997, ApJ, 482, 173
- [39] Jones F. C., 1994, ApJS, 90, 561
- [Kirk, Rieger, & Mastichiadis(1998)] Kirk J. G., Rieger F. M., Mastichiadis A., 1998, A&A, 333, 452
- [Kotov et al. 2001] Kotov O., Churazov E., Gilfanov M., 2001, MNRAS, 327, 799
- [40] Lamer G., McHardy I. M., Uttley P., Jahoda K., 2003, MNRAS, 338, 323
- [41] Lee J. C., Fabian A. C., Reynolds C. S., Iwasawa K., Brandt W. N., 1998, MNRAS, 300, 583
- [42] Leighly K. M., 1999, ApJS, 125, 297
- [43] Leighly K. M., Mushotzky R. F., Yaqoob T., Kunieda H., Edelson R., 1996, ApJ, 469, 147
- [Li et al. 1999] Li T. P., Feng Y. X., Chen L., 1999, ApJ, 521, 789
- [44] Lightman A. P., White T. R., 1988, ApJ, 335, 57
- [45] Lubiński P., Zdziarski A. A., 2001, MNRAS, 323, L37
- [46] Madejski G. M., Done C., Życki P., 2001, Adv. Sp. Res., 28, 369
- [47] Magdziarz P., Zdziarski A. A., 1995, MNRAS, 273, 837
- [48] Magdziarz P., Blaes O. M., Zdziarski A. A., Johnson W. N., Smith D. A., 1998, MNRAS, 301, 179
- [49] Malzac J., Petrucci P.-O., 2002, MNRAS, 336, 1209 (MP02)
- [50] Malzac J., Beloborodov A. M., Poutanen J., 2001, MNRAS, 326, 417
- [51] Markoff S., Falcke H., Fender R., 2001, A&A, 372, L25
- [52] Markoff S., Nowak M., Corbel S., Falcke H., Fender R., 2003a, A&A, 397, 645
- [53] Markoff S., Nowak M., Fender R., Falcke H., 2003b, in Durouchoux Ph., Fuchs Y., Rodriguez J., eds., Proceedings of the 4th Microquasar Workshop, Center for Space Physics, Kolkata, in press (astro-ph/0208084)
- [54] Markowitz A., Edelson R., 2001, ApJ, 547, 684
- [55] Matt G., 2001, in White N. E., Malaguti G., Palumbo G. G. C., eds., X-ray Astronomy. Stellar Endpoints, AGN and the Diffuse X-ray Background, AIP Conf. Proc. 599, p. 209
- [56] McBreen B., Hurley, K. J., Long R., Metcalfe L., MNRAS, 271, 662
- [McCollough et al.(1999)] McCollough M. L., et al., 1999a, ApJ, 517, 951
- [McCollough et al.(1999)] McCollough L. M., et al., 1999b, Astrophysical Letters Communications, 38, 105
- [57] McConnell M. L., et al., 2002, ApJ, 572, 984
- [58] Merloni A., Fabian A. C., 2001, MNRAS, 328, 958 (MF01)
- [59] Merloni A., Fabian A. C., 2002, MNRAS, 332, 165
- [Meyer, Liu & Meyer-Hofmeister 2000] Meyer F., Liu B. F., Meyer-Hofmeister E., 2000, A&A, 354, L67
- [Miller, Ballantyne, Fabian, & Lewin(2002)] Miller J. M., Ballantyne D. R., Fabian A. C., Lewin W. H. G., 2002, MNRAS, 335, 865
- [Mirabel et al.(1998)] Mirabel I. F., Dhawan V., Chaty S., Rodriguez L. F., Marti J., Robinson C. R., Swank J., Geballe T., 1998, A&A, 330, L9
- [60] Nandra K., Pounds K. A., 1994, MNRAS, 268, 405
- [61] Nandra K., Le T., George I. M., Edelson R. A., Mushotzky R. F., Peterson B. M., Turner T. J., 2000, ApJ, 544, 734 (N00)
- [62] Nicastro F., et al., 2000, ApJ, 536, 718
- [63] Nowak M. A., Wilms J., Dove J. B., 2002, MNRAS, 332, 856
- [Orr et al. 2001] Orr A., Barr P., Guainazzi M., Parmar A. N., Young A. J., 2001, A&A, 376, 413
- [64] Page K. L., Pounds K. A., Reeves J. N., O’Brien P. T., 2002, MNRAS, 330, L1
- [Papadakis et al. 2002] Papadakis I. E., Petrucci P. O., Maraschi L., McHardy I. M., Uttley P., Haardt F., 2002, ApJ, 573, 92 (P02a)
- [65] Perola G. C., Matt G., Cappi M., Fiore F., Guainazzi M., Maraschi L., Petrucci P. O., Piro L., 2002, A&A, 389, 802 (P02b)
- [66] Pounds K. A., Nandra K., Stewart G. G., George I. M., Fabian A. C., 1990, Nat, 344, 132
- [67] Pounds K. A., Done C., Osborne J. P., 1995, MNRAS, 277, L5
- [68] Poutanen J., Svensson R., 1996, ApJ, 470, 249
- [69] Poutanen J., Zdziarski A. A., 2003, in Durouchoux Ph., Fuchs Y., Rodriguez J., eds., Proceedings of the 4th Microquasar Workshop, Center for Space Physics, Kolkata, in press (astro-ph/0209186)
- [70] Poutanen J., Krolik J. H., Ryde F., 1997, MNRAS, 292, L21
- [71] Ptak A., Yaqoob T. Y., Serlemitsos P. J., Mushotzky R. F., Otani C., 1994, ApJ, 436, L31
- [72] Rau A., Greiner J., 2003, A&A, 397, 711
- [73] Revnivtsev M., Gilfanov M., Churazov E., 1999, A&A, 347, L23
- [74] Revnivtsev M., Gilfanov M., Churazov E., 2000, A&A, 363, 1013
- [75] Revnivtsev M., Gilfanov M., Churazov E., 2001, A&A, 380, 520
- [76] Różańska A., Czerny B., 2000, A&A, 360, 1170
- [Shih et al. 2002] Shih D. C., Iwasawa K., Fabian A. C., 2002, MNRAS, 333, 687
- [Stecker & Salamon(1996)] Stecker F. W., Salamon M. H., 1996, ApJ, 464, 600
- [77] Stern B. E., Poutanen J., Svensson R., Sikora M., Begelman M. C., 1995, ApJ, 449, L13
- [78] Ueda Y., Ebisawa K., Done C., 1994, PASJ, 46, 107
- [Vadawale, Rao, & Chakrabarti(2001)] Vadawale S. V., Rao A. R., Chakrabarti S. K., 2001, A&A, 372, 793
- [79] Vaughan S., Edelson R., 2001, ApJ, 548, 694 (VE01)
- [80] Wang J.-X., Zhou Y.-Y., Wang T.-G., 1999, ApJ, 523, L129
- [81] Wardziński G., Zdziarski, A. A., 2000, MNRAS, 314, 183
- [82] Wardziński G., Zdziarski A. A., Gierliński M., Grove J. E., Jahoda K., Johnson W. N., 2002, MNRAS, 337, 829
- [83] Weaver K. A., Krolik J. H., Pier E. A., 1998, ApJ, 498, 213
- [84] Wen L., Cui W., Bradt H. V., 2001, ApJ, 546, L105
- [85] White T. R., Lightman A. P., Zdziarski A. A., 1988, ApJ, 331, 939
- [Wilms et al. 1999] Wilms J., Nowak M. A., Dove J. B., Fender R. P., di Matteo T., 1999, ApJ, 522, 460
- [86] Woźniak P. R., Zdziarski A. A., Smith D., Madejski G. M., Johnson W. N., 1998, MNRAS, 299, 449
- [87] Yaqoob T., Warwick R. S., Makino F., Otani C., Sokoloski J. L., Bond I. A., Yamauchi M., 1993, MNRAS, 262, 435
- [Yaqoob et al. 2002] Yaqoob T., Padmanabhan U., Dotani T., Nandra K., 2002, ApJ, 569, 487
- [88] Young A. J., Fabian A. C., Ross R. R., Tanaka Y., 2001, MNRAS, 325, 1045
- [89] Zdziarski, A. A. 1999, in Poutanen J. & Svensson R., eds., High Energy Processes in Accreting Black Holes, ASP Conf. Ser. Vol. 161, San Francisco, ASP, p. 16
- [90] Zdziarski A. A., Grandi P., 2001, ApJ, 551, 186 (ZG01)
- [91] Zdziarski A. A., Johnson W. N., Done C., Smith D., McNaron-Brown K., 1995, ApJ, 438, L63
- [92] Zdziarski A. A., Johnson W. N., Magdziarz P., 1996, MNRAS, 283, 193
- [93] Zdziarski A. A., Poutanen J., Mikołajewska J., Gierliński M., Ebisawa K., Johnson W. N., 1998, MNRAS, 301, 435
- [94] Zdziarski A. A., Lubiński P., Smith D. A., 1999, MNRAS, 303, L11 (ZLS99)
- [95] Zdziarski A. A., Poutanen J., Johnson W. N., 2000, ApJ, 542, 703
- [96] Zdziarski A. A., Leighly K. M., Matsuoka M., Cappi M, Mihara T., 2002a, ApJ, 573, 505
- [97] Zdziarski A. A., Poutanen J., Paciesas W. S., Wen L., 2002b, ApJ, 578, 357 (Z02)
- [98] Życki P. T., Czerny B. 1994, MNRAS, 266, 653
- [99] Życki P. T., Done C., Smith D.A., 1998, ApJ, 496, L25
- [100] Życki P. T., Done C., Smith D. A., 1999, MNRAS, 305, 231
Appendix A Pivoting
Let us consider spectral variability consisting of pivoting. Namely, an initial spectrum (a power law or not) is multiplied by , where is the pivot energy and is a perturbation spectral index. In particular, when the initial spectrum is a power law, we have a variable power-law photon spectrum, , where is a constant. Then there is linear relation between the logarithm of the monochromatic flux at a given energy, , and the variable slope,
| (13) |
A similar linear relation holds approximately for the energy flux in an interval from to . Thus, pivoting results in an (approximate) linear dependence between the logarithm of the flux (not flux itself) and the spectral index, as illustrated by the dashed lines in Fig. 7.
A.1 Moments of the flux
If pivoting variability occurs on time scales shorther than a given observation, the measured average spectrum will consist of the initial spectrum (in particular, a power law itself) times the average of , . If constant and the distribution in time of is uniform from to , the flux average is given by,
| (14) |
where
| (15) |
If the distribution of is Gaussian, i.e., (where now is the standard deviation of the distribution of ), we have,
| (16) |
Note that the concave form of these spectra yield strong departures from the initial power law at . Pivoting on short time scales can account (at least in part) for the soft X-ray excesses commonly seen in Seyferts and BH binaries. Pivoting may also explain an apparently concave part of the extragalactic -ray spectrum (Stecker & Salamon 1996), although it requires the pivot energy to be within that part (which issue was not considered by those authors).
This variability will also contribute to the flux variance, . The variance normalized to the average flux is given by
| (17) |
for the uniform distribution of , and
| (18) |
for the Gaussian distribution of . With addition of some energy-independent variability, , the ratio reproduces well the fractional variability of Cyg X-1 in the hard state on long time scales, see Fig. 9.
Then, the skewness, , is given by,
| (19) | |||||
for the uniform distribution of , and
| (20) |
for the Gaussian distribution of . This quantity may be useful for testing whether a given variability pattern is related to pivoting. Also, the kurtosis, , is given by,
| (21) |
for the Gaussian distribution of .
On the other hand, it is rather unlikely that the pivot energy is completely constant in an astrophysical system. Instead, a range of pivoting energy is expected from some physical constraints on the emitting plasma, see fig. 3 in ZG01 and fig. 14 in Z02. Therefore, we also consider a case when the pivot energy is distributed log-normally, i.e., given by , where is distributed and is the standard deviation of this distribution. When is also distributed normally, the average departure from the original spectrum is given by,
| (22) | |||||
where
| (23) |
The variance is then,
| (24) |
and the variance normalized to the average flux is,
| (25) | |||||
for . Note that a finite range of the pivot energy results in a finite variance at , as given by the third line of equation (25), in contrast to the case with the fixed pivot, equation (18). Thus, the above dependence fits well the long-term behaviour of Cyg X-1 in the hard state without an additional constant, see Fig. 9.
The skewness is given by,
| (26) | |||||
for .
Above, we assumed that variations of the pivot energy are uncorrelated with those of the spectral index. Note that a correlation between these quantities would result in time lags between light curves measured at different energies (Kotov, Churazov & Gilfanov 2001).
A.2 Moments of the logarithm of flux
The moments of the distributions above assume especially simple forms for the logarithm of flux. We define,
| (27) |
where is a departure from the initial spectrum, as above. Then, for a Gaussian distribution of and a constant , the distribution of is Gaussian itself, with
| (28) |
Thus, the apparently non-Gaussian distribution of the linear flux (equations [20]–[21]) becomes completely Gaussian when its logarithm is used. Such log-normal distributions are, in fact, very common in natural phenomena ranging from terrestrial lightning to -ray bursts (McBreen et al. 1994). Note then that a positive skewness of the distribution of a linear variable (e.g., Leighly 1999) is not necessary an indication of non-Gaussianity of the underlying processes.
In the case of Gaussian distributions of both and , is a product of two variables ( and ), each having a Gaussian distribution, and
| (29) |
Note that and are not simply products of the corresponding quantities for each of the two variables due to a non-zero center value of the latter. Then, the resulting distribution of is not completely Gaussian, and, in particular, .