A 60 pc counter-rotating core in NGC 4621††thanks: Based on observations collected at Canada-France-Hawaii Telescope, which is operated by CNRS of France, NRC of Canada, and the University of Hawaii.
We present adaptive optics assisted OASIS integral field spectrography of the S0 galaxy NGC 4621. Two-dimensional stellar kinematical maps (mean velocity and dispersion) reveal the presence of a pc diameter counter-rotating core (CRC), the smallest observed to date. The OASIS data also suggests that the kinematic center of the CRC is slightly offset from the center of the outer isophotes. This seems to be confirmed by archival HST/STIS data. We also present the HST/WFPC2 colour map, which exhibits a central elongated red structure, also slightly off-centered in the same direction as the kinematic centre. We then construct an axisymmetric model of NGC 4621: the two-integral distribution function is derived using the Multi-Gaussian Expansion and the Hunter & Qian (hun (1993)) formalisms. Although the stellar velocities are reasonably fitted, including the region of the counter-rotating core, significant discrepancies between the model and the observations demonstrate the need for a more general model (e.g. a three-integral model).
Key Words.:
Galaxies: elliptical and lenticular, cD – Galaxies: evolution – Galaxies: individual: NGC 4621 – Galaxies: formation – Galaxies: kinematics and dynamics – Galaxies: nuclei1 Introduction
The fact that early-type galaxies are not necessarily oblate major-axis rotators has been well known since the end of the 1970s. The number of objects showing significant minor-axis rotation attained ten in 1988 (Wagner et al. wag88 (1988)), and some of these objects later showed evidence for kinematically decoupled core structures (NGC 4365, NGC 4406: Bender ben88 (1988); NGC 4589: Moellenhoff & Bender moe89 (1989); NGC 5982: Wagner wag90 (1990)). The most cited formation scenario for such structures is the hierarchical model, which involves single or multiple merging steps (see e.g. Cole et al. (1994) and references therein). Observations of kinematically decoupled cores can therefore be used to constrain the merger tree of galaxies. However the total fraction of early-type galaxies containing such a core is poorly known (de Zeeuw & Franx dez91 (1991)). Such cores are generally revealed using long-slit measurements with 1″ FWHM or worse spatial resolution: this introduces an a priori assumption on the geometry of the central structures, and prevents the detection of cores with small apparent sizes. Finally, the rough characteristics of these cores (fraction in mass, relative age and metallicity) remain very uncertain, as very few studies exist and are often limited to morphological data (see Carollo et al. marc (1997) for 15 KDCs).
Recent studies (e.g. Verolme et al. ellen (2002)) show that state-of-the-art models combined with two-dimensional integral-field spectroscopic data are required to constrain precisely the global physical parameters of early-type galaxies, such as the inclination angle or the mass-to-light ratio, as well as the central characteristics for objects exhibiting features such as kinematically decoupled cores (e.g. the core mass of IC 1459, Cappellari et al. ic1459 (2002)). Moreover, integral-field spectroscopy also provides access to line-strength maps: the detailed kinematic information can thus be coupled to the line indices in order to more easily disentangle the core from the host galaxy (Davies et al. 2001).
The SAURON survey (Bacon et al. 2001a , de Zeeuw et al. paperII (2002)) was carried out in order to study the integral field kinematics of a sample of 72 early-type galaxies over a wide field of view ( 33″41″). In parallel, to obtain complementary high spatial resolution data, we designed a program to observe their central parts (5″5″) with the integral field spectrograph OASIS (Bacon et al. oasis (2000)). The aim is to probe the central spatial morphology and dynamics of a subset of galaxies in the SAURON sample, in order to link them with the global properties of the host galaxies provided by SAURON and other wide field studies. The additional use of PUEO (Rigaut et al. pueo (1998)), the Canada France Hawaii Telescope AO bonnette, with OASIS allows us to reach resolutions of about ( pc at 10 Mpc) in the red part of the visible when bright guiding sources are available.
NGC 4621, an S0 galaxy (Lauer et al. paper1 (1995)), with , located in the Virgo cluster (D=18.3 Mpc, Tonry et al. sbf_ton (2001)), is the first target of the subsample that was observed with OASIS/PUEO. Its steep power-law central luminosity profile (, Gebhardt et al. paper3 (1996)) is ideally adapted to serve as a guiding source for the AO. NGC 4621 is close to edge-on, and its innermost isodensities reveal a nuclear disk (Sil’Chenko et al. silchenko (1997)).
In this paper, we present the first results of our OASIS observations of NGC 4621, with the discovery of the smallest counter-rotating stellar core observed to date. The scale of the core is 60 pc, while the previously detected cores have an average radius of around 1 kpc (see the sample of Carollo et al. marc (1997)). Detailed information on the different data sets used in this work, including HST/WFPC2 and STIS observations, are provided in Sect. 2. The corresponding measured photometry and stellar kinematics are presented in Sect. 3. We computed a two-integral distribution function (DF) model of the galaxy, which is presented in Sect. 4. The discussion is carried out in Sect. 5.
2 Observational data sets
2.1 OASIS data
2.1.1 Observations
Ca-triplet OASIS exposures of NGC 4621 were obtained in January 2000 using the medium spectral configuration (MR3: 8346-9152 Å) at the f/20 (PUEO) focus of the CFHT, and a spatial sampling of 016. Eight out of ten 30 mn exposures were fully reduced using the dedicated XOasis package111http://www-obs.univ-lyon1.fr/~oasis/home/index.html, and merged into a single frame (two frames were discarded due to bad seeing conditions and associated loss of guiding). The resulting 3D dataset222, one spectrum per spatial element probes about (300300 pc2), with a resolution of km.s-1. We modeled the PSF of the merged datacube using the sum of two concentric Gaussians: their parameters were retrieved (via a least-square procedure) by comparison with the WFPC2/HST F814W frame as in Bacon et al. (2001b ). The resulting FWHM of the merged datacube is 051.
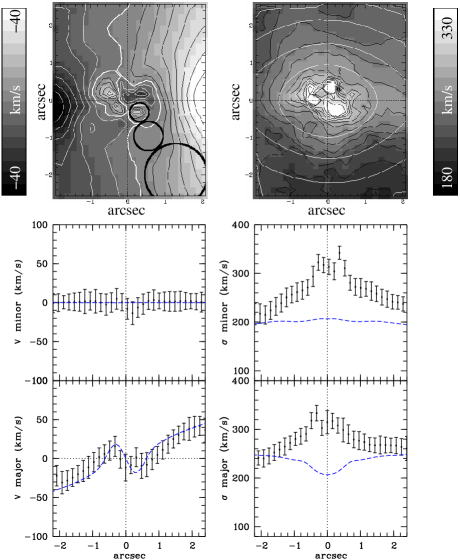
The total S/N (summed over the bandwidth) drops very quickly towards the outer parts, as it is 65 at the center, 20 at 1″ and 10 at 2″on the major-axis. We thus convolved the datacube with a Gaussian of variable width in order to obtain a higher S/N over the field (see Fig. 1).
2.1.2 Kinematic measurements
We used a tuned version of the Fourier Correlation Quotient (FCQ; Bender bender (1990)) method to derive the line of sight velocity distributions (LOSVD) at each measured spatial position. We used a single template star (G8III: HD073665), but tested the stability of the kinematical mesurements with different templates, and different continuum subtraction parameters, only resulting in minor differences. The LOSVDs were then fitted using a single Gaussian function, yielding the mean velocity and dispersion maps. We could not obtain reasonable maps of higher order moments, due to the rather low signal to noise ratio (even after the convolution performed on the datacube). The error bars on the velocity and dispersion measurements were computed via a Monte-Carlo algorithm using the measured S/N (see Copin copin (2000), PhD Thesis).
2.2 Ancillary data
2.2.1 Photometry
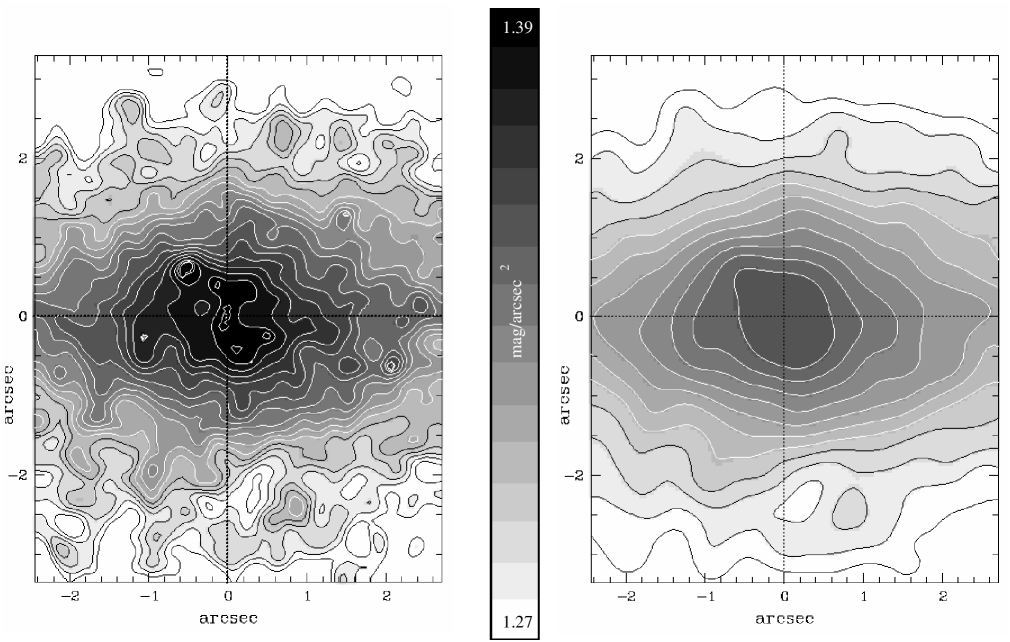
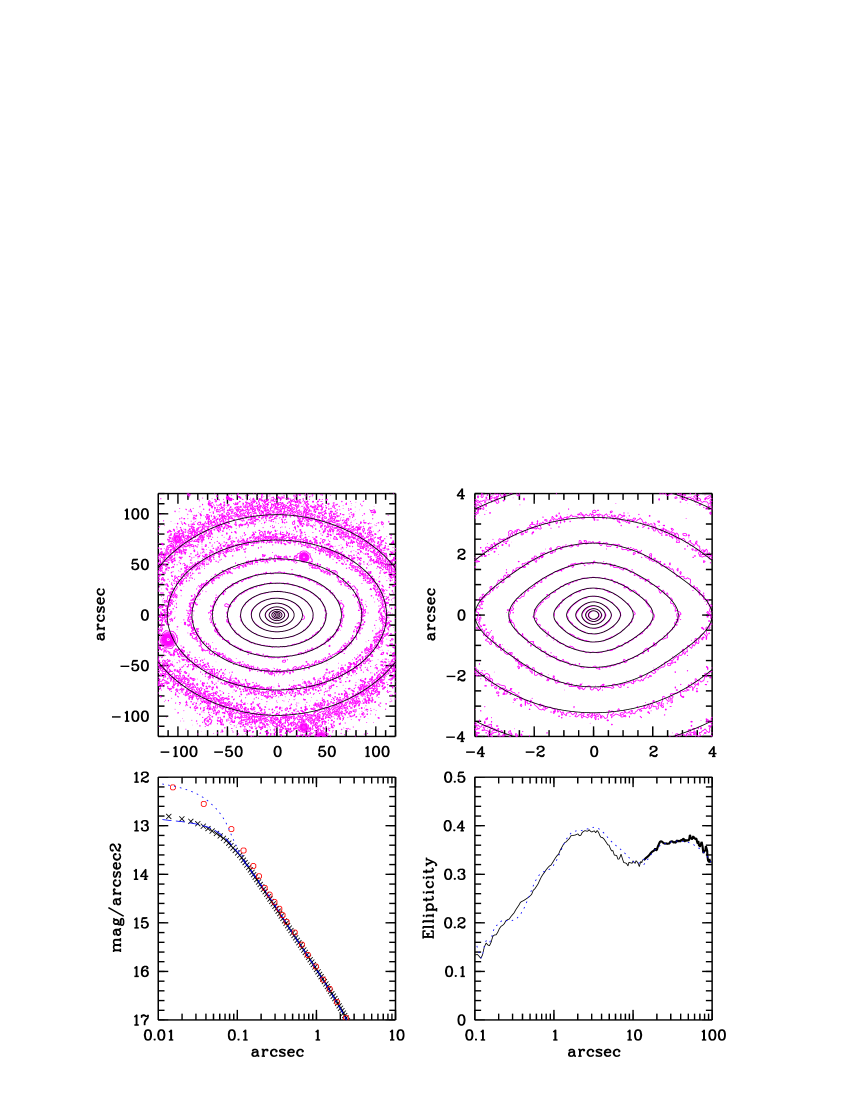
In order to obtain an accurate three-dimensional mass model of the galaxy we need both wide-field and high-resolution photometry to probe the visible mass up to large radii and to correctly sample the central structure (the cusp). We used a 20′ band image of the galaxy taken at the OHP 2m Telescope, kindly provided by R. Michard (Idiart, Michard, & de Freitas Pacheco mich (2002)). The central regions were examined with the help of WFPC2/HST data333based on observations collected with the NASA/ESA HST, obtained at STScI, which is operated by AURA, Inc, under NASA contract NAS5-26555 retrieved from the archive (F555W and F814W filters, Faber et al. paper4 (1997), #5512). For both bands, three unsaturated frames were merged and cosmic ray-corrected (330 s and 230 s exposure time for F555W and F814W filters respectively). We performed photometric calibration using the VEGAMAG standard, and used the PSFs computed using tinytim444http://www.stsci.edu/software/tinytim/tinytim.html. We adjusted the levels of the OHP image to the F555W frame taking into account the different spectral domains and the PSF.
2.2.2 Long-slit kinematics
We used long slit data from Bender, Saglia, & Gerhard (BSG94 (1994), hereafter BSG94; data kindly provided by R. Bender) in order to complement the OASIS data up to large radii: major and minor axis velocity and dispersion measurements are available inside 40″ (3.5 kpc), with a seeing of 18 FWHM (other kinematical - and line-strength - measurements were published by Sil’chenko silchenko (1997), but with a lower spatial resolution).
We finally reduced unpublished HST/STIS major-axis data (Green, ID #8018; G750M grating, Ca-Triplet) in order to examine the central kinematics of NGC 4621 at high spatial resolution. Two exposures with a total of 72 mn were available. The calibrated data were retrieved via the STScI data archival system (calstis pipeline). Appropriate flat field exposures were retrieved to correct for the fringing (mkfringeflat/defringe IRAF routines, Goudfrooij & Christensen defringe (1998)), critical at these wavelengths, as well as five K0-III kinematical template star exposures (HR7615, Green, #7566). Further rejection of cosmic rays was then performed on the NGC 4621 individual exposures, before recentring and merging. The stellar kinematics were extracted using the same FCQ and fitting methods as for the OASIS data. As for the OASIS datacubes, the S/N of the STIS data was found sufficient only to derive the mean stellar velocity and dispersion within the central arcsecond.
3 Results
To avoid any confusion due to the complexity in both the photometry and the kinematics of NGC 4621, we will use the following convention: the photometric major axis of the galaxy (as measured by HST) defines the -axis, the negative values being in the SE quadrant, referred to as the left side of the galaxy. The center is defined as the center of the HST isophotes of NGC 4621 within 1″, excluding the central 01, the isophotes of which exhibit a significant asymmetry (see next Section). The centering and rotation procedures of the HST frames have been performed using an algorithm which minimizes the standard deviation of the recentered and rotated frame subtracted by its flipped counterpart. This leads to accuracies of 0.1 degrees and 0005. All figures in this paper share a common orientation, as shown in Fig. 3.
3.1 Stellar velocity and velocity dispersion
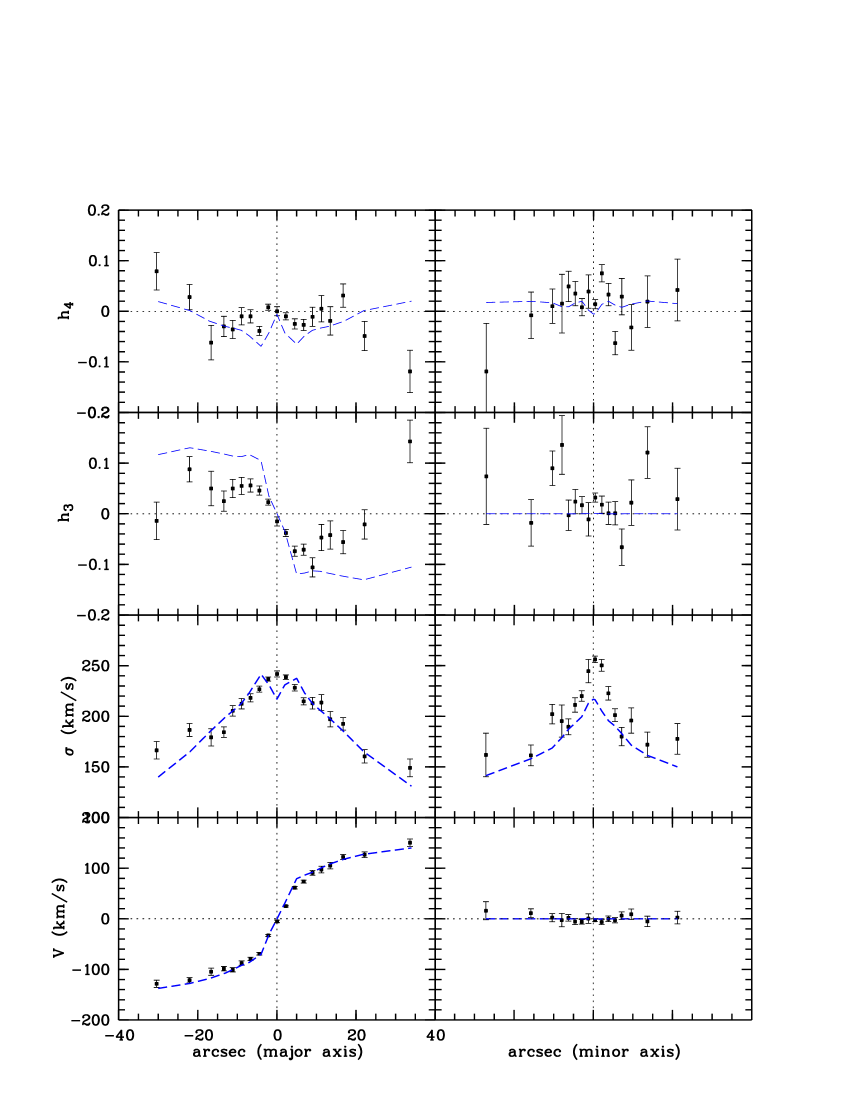
The OASIS stellar mean velocity and dispersion maps are presented in Fig. 1. The datacubes have been centered and rotated in order to match the HST data, using the center and angle provided by the PSF fitting procedure mentioned in Section 2. The velocity field reveals a clear counter-rotating core (CRC). The position of the zero-velocity curve is used to measure the center and the size555The limits of the CRC are defined by the zero-velocity curve of the CRC: it is 17 (150 pc) in diameter, and off-centered by towards the SE. The total velocity amplitude observed within the central 1″ along the major axis is 100 km.s-1, while the peak-to-peak velocity amplitude of the CRC’s is only 35 km.s-1. The stellar velocity dispersion map peaks at km.s-1. The dispersion map however exhibits high frequency substructures in the central 05 (Fig.1), the minor-axis dispersion profile even having a local minimum at the centre. Considering the amplitude of these structures and their spatial scales (comparable to the local FWHM), we should wait for data with better signal to noise ratio to discuss these features.
The BSG94 data show no significant minor-axis rotation, and a maximum velocity of km.s-1 at 30″(see BSG94 or Fig. 7). Besides a relatively weak velocity amplitude in the innermost 4″ ( 60 km.s-1), these data do not show any hint for the existence of the counter-rotating core. We will use the BSG94 kinematics to constrain the dynamical model outside the OASIS field of view.
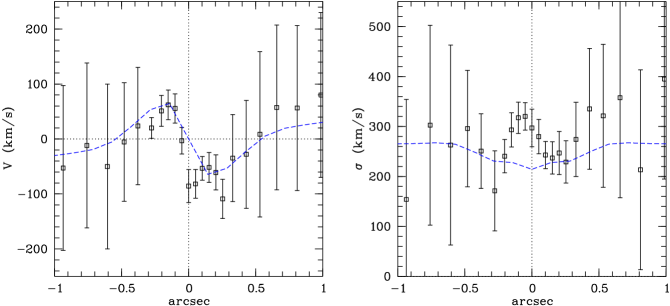
The STIS velocities and dispersions are shown in Fig. 2. In these data the size of the CRC is 07 ( pc) and its velocity center is located at ( pc). We have carefully checked the centering of the STIS data with respect to the reference WFPC2 images, and found that this offset is robust. At STIS resolution the major-axis velocities of the CRC reach km.s-1with respect to the systemic. The maximum velocity dispersion is km.s-1, at . These values are consistent with the OASIS data considering the higher spatial resolution of the STIS data.
 |
3.2 HST photometry
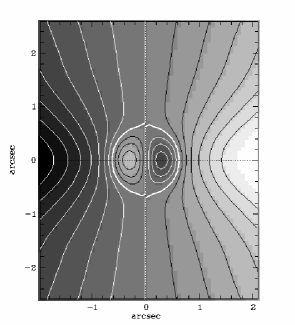
Both F555W and F814W images reveal a peculiar structure in the core. Indeed, the luminosity peak is offset from the center of the outer isophotes by 001 towards the east. The photometric peak is located in the upper left quadrant (Fig. 3). This feature does not seem to be an artefact, as it is clearly visible on each individual HST frame, and in both bands, and cannot be attributed to centering uncertainties (0005).
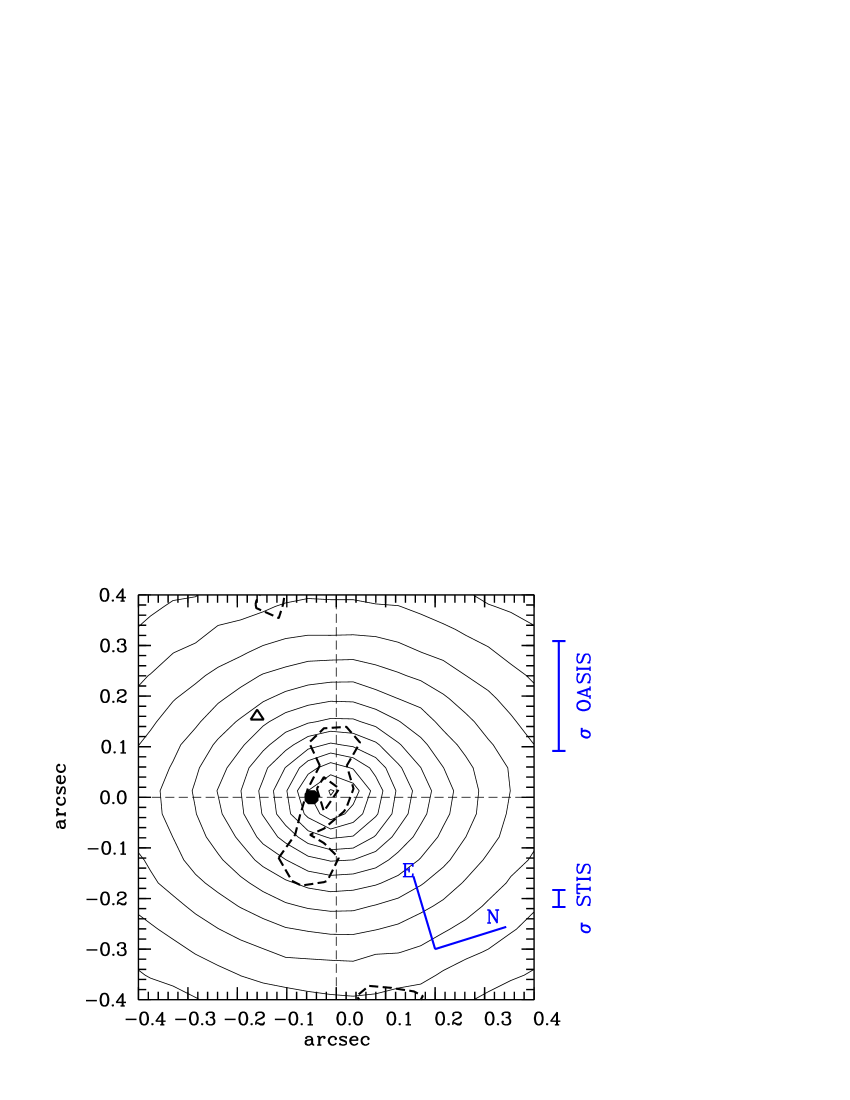
The two HST frames were then PSF-crossconvolved and divided to obtain a colour image (Fig. 4). It reveals a central gradient (V-I increases towards the center) with a -axis elongated structure centered at (-002, 001) (see dashed line on Fig. 3). The isochromes have slightly higher ellipticities than the isophotes ( at 25 for , vs. 0.4 for the frame).
4 Models
In this Section, we present the methods used to model the photometry and kinematics of the central region of NGC 4621. The available data suggest that the very central region (100 pc) of NGC 4621 slightly departs from axisymmetry. The CRC seems off-centered in both the OASIS and STIS data. However, the off-centering is only pc. At the resolution of the BSG94 data, this is obviously not resolved. Moreover, the position angle measured in the OHP photometry does not vary more than 2 degrees within 15′. Axisymmetry is therefore a reasonable approximation for a first modelling. Axisymmetric, two-integral models then have the advantage to be semi-analytical. We first derived simple Jeans models to roughly constrain the input parameters (inclination, mass-to-light ratio). We then used the Hunter & Qian (hun (1993)) formalism to compute the two-integral distribution function of NGC 4621, as a function of energy () and of the vertical component of angular momentum (). The present modelling is only intended to provide a first view at the dynamics of NGC 4621, so we decided not to include a central dark component: this issue will be examined in detail in a forthcoming paper.
4.1 MGE
| 1 | 4.502 105 | 0.040 | 0.860 |
|---|---|---|---|
| 2 | 7.713 104 | 0.112 | 0.610 |
| 3 | 4.792 104 | 0.201 | 0.941 |
| 4 | 1.161 104 | 0.438 | 0.344 |
| 5 | 1.475 104 | 0.516 | 0.919 |
| 6 | 4.638 103 | 1.036 | 0.325 |
| 7 | 6.317 103 | 1.280 | 0.872 |
| 8 | 3.357 103 | 2.486 | 0.275 |
| 9 | 2.700 103 | 3.211 | 0.658 |
| 10 | 1.326 103 | 5.698 | 0.817 |
| 11 | 6.313 102 | 6.926 | 0.377 |
| 12 | 6.417 102 | 12.468 | 0.639 |
| 13 | 3.295 102 | 25.674 | 0.627 |
| 14 | 8.208 101 | 57.091 | 0.633 |
| 15 | 1.517 101 | 128.782 | 1.000 |
The first step in modelling NGC 4621 was to build a luminosity model which properly reproduced the observed photometry. We used the Multi Gaussian Expansion (MGE) formalism proposed by Monnet et al. (monnet (1992)) and Emsellem et al. (mge (1994)), which expresses the surface brightness as a sum of two-dimensional Gaussians. Assuming the spatial luminosity is also a sum of (three-dimensional) Gaussians, given the choice of viewing angles, and using an MGE model for the PSF, we could then deconvolve and deproject the MGE model uniquely and analytically.
The procedure was performed stepwise. We began fitting the wide field -band image. We then subtracted the outer gaussian components from the high resolution WFPC2 image, and fitted the residual image (central 15″). In this step, we had to exclude the innermost 04, to avoid convergence problems probably due to the slightly asymmetric central feature (Fig. 3). We finally fitted the very central arcsecond. Gathering these three parts, we thus obtained a 15 gaussian components model, with the same center and PA, the parameters of which are given in Table 1. The goodness of the fit is illustrated in Fig. 5.
4.2 Two-integral models
We then made use of the Hunter & Qian (hun (1993)) formalism to build the two-integral distribution function of the galaxy using the best fit value for the mass-to-light ratio of found from simple Jeans models. We used a default value of , which produced a marginally better fit.
The DF is divided into two parts, which are respectively even and odd in . The even part () is uniquely determined by the input MGE mass model. This involves the calculation of a path integral in the complex plane, as described by Hunter & Qian (hun (1993)). The odd part of the distribution function () is then parametrized, and adjusted to fit the kinematical data. We chose the parametrization proposed by van der Marel et al. (vdm (1994)), and modified it to account for the CRC. The original parametrization corresponds to Eq. 1, and we additionally allowed to be function of (Fig. 6). The analytical form of this function is the same as the one in Eq. 5, with an additional variable change. We can adjust the energy above which the stars begin to counter-rotate, as well as the smoothness of the transition (: abrupt transition, : smooth transition, see Fig. 6).

| (1) | |||||
| (5) |
The best fit model reproduces the BSG94 velocity profiles reasonably well (Fig. 7) with values of ranging from 8 outside 10″ to -2 in the central part. The higher resolution OASIS (Figs. 8 and 1), and STIS (Fig. 2) velocity measurements, revealing the counter-rotating core, are also well fitted by this two-integral model. The best fitting model uses a core with a diameter of 11 (), and an abrupt transition ( i.e. almost all stars having are counter-rotating, see bold line in Fig. 6). A rough estimate of the CRC mass can be made by selecting stars counter-rotating in the central part. This is performed by integrating the DF weighted by a function which is 0 for and and 1 otherwise. The total mass of NGC 4621, which is given by the mass-to-light ratio and the deprojected MGE-model is . The total mass of the CRC is , yielding a mass fraction of 0.12%.
The dispersion profiles are well reproduced by the model outside the central few arcseconds. The central values of the dispersion predicted by the models are however systematically too low compared to the BSG94 observations. This is confirmed by the OASIS and STIS dispersion values: the model predicts a central dispersion of km.s-1, to be compared with the central observed STIS dispersion of km.s-1. We were finally unable to fit the higher order moments, even at large radii. The values predicted by the model are thus systematically too high, by a factor of almost two. This discrepancy could not be solved even by changing the parameters of the odd part of the DF.
These two discrepancies do indicate that we need a more general dynamical model for NGC 4621. First, we should remove the constraint imposed by the two-integral model by allowing a third integral of motion. There may then still be the need for an additional central dark mass to explain the observed dispersion values. Such a model will be examined in a forthcoming paper (Wernli et al., in preparation).
5 Discussion and conclusion
In this paper, we report the discovery of a pc diameter counter-rotating core using new OASIS integral field spectroscopy, a result confirmed with archival STIS long-slit data. A structure at this scale has never been observed before, except in M 31, which exhibits a 20 pc co-rotating decoupled core (Bacon et al. 2001b and references therein). Typical sizes of kinematically decoupled cores are at the order of 1 kpc (See e.g. the sample of Carollo et al. marc (1997)). The computed mass fraction of 0.12% () is on the low side, as compared for instance to the CRC of IC 1459, which is 0.5% for a core size of 3 kpc (Cappellari et al. ic1459 (2002)), but for which the estimation is of higher accuracy. As a comparison, the black hole mass from the relation for IC 1459 is (Merritt & Ferrarese 2001b ) and for NGC 4621 (Merritt & Ferrarese bhmasses (2001)). The mass fraction estimate provided here in the case of NGC 4621 can only be indicative: the DF separation is inaccurate and difficult, and to get a precise result we would need an analysis in integral space.
Both individual OASIS and STIS data sets suggest that the CRC of NGC 4621 is slightly off-centered with respect to the center of the outer isophotes. This offset seems consistent with the weak asymmetry detected in the WFPC2/HST and frames and the colour map (Fig. 3). The central structure elongated along the minor axis detected in the colour map represents an increase of which could either be due to an intrinsic stellar population gradient, or to dust. In the latter case, this would correspond to (assuming and from models of the Galaxy, Rieke & Lebofsky dust (1985)). Note that we do not detect any high frequency structure in the individual WFPC2 and frames.
The two-integral models reasonably reproduce the observed velocity profiles in the outer parts, as well as in the region of the CRC (OASIS and STIS). These axisymmetric models do obviously not take into account the observed off-centering. The predicted central value of the velocity dispersion is significantly too low by 50 km.s-1. We were also unable to simultaneously fit higher order Gauss-Hermite moments: e.g. the predicted is systematically too high (see Fig. 7). This demonstrates that we need more general dynamical models in order to properly fit the observed kinematics. We are therefore in the process of constructing three-integral Schwarzschild models, with the possibility to include a central dark mass. This may solve the discrepancies mentioned above.
If one assumes a merger-scenario for the CRC’s origin, the off-centering, if confirmed, could be either due to the fact that the merging process is still on-going, or may be the result of a stable mode (see e.g. M 31 in Bacon et al. 2001b ). The short dynamical timescale at the radius of the CRC (1 Myr) seems to favour the latter hypothesis. Further discussions regarding this issue must however wait for additional spectroscopy. A detailed study at high spatial resolution of the stellar populations in the central arcsecond would certainly help in this context. Existing high resolution STIS spectra at bluer wavelengths can be used for this purpose.
Stellar kinematics at HST resolution is available for only a handful of early-type galaxies. M 31 is one of the rare examples where it is possible to have sufficient spatial resolution to measure kinematical features at parsec scales, such as its 20 pc nucleus (Bacon et al. 2001b and references therein). The OASIS data presented in this paper demonstrate that it is possible to study substructures with a characteristic size of 60 pc in galaxies at the distance of the Virgo cluster. The presence of the CRC in NGC 4621 raises new questions about the dynamical status of the centers of early-type galaxies. What is the fraction of early-type galaxies that have such substructures? Two-dimensional spectroscopy at high spatial resolution is clearly needed to simultaneously study the dynamical and chemical contents of these cores, and to eventually understand their origin.
Acknowledgements.
We would like to thank Raymond Michard and Ralf Bender for the data they provided, Tim de Zeeuw for a careful reading of the manuscript and his suggestions, and the referee Dr M. Carollo for her thorough and constructive report.References
- (1) Bacon, R., Emsellem, E., Copin, Y., Monnet, G., 2000, In Imaging the Universe in Three Dimensions, eds W. van Breugel & J. Bland-Ilawthorn, ASP Conf. Ser. 195, 173
- (2) Bacon, R., Copin, Y., Monnet, G., Miller, Bryan W., Allington-Smith, J. R., Bureau, M., Marcella Carollo, C., Davies, Roger L., Emsellem, E., Kuntschner, H., Peletier, Reynier F., Verolme, E. K., Tim de Zeeuw, P., 2001, MNRAS, 326, 23
- (3) Bacon, R., Emsellem, E., Combes, F., Copin, Y., Monnet, G., Martin, P., 2001, A&A, 371, 409
- (4) Bender R., 1988, A&A, 202, L5
- (5) Bender, R., Saglia, R. P., Gerhard, O. E., 1994, MNRAS, 269, 785, BSG94
- (6) Bender, R., 1990, A&A, 229, 441
- (7) Byun, Y., Grillmair, C. J., Faber, S. M., Ajhar, E. A., Dressler, A., Kormendy, J., Lauer, T. R., Richstone, D., Tremaine, S., 1996, AJ, 111, 1889
- (8) Cappellari, M., Verolme, E. K., van der Marel, R. P., Verdoes Kleun, G. A., Illingworth, G. D., Franx, M., Carollo, C. M., de Zeeuw, P. T., 2002, astroph/0202155
- (9) Carollo, C. M., Franx, M., Illingworth, G. D., Forbes, D. A., 1997, AJ, 481, 710
- Cole et al. (1994) Cole, S., Aragon-Salamanca, A., Frenk, C. S., Navarro, J. F., & Zepf, S. E. 1994, MNRAS, 271, 781
- (11) Copin, Y., 2000, Dynamique des galaxies de type précoce: observations 3D et modélisations, PhD Thesis, Ecole Normale Supérieure de Lyon
- (12) van der Marel, R. P., Evans, N. W., Rix, H.-W., White, S. D. M., & de Zeeuw, T. 1994, MNRAS, 271,99
- (13) Emsellem, E., Monnet, G., Bacon, R., 1994, A&A, 285, 723
- (14) Faber, S.M., Tremaine, S., Ajhar, E.A., Byun, Y.I., Dressler, A., Gebhard, K., Grillmair, C., Kormendy, J., Lauer, T.R., Richstone, D., 1997, AJ, 114, 1771
- (15) Gebhard, K, Richstone, D., Ajhar, E.A, Lauer, T .R., Byun, Y.I., Kormendy, J., Dressler, A., Faber, S.M., Grillmar C., Tremaine, S., 1996, AJ, 112, 105
- (16) Goudfrooij, P., 1998, STIS Instrument Science Report, 98-29
- (17) Hunter, C., Qian, E., 1993, MNRAS, 262, 401
- (18) Idiart, T. P., Michard, R., & de Freitas Pacheco, J. A. 2002, A&A, in press
- (19) Lauer T. R., Ajhar E. A., Byun Y.-I., et al., 1995, AJ, 110, 2622
- (20) Merritt, D. & Ferrarese, L., 2001, MNRAS, 320, L30
- (21) Merritt, D. & Ferrarese, L., 2001, ApJ, 547, 140
- (22) Moellenhoff C., Bender R., 1989, A&A, 214, 61
- (23) Monnet, G., Bacon, R., Emsellem, E., 1992, A&A 253, 366
- (24) Rieke G. H., Lebofsky M. J., 1985, ApJ, 288, 618
- (25) Rigaut, F., Salmon, D., Arsenault, R., Thomas, J., Lai, O., Rouan, D., V ran, J. P., Gigan, P., Crampton, David, Fletcher, J. M., Stilburn, J., Boyer, C., Jagourel, P., 1998, PASP 110, 152
- (26) Sil’chenko, O. K., 1997, Astronomy Reports, 41, 567
- (27) Tonry, J. L., Dressler, A. , Blakeslee, J. P. , Ajhar, E. A. , Fletcher, A. ;. , Luppino, G. A. , Metzger, M. R. , Moore, C. B., 2001, APJ, 546, 681
- (28) Verolme, E. K., Cappellari, M., Copin, Y., van der Marel, R. P., Bacon, R., Bureau, M., Davies, R. L., Miller, B. M., de Zeeuw, P. T., 2002, MNRAS, in press
- (29) Wagner, S. J., Bender, R., Moellenhoff, C., 1988, å, 195, 5-8
- (30) Wagner, S. J., Dynamics and Interactions of Galaxies, 1990, 244-248, Wielen, R., Springer Verlag
- (31) de Zeeuw, P. T., Bureau, M., Emsellem, E., Bacon, R., Marcella Carollo, C., Copin, Y., Davies, Roger L., Kuntschner, H., Miller, Bryan W., Monnet, G., Peletier, Reynier F., Verolme, E. K., 2002, MNRAS, 329, 513
- (32) de Zeeuw, P. T., Franx, M., 1991, ARA&A 29, 239