Primordial Stellar Populations
Abstract
We review the expected properties of the first stellar generations in the Universe. In particular, we consider and discuss the diagnostics, based on the emission from associated HII regions, that permit one to discern bona fide primeval stellar generations from the ones formed after pollution by supernova explosions has occurred. We argue that a proper characterization of truly primeval stellar generations has to be based on spectra that show simultaneously (a) the presence of high intensities and equivalent widths of Hydrogen and Helium emission lines , such as Ly- and HeII 1640Å, and (b) the absence of collisionally excited metal lines, mostly from the first heavy elements to be synthetized in large quantities, i.e. C and O. These atomic species are expected to produce emission lines, such as CIII] 1909Å, OIII] 1666Å, [OIII] 5007Å, etc., with intensities above 10% the intensity of H already for metallicities as low as 0.001Z⊙. The expected performance of the NASA/ESA/CSA NGST for the study and the characterization of primordial sources is also discussed.
ESA/Space Telescope Science Institute, 3700 San Martin Drive, Baltimore, MD 21218
1. Introduction
The first generation of stars in the Universe marks the beginning of the evolution that eventually lead to the world as we know it. Before the formation of any star, the chemical composition is the one produced by the Big Bang, i.e. mostly Hydrogen (about 93% by number) and Helium (about 7% by number) and traces of other light elements, such as Deuterium, Lithium, etc. (e.g. Truran, this Conference). The stars of the first generation, the so-called “population III” stars, will reflect the lack of metals in having considerably higher effective temperatures than stars of equal mass but with appreciable quantities of heavy metals (see e.g. Castellani, Chieffi & Tornambè 1983, and many more; see Marigo et al. 2001 for extensive calculations and a thorough review). On this basis, Tumlinson, Giroux & Shull (2001) and Bromm, Kudritzki & Loeb (2001) have argued that the high temperatures of the most massive stars will produce HII regions in which part of the helium is twice ionized. From this, they predict intensities of the HeII 1640Å line so uniquely high (I(1640Å)/I(H)) that the detection of a strong HeII 1640Å line in the spectrum of a high redshift galaxy should constitute clear evidence for a primeval stellar generation. These predictions are heavily based on the assumption that primordial stars are all massive stars or, in other words, that a “top-heavy” Initial Mass Function (IMF) is appropriate for population III stars. Undoubtedly, it is intuitive that the absence of metals makes the temperature in primordial star forming clouds higher than it is in the local Universe, so that the Jeans mass is higher and the formation of high mass stars should be highly favored while the formation of low mass stars is expected to be greatly reduced or completely inhibited. On the other hand, the discovery of Milky Way halo stars with metallicities as low as (e.g. Depagne et al. 2002, and references therein) casts disturbing doubts about the general validity of a top-heavy IMF in the early Universe.
Another possible problem is that the phase of “primordial” abundance may be so short that the probability of catching any proto-galaxy in that phase could be exceedingly low. In fact, in a short time after the very beginning of star formation (about 3 million years after the birth of the first massive stars in the Universe) supernova explosions will start polluting the environment and the conditions will suddenly change.
It is then clear that identifying and characterizing the properties of the second generation of stars, i.e. stars formed in the metal enriched environment just after the first episode of SN pollution, is at least as important as identifying the truly primeval stellar population.
In the following section we will show that a proper characterization of truly primeval stellar generations has to be based on the simultaneous presence of high intensities and equivalent widths of suitable lines of Hydrogen and Helium, such as Ly- and HeII 1640Å (and/or their rest-frame optical counterparts, H and HeII 4686Å), and the absence of collisionally excited metal lines, mostly from the first heavy elements to be synthetized in large quantities, i.e. C and O, which are expected to have lines such CIII] 1909Å, OIII] 1666Å, [OIII] 5007Å, it etc., with intensities above 10% the intensity of the H line already for metallicities as low as solar.
2. Primordial Stars: Expected Properties
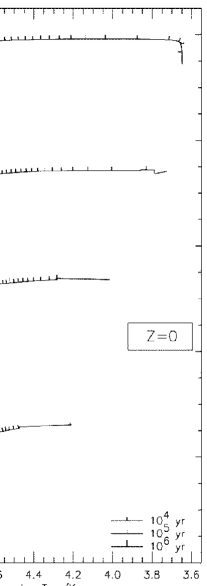
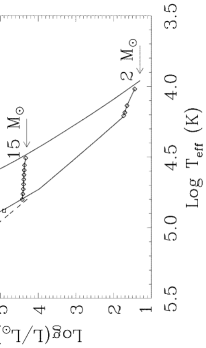
As mentioned before, the current paradigm is that at zero metallicity the Jeans mass in star forming clouds is much higher than it is in the local Universe, and, therefore, the formation of massive stars, say, 100 M⊙ or higher, is highly favored (c.f. Figure 1). The spectral distributions (SED) of these massive stars are characterized by effective temperatures on the Main Sequence (MS) around K (Tumlinson & Shull 2000, Bromm et al. 2001, Marigo et al. 2001). Due to their temperatures these stars are very effective in ionizing hydrogen and helium. It should be noted that zero-metallicity stars of all masses are expected to have essentially the same MS luminosities as, but to be much hotter than their solar metallicity analogues (Tumlinson & Shull 2000, Bromm et al. 2001, Marigo et al. 2001; see e.g. Fig. 2). Note also that only stars hotter than about 90,000 K are capable of ionizing He twice in appreciable quantities, say, more than about 10% of the total He content (e.g. Oliva & Panagia 1983, Tumlinson & Shull 2000). As a consequence even the most massive population III stars can produce HeII lines only for a relatively small fraction of their lifetimes, say, about 1 Myr or about 1/3 of their lifetimes (Baraffe, Heger & Woosley 2001; c.f. Fig. 1).
The second generation of stars forming out of pre-enriched material will probably have different properties because cooling by metal lines may become a viable mechanism and stars of lower masses may be produced (Bromm et al. 2001). On the other hand, if the metallicity is lower than about Z⊙, build up of H2 due to self-shielding may occur, thus continuing the formation of very massive stars (Oh & Haiman 2002).
Thus, it appears that in the zero-metallicity case one may expect a very top-heavy Initial Mass Function (IMF). It is less clear whether the second generation of stars is also top-heavy or characterized by a more normal IMF. We will discuss both possibilities.
Population III objects are characterized by nucleosynthetic patterns different from those produced by ordinary stars (Heger & Woosley 2002, Oh et al. 2001). In principle, such patterns could be identified by studying low metallicity objects at low redshifts.
3. Primordial HII Regions
Given the high effective temperatures of zero-metallicity stars we can expect high ionizing photon fluxes for both hydrogen and helium. By the same token, we also expect low optical and UV fluxes. This is because the optical/UV domains fall in the Rayleigh-Jeans tail of the spectrum where the flux is proportional to the first power of the effective temperature, , so that, for equal bolometric luminosity, the actual flux scales like . Therefore, an average increase of effective temperature of a factor of will give a reduction of the optical/UV flux by a factor of . As a result, one should expect the rest-frame optical/UV spectrum of a primordial HII regions to be largely dominated by its nebular emission (both continuum and lines).
More quantitatively, we have computed an extensive grid of models to study the detailed properties of primordial HII regions (Panagia et al. 2002). The calculations were made using Cloudy90 (Ferland et al. 1998),and exploring a wide range of densities (1–106 cm-3), metallicities (10-6–3 Z⊙), and effective temperatures (30,000–150,000 K). For the SED of the ionizing stars we considered both model atmospheres, as provided by Cloudy90 database and black body distributions. We have also considered the cases of both groups of identical stars and clusters of MS stars with a Salpeter IMF. Although a variety of relative elemental abundances were investigated, in most models we varied the metallicity by simply scaling all metal abundances by one and the same factor, relative to the solar abundances as listed in the Cloudy90 manual. The main results of our model calculations for the case of zero metallicity are:
-
•
The electron temperature is much higher than in galactic HII regions, in excess of 20,000 K in all cases. This is because both the average energy of the ionizing photons is considerably higher (by about 3-4 eV), and most of the cooling is provided by collisional excitation of hydrogen levels, whose lowest excitation potential is about 10.2 eV.
-
•
As a corollary the intensities of all hydrogen lines are enhanced relative to the classical Baker & Menzel (1938) case B recombination regime. In particular, thanks to collisional excitation, the Ly- line is about twice as predicted from recombinations alone, and its luminosity may amount to as much as 46% of the total luminosity of the ionizing star(s). Similarly, the H to H intensity ratio goes to about 3.2, i.e. about 10% higher than the standard case B ratio.
-
•
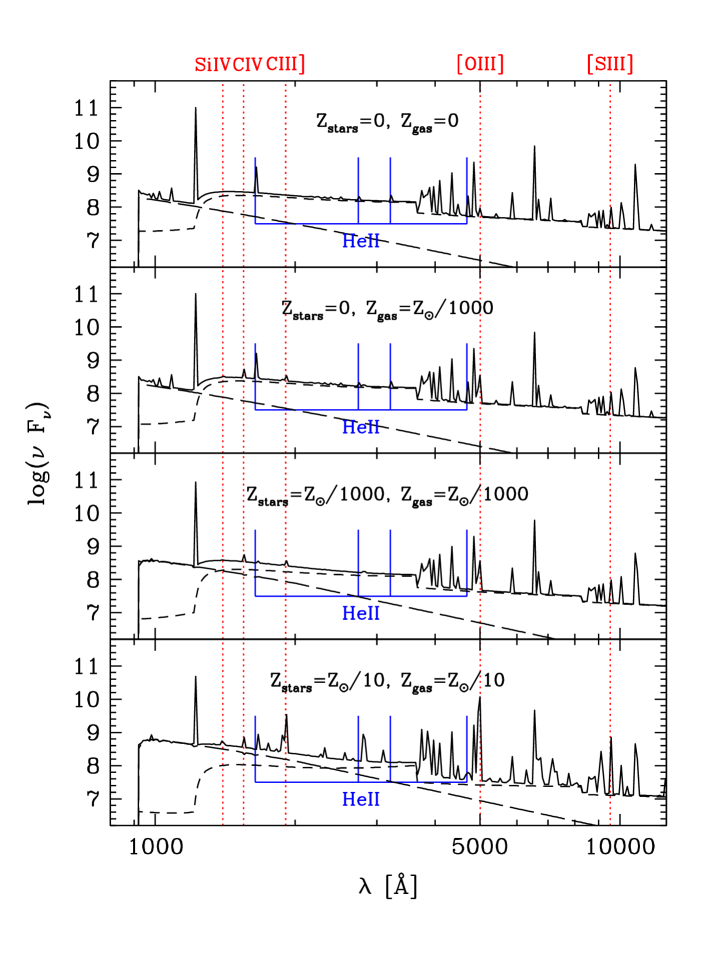
As anticipated, the continuous emission is largely dominated by the nebular continuum at all wavelengths longer than Ly-. As a consequence, the resulting SED is much flatter than the stellar one, and is also appreciably flatter than that of solar abundance HII regions (c.f. Fig. 3). This effect results both from the higher electron temperature that makes the and spectra considerably flatter, and from the collisional excitation of the level of hydrogen, whose decay produces the well known two-photon emission that extends from 0 energy up to E(Ly-) and dominates the nebular emission between 1216Å and, say, 5000Å, at least.
-
•
Helium is mostly once ionized but, as long as the effective temperature of the ionizing stars is above 90,000 K, emission lines of HeII can also be detected. In particular, for 100,000 K, the fraction of twice ionized He is 29% for a model atmosphere SED and 10% for a black body SED. Correspondingly, the intensities of the HeII lines at 1640Å and 4686Å are about 1.26 and 0.16 (for model atmospheres), and 0.62 and 0.078 (for black bodies) the intensity of the H line, respectively.
-
•
There are no metal lines, of course.
-
•
There is no dust absorption of any kind, but both the higher H to H intensity ratios and the flatter rest-frame UV continuum mimick the effects of dust extinction at a level equivalent to E(B-V)0.1 if a Milky Way average extinction law is adopted. This, in turn, may (incorrectly) be taken as evidence for a substantial metallicity, up to 0.1Z⊙, in these primordial regions.

4. Low Metallicity HII Regions
As soon as the first massive star reaches the end of its lifetime (about 3 Myrs; c.f. Baraffe et al. 2001, Marigo et al. 2001) and explodes as a core collapse (type II) supernova (SNII), its environment is polluted and may show the effects of the ensuing metal enrichment. It is important to realize that a few SN explosions are more than enough to pollute a big cloud appreciably. For instance, if we assume that, similarly to local Universe SNII, a primordial SNII explosion ejects about 10 M⊙ of metals with a total kinetic energy of few 1051ergs, it is easy to verify that the ejecta will be stopped (actually, thermalized) in about 1 Myr after sweeping, and mixing with about 106 M⊙ of gas of the parent cloud. This corresponds to an average metallicity of /2000. Therefore, we can expect that eventually, when all massive stars of the first generation have gone SNII, even a cloud with as much as 107 M⊙ in gas will be polluted to a level of about 10-3Z⊙. Interestingly enough, this is the same level of metal enrichment as expected for the Universe at the epoch of re-ionization (e.g. Miralda-Escudé & Rees 1998). While a little confusing (which is which? which is first?) this fact simplifies the job of recognizing “pristine” stars and clouds: whatever is above the limit of 10-3Z⊙ is the product of one or more episodes of metal enrichment.
The properties of HII regions with various amounts of metal enrichment can be inferred from Figures 3-6. In particular, Figure 3, illustrates four different scenarios (top to bottom): (1) both stars and gas are metal free, (2) the stars are primordial but the gas is already enriched to 10-3Z⊙, (3) both stars and gas have a metallicity of 10-3Z⊙, and (4) the metallicity of both stars and gas is 0.1Z⊙, similar to the SMC metallicity. We see that, as long as primordial massive stars dominate the ionization ((1) and (2)), HeII emission lines are present (e.g. 1640Å, 4686Å), but as soon as the gas metallicity goes up ((2)) also metal lines become detectable, e.g. [OIII] 5007Å which is the strongest metal line in the spectrum and whose intensity is about 10% of that of the H line for a 10-3Z⊙ metallicity. When the metal content in the stars increases (case (3)), their effective temperatures are not high enough to ionize He twice and, therefore, one finds weak, but detectable, metal lines while HeII emission lines have disappeared. Finally, for high metallicities the emission line spectrum is dominated by metal lines, as customarily found in local Universe HII regions and Planetary Nebulae.
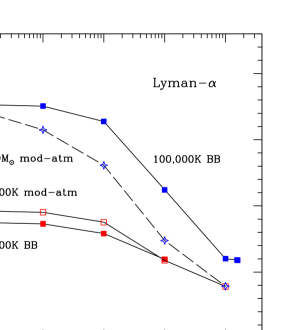
More in detail, we note that both the luminosity and the equivalent width of the Ly- line increase monotonically with decreasing metallicity (c.f. Figures 4 and 5). In particular, we note that equivalent widths in excess of 1,000Å are possible already for objects with metallicity . This is particularly interesting given that Ly- emitters with large EW have been identified at z=5.6 (Rhoads & Malhotra 2001).
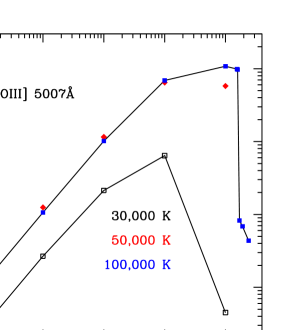
Even though the metal lines at low metallicities are weak, some of them can be used as metallicity tracers. In Figure 6 the intensity ratio of [OIII] to H is plotted for a range of stellar temperatures and metallicities. It is immediately apparent that for this line ratio traces metallicity linearly. Our reference value corresponds to an intensity ratio I([OIII])/I(H) 0.1. The weak dependence on the effective temperature makes sure that this ratio remains a good indicator of metallicity not only for populations with a top-heavy IMF but also in the more general case of sources with a wide range of stellar masses. And indeed these predictions match quite well the observational results found for blue dwarf galaxies (Izotov & Thuan 1998, and references therein; Panagia et al. 2002).
Another difference between zero-metallicity and low-metallicity HII regions is that the latter may contain dust, which could absorb part of the stellar and nebular radiation and re-emit it in the far infrared. For example, assuming that dust formation processes work equally well at all metallicities, and, therefore, that the dust content of a region is proportional to its metallicity, the dust optical depth in a 106 M⊙ cloud with is expected be at the Ly- wavelength and in the visual. As a consequence, while only about 2% of the stellar and non-resonant nebular radiation is absorbed, as much as 30% of the Ly- line is likely to be absorbed (e.g. Panagia & Ranieri 1973). Since the Ly- luminosity is about 40% of the total luminosity of the system, as much as 10-15% ot the total energy will be absorbed by dust and re-emitted in the far IR (Panagia et al. 2002).
5. Finding and characterizing Primordial HII Regions
From an observational point of view one cannot measure a zero-metallicity but one will usually be able to place an upper limit to it. When is such an upper limit uniquely indicative of a population III object? In the previous sections we argue that a metallicity Z can be used as a dividing line between the pre and post re-ionization phase of the Universe, and that essentially the same value results from pollution by SNII explosions in a primordial cloud (see also Panagia et al. 2002). Thus, any object with a metallicity higher than is not a true first generation object. Also, we have seen which type of diagnostics we have to characterize primordial and low-metallicity HII regions.
Now next question is: can we do it? do we have the means to detect primordial sources and verify that they are indeed pristine?
In this section we will focus on the capabilities of the NASA/ESA/CSA Next Generation Space Telescope (NGST) that, thanks to its large aperture (6m class) and very low background (space-borne, passively cooled to less than 50 K), is our best bet for success.
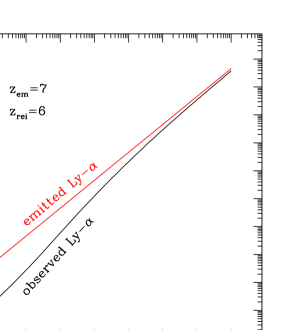
Before proceeding further, we have to consider the effects of intergalactic HI absorption, i.e. the well known Gunn-Peterson effect (Gunn & Peterson 1965): all radiation shortward of the Ly- wavelength, as well as in the damping wing extending up to several thousand km s-1 longward of it, is suppressed if IGM hydrogen is mostly neutral. This could be a serious problem because the Ly- line alone carries as much as 40-45% of the total energy and, by being concentrated in a narrow wavelength range, typically Å, is easily detectable (c.f. Figures 3 and 9). Fortunately, part of the same radiation that ionizes the HII region can also leak out and ionize the surrounding region of the IGM. This may sound like a contrived ad hoc hypothesis but an HII configuration that is density bounded in some directions and ionization bounded in others is quite common in nature, as well demonstrated by many galactic HII regions, such as M42 (the Orion Nebula) or M8 (the Lagoon Nebula), etc. It follows that for any given leakage fraction, the higher is the ionizing photon flux of the source, the bigger is the ionized sphere of IGM gas, and, because of cosmic expansion, the damping wing of the IGM HI trough shifts to more amd more negative velocities, thus reducing the absorption on the Lyman emission profile (Miralda-Escudé & Rees 1998, Madau & Rees 2001, Panagia et al. 2002). A comparison of the observed vs emitted Ly- intensities is given in Figure 7. The transmitted Ly- flux depends on the total luminosity of the source since this determines the radius of the resulting Strömgren sphere. A Ly- luminosity of L⊙ corresponds to M⊙ in massive stars. In the following we will consider a star cluster of this luminosity as our reference case.
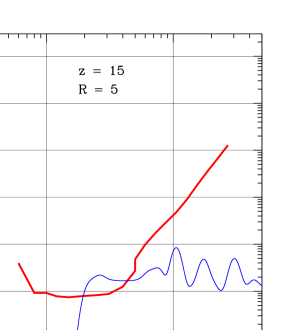
Now, if we convolve the synthetic spectra derived above, including the appropriate effect of neutral IGM absorption, with a broad band filter response we obtain a spectral energy distribution that can be compared directly to the NGST imaging sensitivity. Figure 8 shows the comparison of the flux from a M⊙ starburst at z=15, convolved with a bandwidth of , with the expected limiting flux that a 6m NGST can reach in an exposure of s with a S/N=10. It is clear that NGST will be able to easily detect such objects over the range 2–4 .
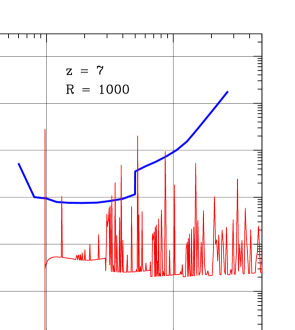
The synthetic spectra can also be compared to the NGST spectroscopic sensitivity for s exposures (see Figure 9): it appears that while the Ly- line can be detected up to redshifts as high as 15 or 20, for our reference source only at relatively low redshifts (z), can NGST detect other diagnostics lines lines such as HeII 1640Å, and Balmer lines. Determining metallicities is then limited to either lower redshifts or to brighter sources. Note that a “bright” source may be a more massive source but may also be a gravitationally lensed object, of the type discovered by Ellis et al. (2002) at redshift .
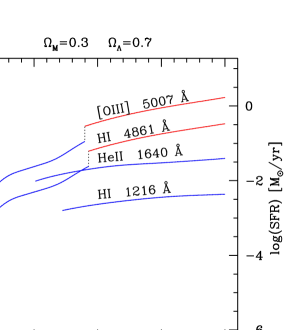
We can reverse the argument and ask ourselves what kind of sources can NGST detect and characterize with spectroscopic observations. Figure 10 displays, as a function of redshift, the total luminosity of a starburst that is required for a S/N=10 measurement of a given line with an exposure time of s. The loci for Ly-, HeII 1640Å, H, and [OIII] 5007Å are shown. It appears that Ly- is readily detectable up to z20 even for sources 10 fainter than our reference case, HeII 1640Å can also be detected up to high redshifts if massive stars are indeed as hot as predicted, whereas “metallicity” information, i.e. the intensity ratio I([OIII])/I(H), can be obtained at high redshifts only for sources that either are 10–100 times more massive or are 10–100 times magnified by gravitational lensing.
6. Conclusions
It is possible to discern truly primordial populations from the next generation of stars by measuring the metallicity of high-z star forming objects. The very low background of NGST will enable it to image first-light sources at very high redshifts, identifying them through the Lyman break technique and/or spectroscopic detection of the Ly-, and possibly HeII 1640Å emission. The relatively small collecting area of a 6m NGST limits its capability in obtaining spectra of z10–15 first-light sources to either the bright end of their luminosity function or to strongly lensed sources.
References
Baker, J.G., & Menzel, D.H. 1938, ApJ 88, 52
Baraffe, I., Heger, A., & Woosley, S.E. 2001, ApJ, 550, 890
Bromm, V., Ferrara, A., Coppi, P.S., & Larson, R.B. 2001, MNRAS, 328,969
Bromm, V., Kudritzki, R.P., & Loeb, A. 2001, ApJ, 552, 464
Castellani, V., Chieffi, A., & Tornambè, A. 1983, ApJ, 272, 249
Depagne, E., Hill, V., Spite, M., Spite, F., Plez, B., Beers, T.C., Barbuy, B., & Cayrel, R., Andersen, J., Bonifacio, P., Fran ois, P., Nordström, B., & Primas, F. 2002, A&A 390, 187
Ellis, R., Santos, M.R., Kneib, J.-P., & Kuijken, K. 2001, ApJ, 560, L119
Ferland, G.J., Korista, K.T., Verner, D.A., Ferguson, J.W., Kingdon, J.B., & Verner E.M. 1998, PASP, 110, 761
Gunn, J.E., & Peterson, B.A. 1965, ApJ, 142, 1633
Heger, A., & Woosley, S.E. 2002, ApJ, 567, 532
Izotov, Y.I., & Thuan, T.X. 1998, ApJ, 500, 188
Madau, P., & Rees, M.J. 2001, ApJ, 551, L27
Marigo, P., Girardi, L., Chiosi, C., & Wood, P.R. 2001, A&A 371, 252
Miralda-Escudé, J., & Rees, M.J. 1998, ApJ, 497, 21
Oh, S.P., & Haiman, Z. 2002, ApJ, 569, 558
Oh, S.P., K.M. Nollett, K.M., Madau, P., & Wasserburg, G.J. 2001, ApJ, 562,L1
Oliva, E., & Panagia, N. 1983, Ap&SS, 94, 437
Panagia, N. & Ranieri, M. 1973, Mem. Soc. Roy. Sci. Liège, 6 serie, tome V, p. 275
Panagia, N., Stiavelli, M., Ferguson, H.C., & Stockman, H.S. 2002, in preparation
Rhoads, J.E., & Malhotra, S. 2001, ApJ, 563, L5
Tumlinson, J., & Shull, J.M. 2000, ApJ, 528, L65
Tumlinson, J., Giroux, M.L., & Shull, J.M. 2001, ApJ, 550, L1