The puzzlingly small CaII triplet absorption in elliptical galaxies
Abstract
We measure the central values (within ) of the CaII triplet line indices CaT∗ and CaT and the Paschen index PaT at 8600 Å for a 93%-complete sample of 75 nearby early-type galaxies with and . We find that the values of CaT∗ are constant to within 5% over the range of central velocity dispersions km/s, while the PaT (and CaT) values are mildly anti-correlated with . Using simple and composite stellar population models, we show that: a) The measured CaT∗ and CaT are lower than expected from simple stellar population models (SSPs) with Salpeter initial mass functions (IMFs) and with metallicities and ages derived from optical Lick (Fe, Mg and H) indices. Uncertainties in the calibration, the fitting functions and the SSP modeling taken separately cannot explain the discrepancy. On the average, the observed PaT values are within the range allowed by the models and the large uncertainties in the fitting functions. b) The steepening of the IMF at low masses required to lower the CaT∗ and CaT indices to the observed values is incompatible with the measured FeH index at 9916 Å and the dynamical mass-to-light ratios of ellipticals. c) Composite stellar populations with a low-metallicity component reduce the disagreement, but rather artificial metallicity distributions are needed. Another explanation may be that calcium is indeed underabundant in ellipticals.
1 Introduction
The determination of the mean ages and metallicities of local elliptical galaxies is one of the key observational tests of models for galaxy formation and evolution. The classical picture of monolithic collapse (Larson 1974) assumes high formation redshifts and passive evolution, producing large central metallicities with strong gradients. In contrast, semi-analytic models of galaxy formation embedded in the hierarchical structure formation typical of Cold Dark Matter universes (Kauffmann, 1996), produce elliptical galaxies through mergers of disks and predict a large spread in the formation ages (especially for field ellipticals), with solar mean metallicities and shallow gradients. Although many indications support the merging scenario, a clear-cut answer from the observations has been hampered by the age-metallicity degeneracy in the spectra of (simple) stellar populations: the same broad-band colors and absorption features can be obtained for very different combinations of ages and metallicities. The combined use of indices more sensitive to age (like the Balmer lines) and those more sensitive to metallicity (like Mg2 and Fe5270 and Fe5335) offers a way out (Worthey 1994). However ambiguities remain, because the presence of a small metal-poor old stellar population may bias the age estimate (Maraston & Thomas, 2000, MT), and the metallicity estimate based on the Mg indices are systematically higher than the ones using iron lines (the so-called Mg over Fe over-abundance problem; Worthey, Faber & González, 1992, Trager et al. 2000, Thomas, Maraston & Bender 2002, TMB). Recent modeling of the CaII triplet line at 8600Å (Idiart, Thévenin & De Freitas Pacheco 1997, I97; García-Vargas, Molla & Bressan 1998; Mollá & García-Vargas, 2000) concluded that this index is insensitive to age for populations older than 1 Gyr, raising hopes that it could allow a robust measure of metallicity, and, in combination with colors or indices, age. An excellent review of the literature on the subject can be found in Cenarro et al. (2001a, C01).
Here we present the results of our survey of the CaII triplet line in local elliptical galaxies in the light of the new definition of the index given by C01 and their accurate determination of its stellar calibrators (the so called fitting functions, FF, Cenarro et al. 2001b, Cenarro et al. 2002, C02). In §2 we describe the observations and the data reduction, in §3 we present the data, discuss them with new stellar population models and draw our conclusions.
2 Observations and data reduction
We observed the CaII triplet region at 8600 Å along the major axis of 94 early-type ellipticals from the Faber et al. (1989) catalog (hereafter F89). The results presented in this paper are based on the subsample with mag and km/s, where we observed 75 galaxies, reaching 93% completeness. At km/s the reddest window of the indices considered here moves into a region of strong sky emission lines, making the measurements sensitive to sky subtraction errors.
The observations were performed at the 3.5m Calar Alto in February and April 2001, the La Silla ESO NTT in May and November 2001, and the Siding Spring 2.3m telescope in May and October 2001 and January 2002, with instrumental resolution ranging from 70 to 80 km/s. Details will be presented in Saglia et al. (in preparation). Typically, two spectra along the major axis of the galaxy were obtained with summed exposure times ranging between 1 and 3 h. Template stars used in the determinations of the fitting functions of C01 were also observed, trailed along the slit. The standard CCD data reduction was carried out under the image processing package MIDAS provided by ESO. A detailed description of the procedure can be found in Saglia et al. (in preparation). The wavelength calibration procedure achieved 0.1 Å rms precision. The systematic residuals after sky subtraction, estimated from the blank sky frames, are less than 1%.
The galaxy kinematics were derived using the Fourier Correlation Quotient (FCQ) method (Bender 1990) following Bender, Saglia and Gerhard (1994). The line indices were measured following the prescriptions of C01 for the computation of the newly defined “generic” indices CaT, PaT, and CaTCaT-0.93PaT. In summary, generic indices have an arbitrary number of continuum and spectral features bandpasses and the pseudo-continuum is derived by using an error-weighted least-squares fit to all the pixels of the continuum bands. The CaT index measures the combined strength of the Ca1, Ca2 and Ca3 lines similar to Diaz, Terlevich & Terlevich (1989) and I97, and has a possible contribution for the Paschen lines P16, P15 and P13. The PaT index measures the combined strength of the Paschen lines P17, P14 and P12. The CaT∗ measures the strength of the CaII triplet corrected for the contamination from Paschen lines. At our resolution (see below) we found no significant difference in the measurements, if the flux calibration (performed by C01) was applied or not.
The statistical errors were derived from Monte Carlo simulations, which also take into account the uncertainties from the kinematics through the redshift and the broadening correction. The errors from systematics in the sky subtraction (in general at the 1% level, see above) were found to dominate in the outer parts of the galaxies. The procedure described in Mehlert et al. (1998) was followed to achieve a uniform focus with wavelength, when necessary. A correction for the broadening of the lines due to the internal kinematics of the galaxies was applied to scale the indices to the instrumental resolution, using a K-type stellar template. As discussed by C01, this correction is spectral type dependent and therefore somewhat uncertain; it is small (%) for the CaT and CaT∗ indices, but as large as 20% at km/s for the PaT index. The uncertainties in the correction are Å. Finally, since the C01 system is based on stellar spectra taken with 22 km/s resolution, nearly a factor 4 higher than the present observations, the dataset was calibrated on this system by comparing the values of the indices for the template stars in common and applying linear corrections to the CaT and PaT indices. Central values of the velocity dispersion and of the indices were derived by averaging the profiles within (with taken from F89), luminosity-weighting the datapoints. The typical statistical errors on the central indices are smaller than 0.1 Å. The rms of the differences of the central values of the galaxy repeats is 0.2 Å, having applied a 0.3 Å correction to one of the runs.
3 Results and Discussion
Fig. 1 shows the relation between the CaT∗, PaT and CaT indices as a function of the central velocity dispersion. As already noted by Cohen (1979), Faber and French (1980) and Terlevich, Diaz & Terlevich (1990), elliptical galaxies have very similar central values of Calcium triplet index. Averaged over the galaxy sample, the CaT∗ has a mean of 6.93Å and rms 0.33 Å, or %, just above the measurement errors (statistical, systematic and due to calibration). Within the derived errors, the CaT∗ index does not depend on , while a mild anticorrelation is observed for both PaT and CaT, driven by the slightly larger PaT at lower sigmas. This contrasts with the behaviour of the Mg2 and Mg line indices, known to correlate strongly with in elliptical galaxies (Bender, Burstein & Faber 1993, Colless et al. 1999). These indices trace the -element magnesium (Tripicco & Bell 1995, Maraston et al. 2002), and if the CaII triplet indices were to trace the calcium abundance, also an -element, a correlation with could have been expected.
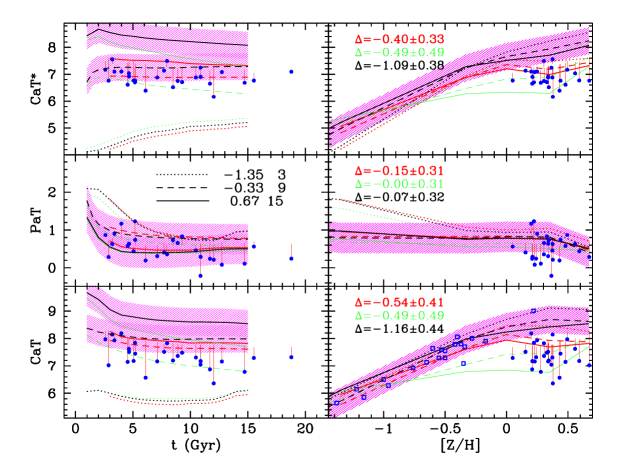
Fig. 2 shows stellar population models of the CaT∗, PaT and CaT indices constructed using the FF subroutines of C02 and the updated code of Maraston (1998, M98). A detailed description of the models considered here will be given in Maraston et al. (in preparation). The black lines show simple stellar population (SSP) models with the Salpeter IMF as a function of age and metallicity. These models reproduce well the tight metallicity-CaT correlation observed for globular clusters (open blue squares, from Armandroff and Zinn 1988, transformed using the relation given by C01, [Z/H] from Harris 1996). At metallicities higher than solar the models flatten and the age dependence becomes more important. The PaT index varies strongly with age for ages less than a few Gyr. It reaches a value of Å at high ages. Note, however, the large rms uncertainties of the FFs ( Å).
The blue filled circles show the subsample of the database investigated here where ages and metallicity estimates are available from the analysis of the Fe, Mg and H Lick indices (TMB). The results discussed in the following do not change if the set of ages and metallicities of Terlevich & Forbes (2002) are used instead. The same applies to the effects of errors on the age, metallicity and index, explored using Monte Carlo simulations. Within the large uncertainties allowed by the FFs, the models reproduce the average value of the measured PaT indices.
In contrast, the models predict values of CaT∗ and CaT more than 1 Å larger than the measured ones. Such a large discrepancy cannot be explained by calibration errors, which are at least a factor 5 smaller. Uncertainties in the FFs (rmsÅ) alone seem also unable to explain it, although at high metallicities ([Z/H]) the FFs are based on only a handful of stars. The CaT∗ of a high Z SSP is dominated by the contribution of the RGB and the red clump (RC). If we set artificially the value of the CaT∗ FF at [Z/H] from the giant branch phase on to 8 Å (the lowest value measured for stars in this phase, most of the stars have CaT Å), we obtain CaT Å for the SSP, still 0.5 Å larger than what observed in ellipticals. The flux contribution of the RC can vary within %, due to the uncertainties on the lifetime of this phase (Zoccali et al. 2000a). If we reduce the flux of the RC by this amount, we again obtain CaT Å for the SSP. Only a 50% reduction would produce CaT Å.
The SSP Salpeter models translate the averaged observed value of the CaT∗ into [Z/H], or Z= Z⊙. Taking this result at face value, if the CaT∗ traces the calcium abundance, this could indicate that this element is underabundant, a suggestion already put forward by Peletier et al. (1999) considering 3 ellipticals. A similar effect has been suggested by McWilliam and Rich (1994) and Rich and McWilliam (2000), who analyse a sample of metal rich bulge stars, suggesting that while Mg and Ti are overabundant with respect to Fe, Ca and Si have nearly solar ratios. In addition, modeling the Ca4227 Lick index TMB find [Ca/Mg] in ellipticals (see also Vazdekis et al. 1997). However, the issue of Ca underabundance in high-metallicity stars is still controversial (McWilliam 1997); C02 point out that the CaT index does not correlate with the [Ca/Fe] stellar overabundance; and current modeling of the yields of Type II supernovae (Woosley & Weaver 1995) does not allow much room in this direction. While Mg (and O) are produced in the greatest quantities in high mass stars (), lower mass stars () are responsible for the production of Ca (and Si). An IMF biased to the high masses or extremely short ( yr) star-formation bursts that avoid the Ca enrichment at high metallicities, as discussed by Mólla and Garcıa-Vargas (2000), do not seem a very appealing solution.
An alternative explanation of the low value of the CaT∗ index could be a steeper IMF at low stellar masses, since the CaT∗ index decreases with increasing gravity for cool stars. The green lines of Fig. 2 show SSP models with IMF slope for and (Salpeter) at larger masses. The CaT∗ and CaT indices at the high metallicities have a stronger dependence on age and are indeed able to reproduce the measured values of ellipticals. However, the observational evidence points to an IMF flatter than Salpeter in the bulge of our Galaxy (Zoccali et al. 2000b). In addition, as already discussed by Carter, Visvanathan and Pickles (1986) and Couture and Hardy (1993), such dwarf-dominated models produce values of the FeH feature at 9916 Å that are an order of magnitude larger than what is observed. Moreover, the visual mass-to-light ratios (at t=10 Gyr, Z=Z⊙, one gets , M98) are incompatible with dynamical estimates (Gerhard et al. 2001, ).
Since at low metallicity the CaT∗ and CaT indices depend strongly on Z (see Fig. 2), Composite Stellar Populations (CSPs) with a low metallicity component are bound to produce (significantly) lower CaT∗ and CaT indices than SSPs with the same (high) mean metallicity, while leaving the PaT values essentially unchanged. The red lines of Fig. 2 explore this case, presenting CSPs where 90% of the mass is an SSP model and 10% is the [Z/H]=-2.25 SSP with the same age, as done in MT. They show that this admittedly rather artificial model is compatible with the UV constraints avaliable for ellipticals, generating at the same time higher values of the H index than SSPs of the same metallicity. The CSP models of Fig. 2 predict almost constant values of the CaT∗ and CaT indices for Z Z⊙. This stems from the increasing relative importance of the flux at 8600 Å of the low metallicity component with increasing metallicity of the main SSP component. It becomes largest at Z Z⊙, to decrease slightly at higher metallicities, where more flux is emitted at the near-infrared wavelengths (see M98). Models with broader metallicity distributions (for example, the closed-box one) smear out this effect, resulting in CaT∗ and CaT indices steadily increasing with metallicity. The CSP models match the upper third of the galaxy distribution, however on average they produce CaT∗ and CaT indices still Å larger than the observed ones. As discussed in MT, a low metallicity tail is expected in the projected line of sight metallicity distribution, if radial metallicity gradients are present. This is suggested by the analysis of the Lick indices (Davies, Sadler & Peletier 1993, Mehlert et al. 2000) and color gradients (Saglia et al. 2000). A “halo-like” low-metallicity population could also be in place, reminiscent of the bimodal (color) distributions observed in the globular cluster systems of many giant ellipticals (Larsen et al. 2001 and references therein). Finally, we note that CSP models with a young, metal-rich component, postulated to explain the observed high central H values of some ellipticals (De Jong & Davies 1997) do not help here, since at high metallicities the SSPs predict increasing values of the CaT∗ and CaT indices with decreasing ages.
To conclude, none of the discussed options alone seems able to explain the observed distribution of the calcium triplet values and a combination of them might be at work. In particular, it could be that Ca is in fact underabundant in elliptical galaxies.
References
- Armandroff & Zinn (1988) Armandroff, T.E., Zinn, R. 1988, AJ, 96, 92
- Bender (1990) Bender R. 1990, A&A, 229, 441
- Bender et al. (1993) Bender R., Burstein, D., Faber, S.M. 1993, ApJ, 411, 153
- Bender et al. (1994) Bender R., Saglia R.P., Gerhard O. 1994, MNRAS, 269, 785
- Carter et al. (1986) Carter, D., Visvanathan, N., Pickles, J. 1986, ApJ, 311, 637
- Cenarro et al. (2001a) Cenarro, A.J., Cardiel, N., Gorgas, J., Peletier, R.F., Vazdekis, A., Prada, F. 2001a, MNRAS, 326, 959 (C01)
- Cenarro et al. (2001b) Cenarro, A.J., Gorgas, J., Cardiel, N., Pedraz, S., Peletier, R.F., Vazdekis, A. 2001b, MNRAS, 326, 981
- Cenarro et al. (2002) Cenarro, A.J., Gorgas, J., Cardiel, N., Vazdekis, A., Peletier, R.F. 2002, MNRAS, 329, 863 (C02)
- Cohen (1979) Cohen, J.G. 1979, ApJ, 228, 405
- Colless et al. (2001) Colless, M., Burstein D., Davies R.L., McMahan R., Saglia R.P., Wegner G. 1999, MNRAS, 303, 813
- Couture & Hardy (1993) Couture, J., Hardy, E. 1993, ApJ, 406, 142
- Davies, Sadler & Peletier (1993) Davies, R.L., Sadler, E.M., Peletier, R. 1993, MNRAS, 262, 650
- De Jong & Davies (1997) De Jong, R.S., Davies, R.L. 1997, MNRAS, 285, L1
- Diaz et al. (1989) Dıaz, A.I., Terlevich, E., Terlevich, R. 1989, MNRAS, 239, 325
- Faber & French (1980) Faber, S.M., French, H.B. 1980, ApJ, 235, 405
- Faber et al. (1989) Faber S.M., Wegner G., Burstein D., Davies R.L., Davies R.L., Dressler A., Lynden-Bell D., Terlevich R. 1989, ApJS, 69, 763
- García-Vargas et al. (1998) García-Vargas, M.L., Mollá, M., Bressan, A. 1998, A&AS, 130, 513
- Gehrard et al. (2001) Gerhard, O., Kronawitter, A., Saglia, R.P., Bender, R. 2001, AJ, 121, 1936
- Harris (1996) Harris, W.E. 1996, AJ, 112, 1487
- Idiart et al. (1997) Idiart, T.P., Thévenin, F., De Freitas Pacheco, J.A. 1997, AJ, 113, 1066 (I97)
- Larsen et al. (2001) Larsen, S.S., Brodie, J.P., Huchra, J.P., Forbes, D.A., Grillmair, C.J. 2001, AJ, 121, 2974
- Larson (1974) Larson, R.B. 1974, MNRAS, 173, 671
- Kauffmann (1996) Kauffmann, G. 1996, MNRAS, 281, 487
- Maraston (1998) Maraston, C. 1998, MNRAS, 300, 872 (M98)
- Maraston& Thomas (2000) Maraston, C., Thomas, D. 2000, ApJ, 541, 126 (MT)
- Maraston et al. (2002) Maraston, C., Greggio, L., Renzini, A., Ortolani, A., Saglia, R.P., Puzia, T.H., Kissler-Patig, M. 2002, submitted to A&A
- McWilliam and Rich (1994) McWilliam, A., Rich, R.M. 1994, ApJS, 91, 749
- McWilliam (1997) McWilliam, A. 1997, ARA&A, 35, 503
- Mehlert et al. (1998) Mehlert, D., Saglia, R.P., Bender, R., Wegner, G. 1998, A&A, 332, 33
- Mehlert et al. (2000) Mehlert, D., Saglia, R.P., Bender, R., Wegner, G. 2000, A&AS, 141, 449
- Mollá & García-Vargas (2000) Mollá, M., García-Vargas, M.L. 2000, A&A, 359, 18
- Peletier et al. (1999) Peletier, R.F., Vazdekis, A., Arribas, S., del Burgo C., García-Lorenzo, B., Gutiérrez, C., Mediavilla, E., Prada, F. 1999, MNRAS, 310, 863
- Rich & McWilliam (2000) Rich, R.M., McWilliam, A. 2000, SPIE, 4005, 150
- Saglia et al. (2000) Saglia, R.P., Maraston, C., Greggio, L., Bender, R., Ziegler, Z. 2000, A&A, 360, 911
- Terlevich& Forbes (2002) Terlevich, E., Dıaz, A.I., Terlevich, R. 1990, MNRAS, 242, 271
- Terlevich& Forbes (2002) Terlevich, A., Forbes, D. 2002, MNRAS, 330, 547
- Thomas et al. (2002) Thomas, D., Maraston, C., Bender, R. 2002, submitted to MNRAS (TMB)
- Trager et al. (2000) Trager, S.C., Faber, S.M., Worthey, G., González, J.J. 2000, AJ, 120, 165
- Tripicco & Bell (1995) Tripicco, M.J., Bell, R.A. 1995, AJ, 110, 3035
- Vazdekis et al. (1997) Vazdekis, A., Peletier, R.F., Beckman, J.E., Casuso, E. 1997, ApJS, 111, 203
- Woosley & Weaver (1995) Woosley, S.E., Weaver, T.A. 1995, ApJS, 101, 181
- Worthey et al. (1992) Worthey, G., Faber, S.M., González, J.J. 1992, ApJ, 398, 69
- Worthey (1994) Worthey, G. 1994, ApJS, 95, 107
- Zoccali et al. (2000a) Zoccali, M., Cassisi, S., Bono, G., Piotto, G., Rich, R.M., Djorgovski, S.G. 2000a, ApJ, 538, 289
- Zoccali et al. (2000b) Zoccali, M., Cassisi, S., Frogel, J.A., Gould, A., Ortolani, S., Renzini, A., Rich, R.M., Stephens, A.W. 2000b, ApJ, 530, 418