XMM-Newton Measurements of the Elemental Abundances in the Intracluster Medium
Abstract
Based on XMM-Newton observations of a sample of galaxy clusters, we have measured the elemental abundances (mainly O, Si, S, and Fe) and their spatial distributions in the intracluster medium (ICM). In the outer region of the ICM, observations of the O:Si:S:Fe ratio are consistent with the solar value, suggesting that the metals in the ICM were produced by a mix of supernovae (SNe) Ia and II. On the other hand, around the cD galaxy, the O/Fe ratios are about half of the solar value because of a central excess of the Fe abundance. An increase of the relative contribution from SNe Ia in the cD galaxy to the metal production towards the center is the most likely explanation.
keywords:
Galaxies: clusters: general – Galaxies: abundances – X-rays: galaxies: clusters1 Introduction
Clusters of galaxies are filled with an X-ray emitting ICM. The ICM is not only a dominant baryon component in the nearby Universe but also contains comparable or much amount of heavy elements than those in galaxies. Therefore, the distribution and composition of metals in the ICM is essential for understanding the history of metals in galaxies and clusters.
Following early measurements, ASCA and BeppoSAX observations have revealed several important properties of the ICM metallicity. These include Fe abundance increases around cD galaxies (e.g. Fukazawa 1998; De Grandi and Molendi 2001) and variations in Si/Fe ratio within a cluster (e.g. Finoguenov et al. 2000) and among clusters (e.g. [\astronciteFukazawa et al.1998]). XMM-Newton observations with higher capability should improve the accuracy of the measurements. In particular, thanks to the high spectral resolution (RGS) and better sensitivity (EPIC) in the soft X-ray band, significant improvement of the O abundance determination is expected. The O abundance is crucial to understand the origin of the ICM metal since O is expected to be produced mostly by SNe II.
Early results from XMM-Newton of Sérsic 159-03, A 1835, A 1795, and A 496 were reported in Kaastra et al. (2001), Peterson et al. (2001), Tamura et al. (2001a) and [*]ttamura-B3:ta01b, respectively. Here we present new results of abundance measurements. Table 1 summaries our sample.
Note that most of our sample have a giant elliptical galaxy (cD galaxy) at the X-ray center. Around the galaxy, we often find metal-rich and cooler X-ray emission compared to the outer region of the cluster.
| (1) target | (2) z | (3) T | (4) |
|---|---|---|---|
| M87/Virgo | 0.0044 | 2.5 | BBK01, BSB01 |
| NGC 533 | 0.017 | 1.2 | a galaxy group. |
| A 262 | 0.016 | 2.2 | |
| Sérsic 159-03 | 0.056 | 2.5 | K01 |
| A 496 | 0.033 | 4.5 | T01b |
| Hyd-A | 0.054 | 4.0 | |
| A 1795 | 0.063 | 6 | T01a |
2 The EPIC results - The abundance of the ICM
We used the spatially-resolved EPIC spectra to measure the radial distribution of the ICM properties.
-
•
For each cluster, we extracted the spectra in several annuli around the emission center and fitted the MOS1, MOS2, and PN spectra simultaneously with a single temperature plasma (1T) model modified by photoelectric absorption.
-
•
In general, the single temperature model provides an acceptable fit to each spectrum. However, at the very center in some clusters (e.g. A 262), an additional cool component is suggested.
-
•
In most clusters, the temperature continuously decreases towards the center beyond a certain radius. On the other hand, the iron metallicity increase towards the center.
-
•
We confirmed that the MOS and PN provide values of the O, Si, S, and Fe abundances and temperature statistically consistent with each other. Based on this, we suppose that the uncertainty of the instrument responses affect insignificantly on the results.
-
•
New results of the fitting are shown in Table 2.
| (1) target | (2) | (3) | (4) T | (5) O | (6) Ne=Mg | (7) Si | (8) S | (9) Ar=Ca | (10) Fe | |
|---|---|---|---|---|---|---|---|---|---|---|
| Hyd-A | 48–128 | 3.6 | 3.5 | 0.31 | 0.47 | 0.33 | 0.37 | 0.32 | 0.33 | 527/468 |
| Hyd-A | 128–384 | 2.8 | 4.5 | 0.24 | 0.46 | 0.16 | 0.34 | 0 | 0.29 | 533/468 |
| A 262 | 128–384 | 7.9 | 2.2 | 0.32 | 0.16 | 0.44 | 0.40 | 0.45 | 0.37 | 503/468 |
| NGC 533 | 48–128 | 6.9 | 1.2 | 0.23 | 0 | 0.37 | 0.40 | 0.2 | 0.35 | 383/312 |
| () | () | () | () | () | () | () | () |
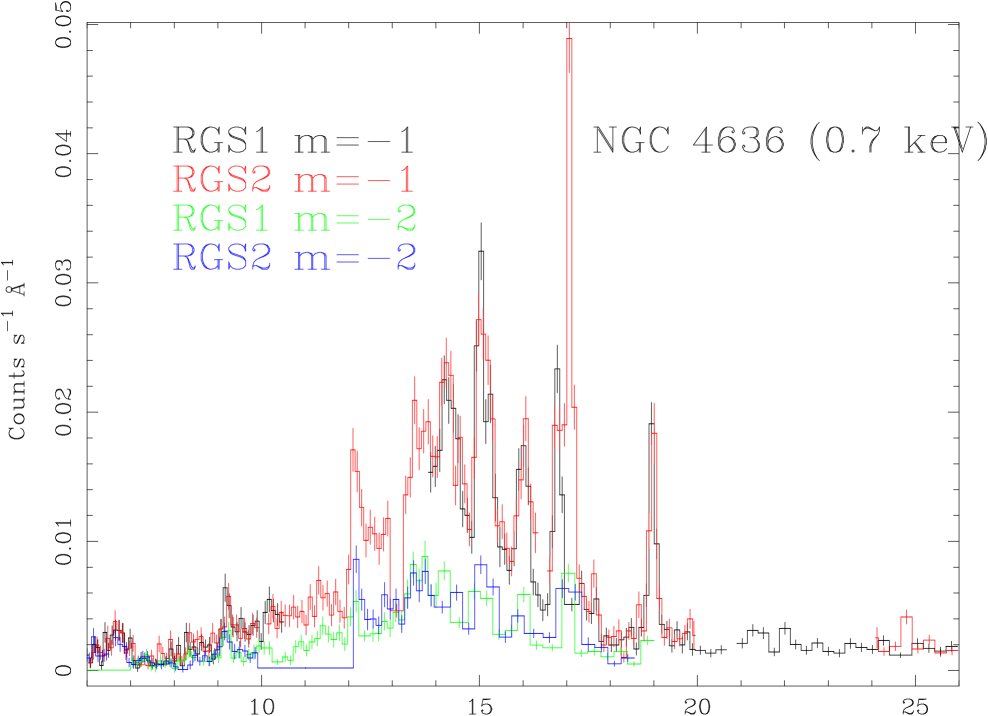
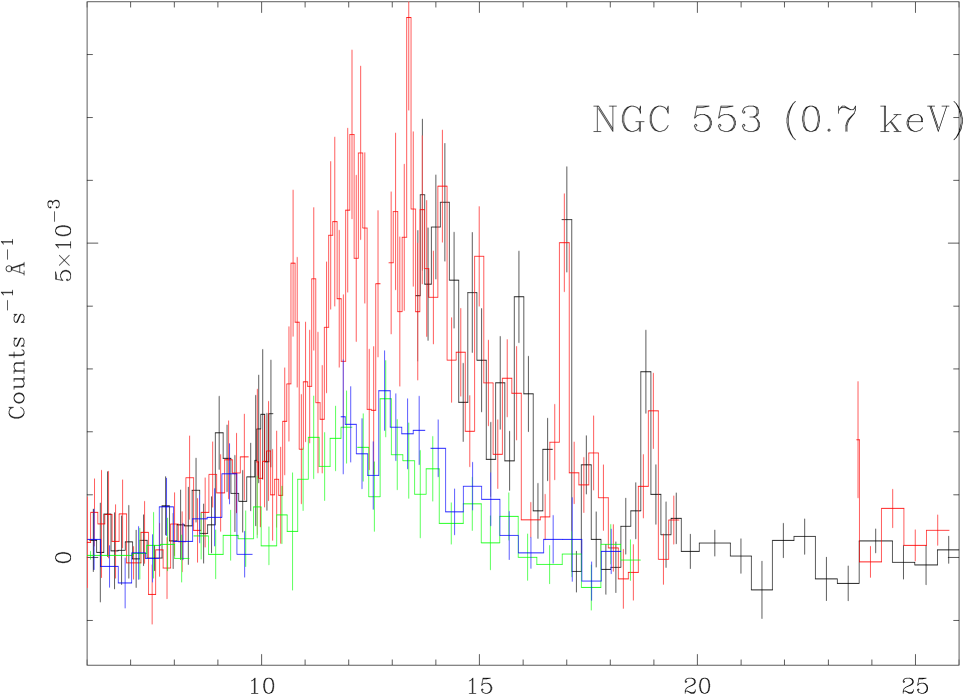
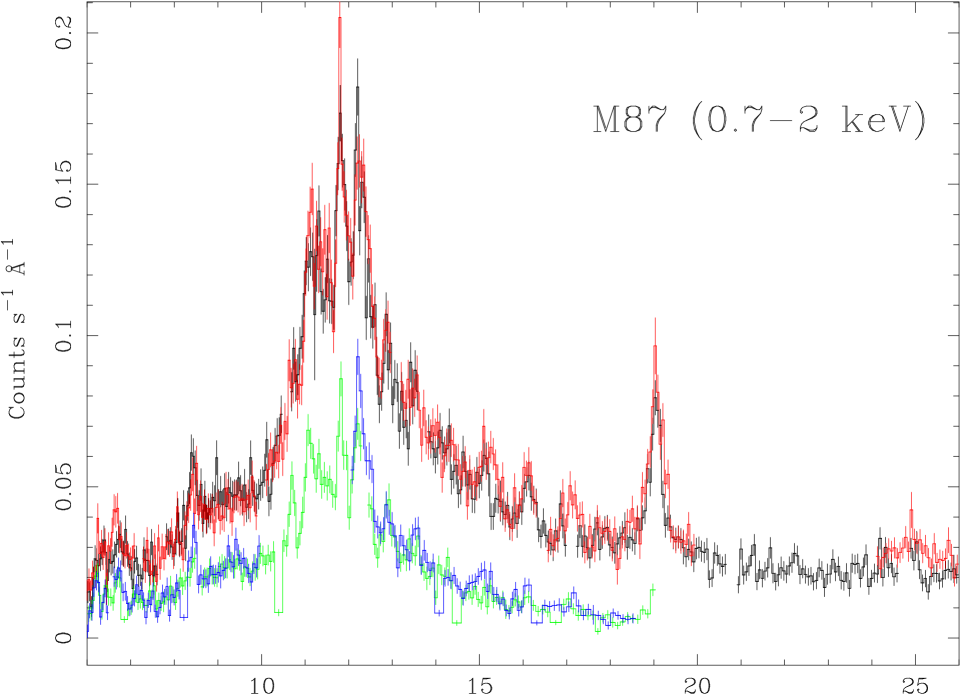
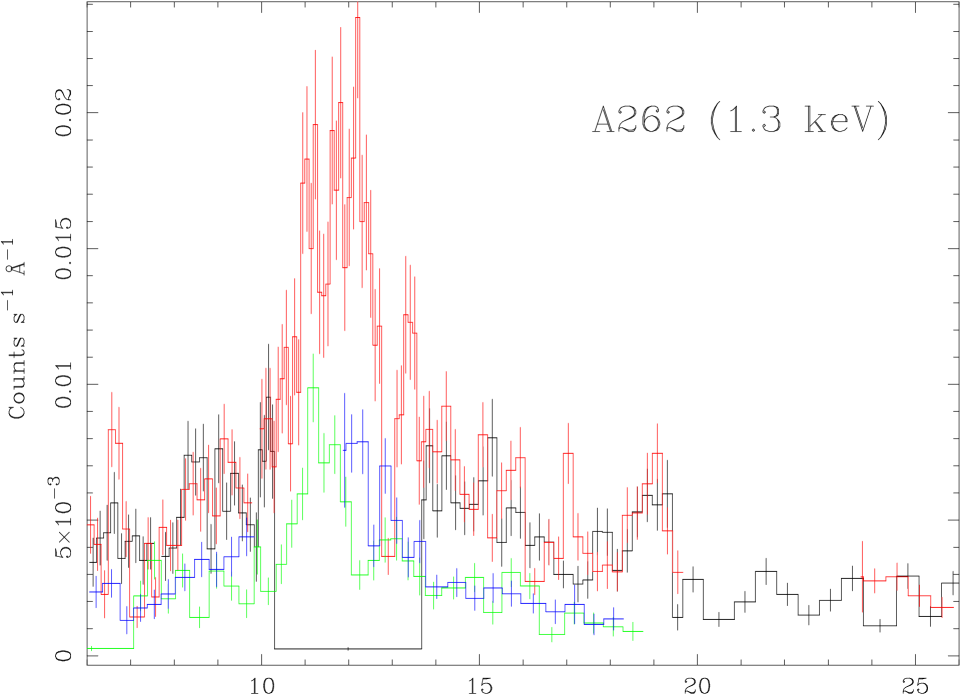
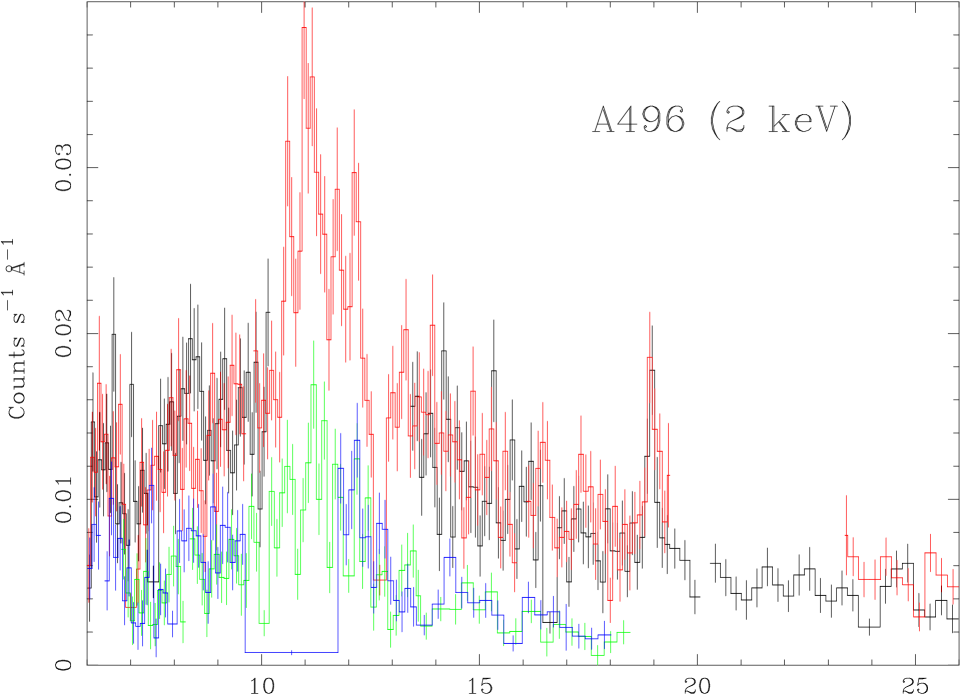
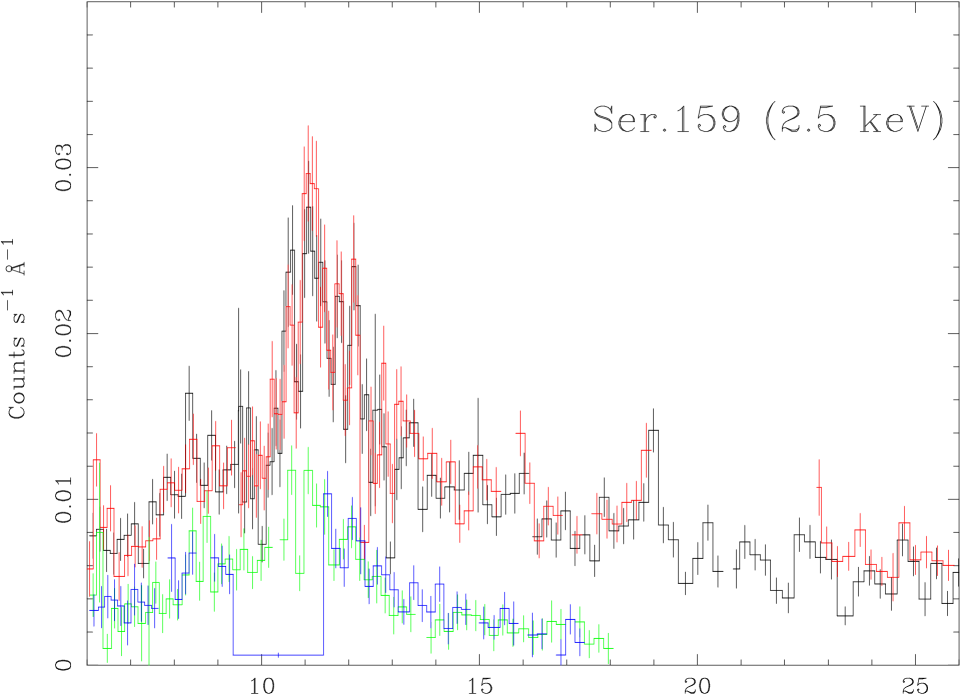
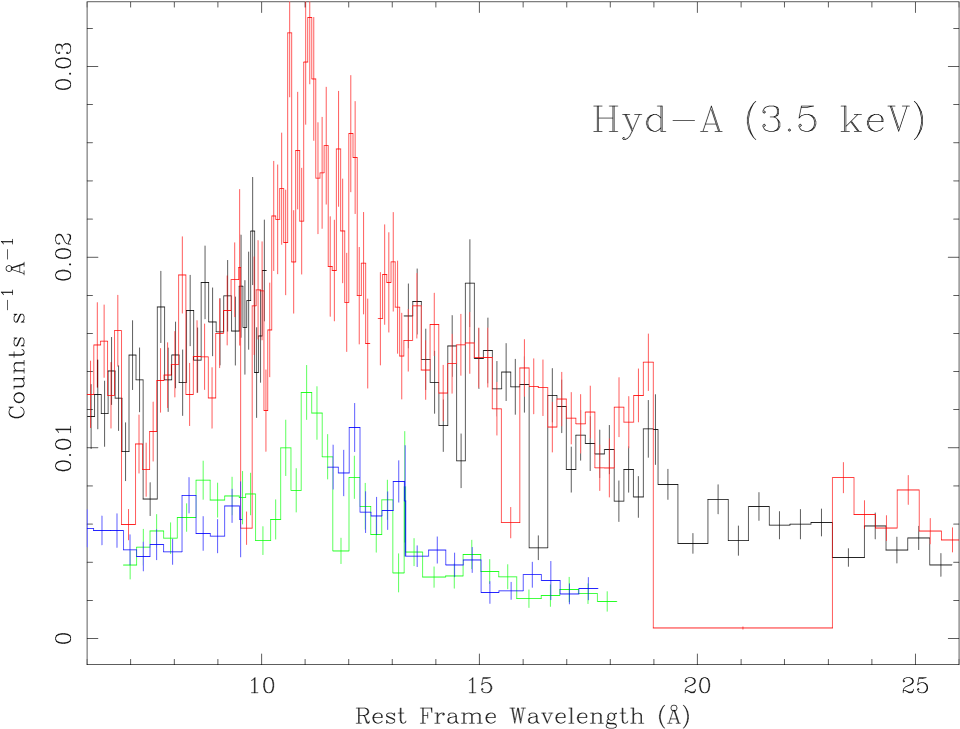
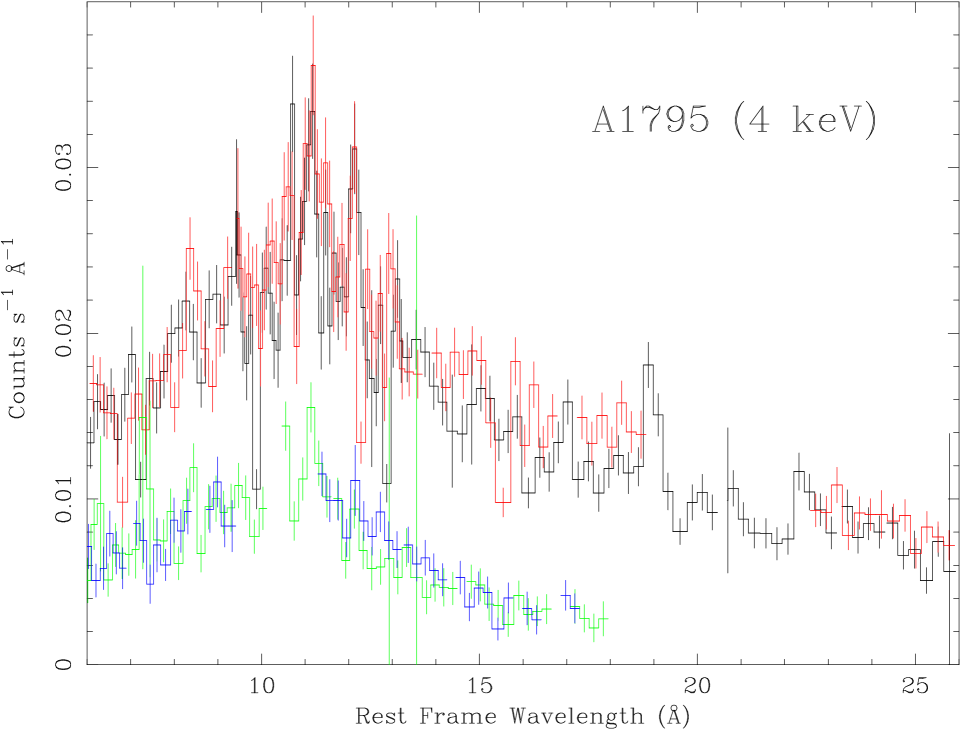
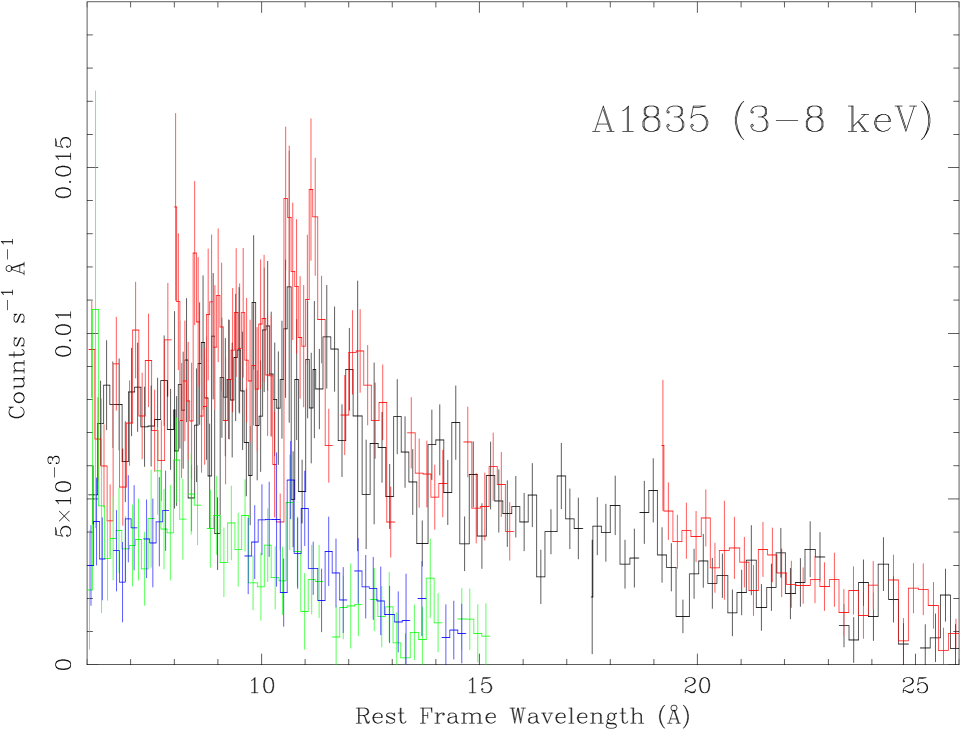
3 The RGS results
We used the RGS data to constrain the temperature structure and the O and Fe abundance around the cD galaxy at the cluster core.
-
•
The spectra of the cluster core were extracted within a of full width of the cross dispersion position (Fig. 1).
-
•
We calculated the line spread function based upon the source surface brightness profile from the MOS image and convolved this with the RGS response for a point source.
- •
-
•
In A 262 and NGC 533, the O and Fe abundance depend on the thermal model.
| (1) target | (2) | (3) EM | (4) T | O | Fe | |
|---|---|---|---|---|---|---|
| NGC 533 | 24 | 0.35 | 0.7 | 0.25 () | 0.21 () | 86/125 |
| A 262 | 13 | 1.9 | 1.3 | 0.20 | 0.23 | 234/243 |
| A 496 | 10 () | 5.2 | 2.2 () | 0.23 () | 0.43 () | 314/358 |
| Sérsic 159 | 3.2 | 17 | 2.7 | 0.29 | 0.55 | 360/343 |
| Hyd-A | 7.5 | 24 | 3.4 | 0.23 | 0.41 | 291/292 |
| A 1795 | 5.3 | 39 | 4.0f | 0.31 | 0.44 | 372/346 |
| target | EM1 | T1 | EM2 | T2 | O | Fe | ||
|---|---|---|---|---|---|---|---|---|
| NGC 533 | 12 | 0.07 | 0.7 | 0.06 | 1.2f | 0.4 | 0.6 | 72/124 |
| A 262 | 8 | 0.7 | 1.0 | 0.5 | 2.5f | 0.5 | 1.0 | 210/242 |
| A 496 | 9.0 | 0.16 | 1.0f | 4.4 | 2.6 | 0.29 | 0.68 | 303/357 |
4 Summary and Discussion
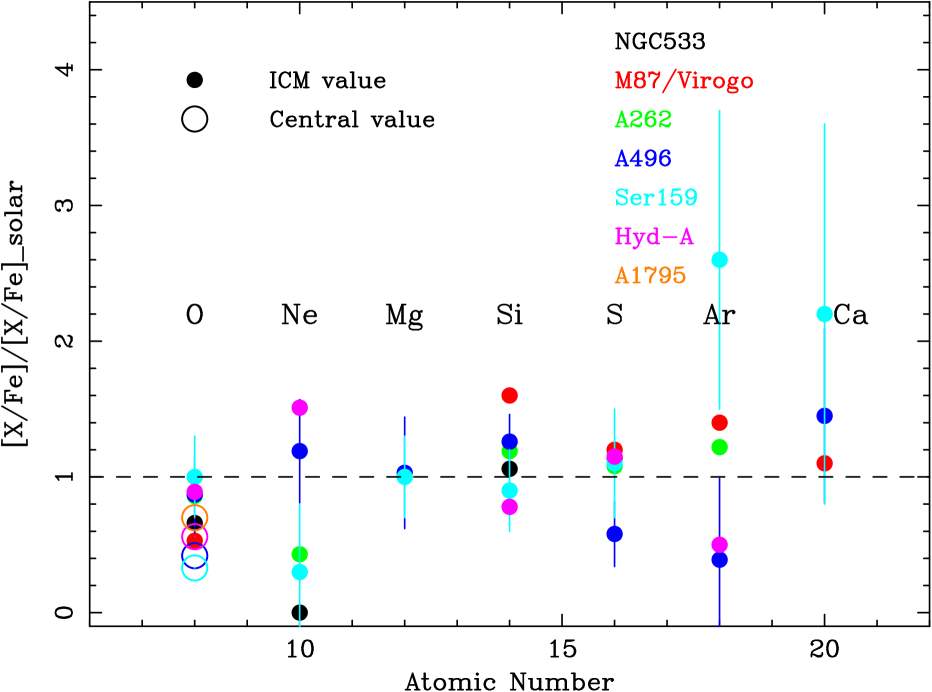
Our measurements of the elemental abundances along with the XMM-Newton results of M87 (Böhringer et al. 2001) are summaried in Fig. 3. Main results are followings.
-
1.
The average (and standard variance among clusters) of the O/Fe ratio around the cD galaxy are 0.5 (and 0.16) times the solar value, respectively.
-
2.
Those of the O/Fe, Ne/Fe, Si/Fe, S/Fe, and (Ar=Ca)/Fe in the outer region of clusters are 0.80 (0.17), 0.7 (0.6), 1.11 (0.29), 1.06 (0.24), and 1.2 (1.0) solar, respectively. These variances among clusters are comparable to the statistical errors and insignificant.
-
3.
There is significant change in the O/Fe ratio between the center and outer regions of clusters.
4.1 Comparisons with ASCA results
Fukazawa et al.(1998) measured Si and Fe abundances in 40 clusters excluding the central cool region. They reported that the Si/Fe ratio varies depending on the ICM temperature; groups and poor clusters ( keV) have Si/Fe of 1 solar, while rich clusters exhibit a higher value of 2–3 solar. Since our sample consists of groups and poor clusters (1.2–4 keV), our results of Si/Fe 1 solar is roughly consistent with the ASCA measurements.
4.2 Origin of the metals in the ICM
We interpret our new abundance measurements along with other XMM-Newton results. Here we assume that the distribution of the abundance ratios in the ICM have not change since the ejection of those metals from galaxies. However, we should note that the change in Si/Fe ratio among clusters from the ASCA results suggests that a large amount of -elements such as O, Si, and S have selectively escaped from the gravitational potential in poorer systems (Fukazawa et al. 1998).
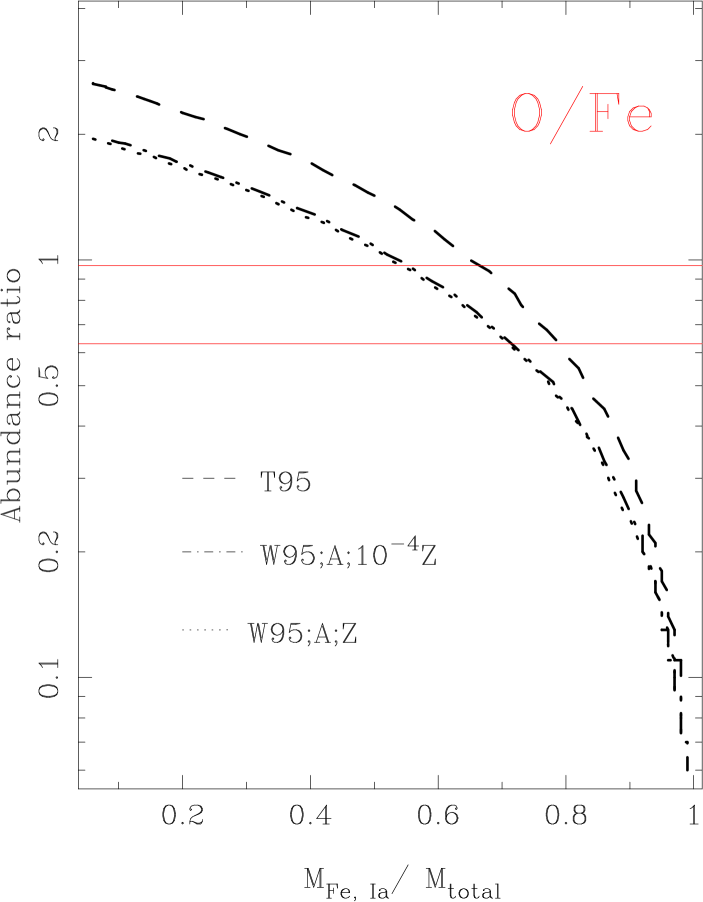
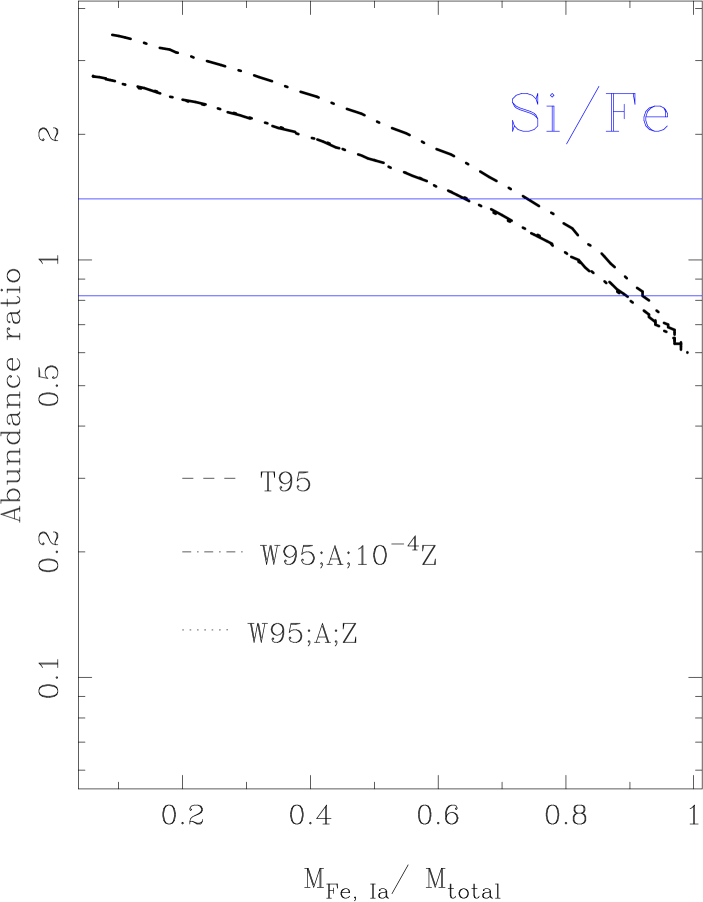
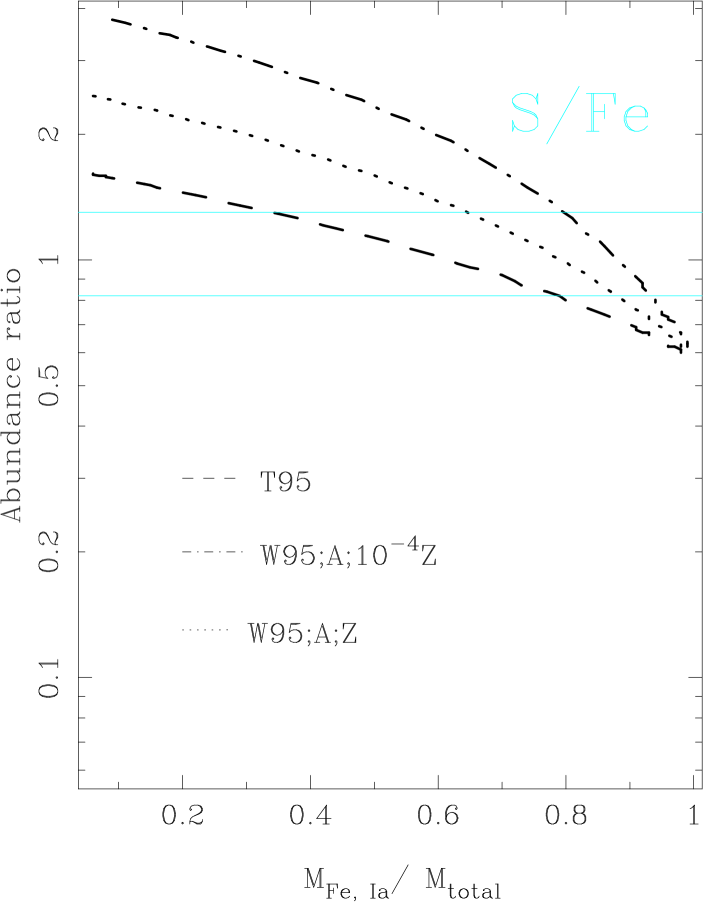
The result (2) indicates that in member galaxies in the clusters metal has been enriched in a similar way to that in solar neighborhood, and then ejected into the intergalactic space. Then, we compare the observed abundance ratios among O, Si, S, and Fe with a mixture of SN Ia and SN II prediction in Fig. 4. This comparison indicates that the observed O:Si:S:Fe ratio is consistent with a SN Ia originating Fe mass fraction of 0.6–0.8 (or equivalently a SN Ia/SN II frequency ratio of 0.2–0.7).
How about the cluster center ? The result (3) implies that there are at least two different origins for the metals in the ICM, irrespective of any theoretical model for the metal production. An increase of the relative contribution from SNe Ia in the cD galaxy to the metal production towards the center is one possibility. This is because a SN Ia is supposed to produce O/Fe ratio smaller than the solar value. In fact, Fukazawa et al. (1998) found that the excess Fe mass around the cD galaxy in general can be produced by the standard SN Ia rate over a Hubble time. The abundances of other elements such as Si and S at the cluster center, which is not addressed here, are important to examine this idea more quantitatively (Fukazawa 1998; Finoguenov et al. 2000).
References
- [] Anders, E., Grevesse, N., 1989, Geochim. Cosmochim. Acta 53, 197
- [] Böhringer, H., et al. 2001, A&A, 365, L181 (BBK01)
- [] Belsole et al. 2001, A&A, 365, L181 (BSB01)
- [] De Grandi, S. and Molendi, S., 2001, ApJ, 551, 153
- [] Finoguenov, A., David, L.P., Ponman, T.J., 2000, ApJ, 544, 188
- [\astronciteFukazawa et al.1998] Fukazawa et al. 1998, PASJ, 50, 187
- [] Fukazawa, Y. 1998, Ph-D thesis, University of Tokyo
- [] Gibson, B.K., et al. 1997, ApJ, 290, 623
- [\astronciteKaastra et al.2001] Kaastra, J.S., et al., 2001, A&A, 365, L99 (K01)
- [] Peterson, J.R., et al.,2001, A&A, 365, L104
- [] Tamura, T., Kaastra, J.S., Peterson, J.R., et al., 2001a, A&A, 365, L93 (T01a)
- [\astronciteTamura et al. 2001b] Tamura, T., Bleeker, J.A.M., Kaastra, J.S., et al. 2001b , A&A 379, 107 (T01b)
- [] Thielemann F.-K., et al. 1993, Origins and Evolution of the Elements, Cambridge Univ, Press, Cambridge, p.297
- [] Tsujimoto, T., Nomoto, K., Yoshii, Y., et al., MNRAS, 277, 945
- [] Woosley, S.E., & Weaver , T.A., 1995, ApJS, 101, 181
- [] Xu, H. et al., submitted to ApJ, see also Kahn, S.M., et al in this proceeding.