1WGA J1216.93743: Chandra Finds an Extremely Steep Ultraluminous X-ray Source
Abstract
We report the discovery of a new ultraluminous X-ray source (ULX) in the nearby galaxy NGC 4244 from Chandra archival data. The source, 1WGA J1216.93743, is one of the least luminous and softest ULXs discovered so far. Its X-ray spectrum is the best available for a representative of the soft ULXs, a class of sources recently discovered by Chandra and XMM-Newton. 1WGA J1216.93743 appears point-like in the Chandra image and has a complex spectral shape: a multicolor disk model, suitable for brighter ULXs, is inadequate for this source. 1WGA J1216.93743 spectrum is heavily absorbed ( cm-2), and very soft. The best-fit power-law model gives and implies a luminosity erg s-1. A comparison with previous detections shows that, despite the variability displayed by the source during the Chandra observation, 1WGA J1216.93743 count rate, spectral shape and absorption are practically unchanged over a 9-year period.
We performed also deep optical imaging of the field containing the X-ray source, and found a possible counterpart.
1 Introduction
X-ray observations of nearby galaxies have shown that their X-ray emission comes from different classes of sources: X-ray binaries, supernova remnants, hot interstellar medium in addition to possible background active galactic nuclei (AGNs; see e.g. Fabbiano 1989 for a review). Some of the point-like sources appear to radiate well in excess of the Eddington limit for a object, with inferred luminosities in the range ergs s . These objects are often referred to as ultra luminous X-ray sources (ULXs) or intermediate-luminosity X-ray objects (IXOs), inasmuch their luminosity is in between those of “normal” X-ray binaries and AGNs. Up to now about 90 ULXs have been detected in more than 50 galaxies (see Colbert & Ptak 2002 for a recent catalog). ULXs seem to be preferentially located in the outskirts of the host galaxy, although some are found in the central regions (e.g. IXO 95 in NGC 6949). As pointed out by Colbert & Ptak, starburst galaxies contain a comparatively large number of ULXs, but spirals seem not to be favoured hosts with respect to ellipticals. In a very recent paper, moreover, evidence was found for a ULX associated with a globular cluster in NGC 4565 (Wu et al. 2002). ULXs are often variable sources and their X-ray spectrum may be quite soft (e.g. Makishima et al. 2000). No certain optical counterpart has been found for these sources yet, implying an extreme X-ray–to-optical flux ratio. Very recently Pakull & Mironi (2002) reported the presence of emission nebulae at the position of some ULXs and suggested that they could actually be related to the episode which led to the ULX formation.
Thus far no generally accepted model has been presented to explain the huge energy output of ULXs. Assuming that the Eddington limit is not exceeded and emission is isotropic implies that ULXs are powered by accretion onto a black hole. Present evolutionary scenarios do not preclude such a possibility and the fact that these are rare sources may be compatible with the mean number of ULX per galaxy being only 1-2 (Colbert & Ptak 2002). Alternatively ULXs may be interpreted as conventional black hole binaries () with modest beaming coming from a collimated X-ray emission (, King et al. 2001) or to a relativistically beamed emission. In this picture the Galactic analogues of ULXs should be the microquasars, such as GRS 1915+105 and GRO 1655-40.
This paper presents a multi-wavelength study of a new ULX, 1WGA J1216.93743, found in NGC 4244. This source is one of the 16 peculiar ROSAT PSPC sources selected for their extremely high X-ray-to-optical flux ratio (Cagnoni et al. 2002). 1WGA J1216.93743 is a bright ( erg cm-2 s-1) WGACAT (White, Giommi & Angelini 1994) source with blank fields, i.e. no optical counterparts on the Palomar Observatory Sky Survey to O=21.5. The extreme ratio that follows is incompatible with all major and common classes of extragalactic sources, including normal quasars, AGNs, normal galaxies and nearby clusters of galaxies (Maccacaro et al. 1988). Possibilities for the nature of these ‘blanks’ (Cagnoni et al. 2002) include: (a) Quasar-2s, i.e. high luminosity, high redshift heavily obscured quasars, the bright analogs of Seyfert 2s; (b) Low Mass Seyfert-2s, AGNs powered by a low-mass obscured black hole (i.e. obscured Narrow Line Sy 1); (c) AGNs with no big blue bump, e.g. low radiative efficiency flows; (d) Isolated Neutron Stars (e.g. Treves et al. 2000); (e) -ray burst X-ray afterglows or fast variable/ transient sources; (f) failed clusters, in which a large overdensity of matter has collapsed but has not formed galaxies (Tucker, Tananbaum & Remillard 1995); (g) high redshift clusters of galaxies and, most relevant to this paper, (h) ULXs in nearby galaxies.
Using X-ray archival data (ROSAT and Chandra) and the information obtained from optical and IR follow-ups, we present strong evidence that 1WGA J1216.93743 is indeed a ULX in NGC 4244, a B=-18.4 (Olling 1996) edge-on spiral galaxy (Hubble type Scd) at a distance of Mpc (Fry et al. 1999).
2 Observations
2.1 ROSAT
1WGA J1216.93347 was serendipitously observed by ROSAT PSPC in November 1991 and the results of this observation are reported in Cagnoni et al. (2002); we summarize here the main findings. During the 9 ks PSPC observation (600179n00) a total of 135 net photons were collected between 0.07 and 2.4 keV. We extracted a spectrum and fitted it with both an absorbed power-law and an absorbed blackbody model. Despite the scanty statistics and the large error bars both fits agree on the extreme softness of 1WGA J1216.93743 emission ( for the power-law and eV for the blackbody models respectively) and on the presence of absorption a factor of 10-30 in excess of the Galactic value in this direction ( cm-2; and cm-2 for the power-law and blackbody models, respectively). The source absorbed flux in the keV band is erg cm-2 s-1, which corresponds to an absorbed luminosity of erg s-1 and to an unabsorbed luminosity of erg s-1 for both the power-law and black body models at NGC 4244 distance. ROSAT PSPC lightcurve is consistent with the source being constant during the observation (65% probability).
1WGA J1216.93743 region was observed by the HRI instrument on board ROSAT in June 1996 for ks, but the source was not detected, consistently with the extrapolation in the HRI band of the best-fit absorbed power-law. The upper limit on the count rate in a 24′′ circle is 0.0023 counts s-1.
2.2 Chandra
1WGA J1216.93347 was serendipitously observed by Chandra ACIS-S on May 20 2000 during a ks observation of the nearby galaxy NGC 4244. 1WGA J1216.93743 is 6 kpc off NGC 4244 center and is detected as a point-like source on ACIS-S S2 front illuminated chip with a total of 1948 counts between 0.3 and 10 keV with peak position at , (J2000).
We reprocessed Chandra archival data using the CXC analysis package CIAO 2.2.1 (Elvis et al., in prep.) and CALDB 2.9. The source position determination was improved by using the new geometry parameter file added to CALDB 2.9 and by removing the pixel randomization of pixels introduced by the standard Chandra pipeline processing (e.g. Garcia et al. 2001). We corrected the data for bad pixels and checked for high particle background times during the observation. The observation is not affected by any significant background flare. 1WGA J1216.93743 average count rate during this observation is photons s-1 between 0.3 and 10 keV for a total of 1948 counts in the ks of net exposure. In a conservative test to confirm whether any background flare might affect our results, we have excluded the time intervals with background count rate a factor 1.2 larger or smaller than the mean value during the observation111Note that all the points lie within a factor 1.3, as suggested by CIAO 2.2.1 Science Threads (http://asc.harvard.edu/ciao/threads/acisbackground/). This would bring to an useful exposure time of 42 ks and to 1653 net photons (0.3-10 keV) for 1WGA J1216.93743 . A detailed comparison shows that the count rate, spectrum and lightcurves are fully consistent with those extracted from the total observation222E.g. the 42 ks spectrum fitted with an absorbed power law model gives values perfectly in agreement with those reported in Table 1 cm-2, , normalization= photons cm-2 s-1 keV-1 and reduced for 39 degrees of freedom (d.o.f.). Errors represent here 1 confidence..
We extracted a spectrum for the source using a circle with radius (35 pixels) and a local background in an annular region with radii of 20′′ and 50′′ (40 and 100 pixels) respectively from which a circle of 15′′ centered on a nearby source was excluded. We binned the spectrum to have a minimum of 30 counts per bin and fitted it with SHERPA between 0.3 and 10.0 keV with an absorbed power-law model and an absorbed disk blackbody. Both models proved to be a poor representation of the data and the results are unchanged when the ACIS quantum efficiency degradation is taken into account. We tried with more complex models, such as an absorbed power-law disk blackbody, an absorbed power-law a Raymond-Smith thermal plasma and an absorbed broken power-law and they are all acceptable. The spectrum and the residuals to an absorbed power-law model are reported in Figure 1 and the results of all the fits are reported in Table 1. We also report in Table 1 the 0.5-10 keV absorbed fluxes and the 0.5-10 keV absorbed and unabsorbed luminosities of the source. It is clear from Table 1 that: (i) 1WGA J1216.93743 spectrum is extremely soft (); (ii) simple models give an unacceptable fit to the data; (iii) all but the broken power-law model predict a high column density ( cm-2) in 1WGA J1216.93743 direction; (iv) 1WGA J1216.93743 unabsorbed 0.5-10 keV luminosity is erg s-1 (for all but the broken power-law model, which could mimic the absorption with a flatter low energy slope and for the disk blackbody model, which is the statisticcally worst model).
We extracted lightcurves for the source and background between 0.3 and 10 keV using the same circular and annular regions used for the spectral analysis. The background subtracted lightcurve of 1WGA J1216.93743 binned over 5000 s is shown in Figure 2 and the source displays a factor 1.5 variability. A fit with a constant model gives a % probability for constant emission, indicating that 1WGA J1216.93743 is variable on timescales 5000 s. We have confirmed the variability by an independent method using a Bayesian-block analysis to the unbinned data which has recently been developed for the Chandra Multi-wavelength Project (J. Drake, private communication; Kim et al. 2002, in preparation).
2.3 Optical and Infrared
We obtained deep IR imaging in the K-band (to ) with NSFCAM at NASA/IRTF on January 2000 and deep R-band imaging (to ) with MOSAIC at KPNO 4m in February 2001. We performed standard imaging reduction using IRAF version 2.11.3 and calculated accurate astrometric solutions for the data using the digital sky survey.
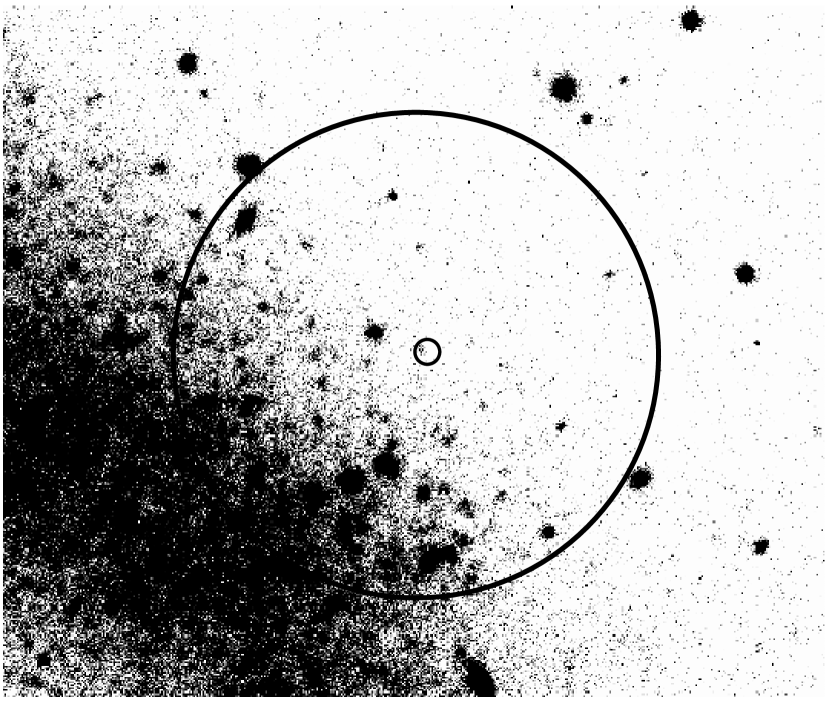
The Chandra error box (0.67′′ at 95% confidence level for net photons at off-axis, Kim et al. in preparation) contains only one object (at from Chandra central position), which appears stellar on the R image (Figure 3). 1WGA J1216.93743 counterpart lies in the optical extent of NGC 4244, at kpc from the galaxy center, and it is thus likely to be associated to the galaxy (we exclude a possible AGN in the background in § 3).
Since the night was not photometric we obtained an estimate of the source magnitude rescaling from the USNO catalog sources in the 17.0–20.0 R-magnitude range falling on the CCD. The estimated R-band magnitude is , while the source is not visible in the K-band image down to K. The X-ray over R-band flux ratio, defined as in Hornschemeir et al. (2001), is .
We searched for radio counterparts from the FIRST and the NVSS surveys but none were found within of the Chandra position, setting an upper limit of mJy at 1.4 GHz.
3 Discussion
The properties of 1WGA J1216.93743 indicate that it is an ULX in NGC 4244. The source absorbed flux in the 0.5–2.0 keV band derived from Chandra data ( ergs cm-2 s) is consistent within the errors with that measured with ROSAT ( ergs cm-2 s), so the source appears not to have significantly varied between the two observations ( yrs). The unabsorbed luminosity of 1WGA J1216.93743 at NGC 4244 distance is ergs s for the absorbed power law model Note however, that the 50 ks Chandra observation provides evidence for variability on a much shorter timescale ( s). We also found that the spectral shape did not change from the ROSAT observation and, although no simple emission model gives a satisfactory fit, the X-ray continuum appears to be very soft and can be roughly described by a very steep absorbed power-law with but not with thermal emission. A complex spectral shape was also found for the stacked spectra obtained from the ULXs in the Antennea galaxies by Zezas et al. (2002a) (see their Figure 2): the spectrum presented here for 1WGA J1216.93743 suggests that the complexity might not be the effect of the superposition of different types of ULX spectra, but it is intrinsic to each source.
Using the X-ray flux at 1 keV from the absorbed power-law fit, the R-band magnitude and the upper limit at 1.4 GHz we computed 1WGA J1216.93743 broad band spectral indices according to the formula
| (1) |
We used the canonical 1 keV, V-band (5500 Å) and 5 GHz points, by extrapolating the R-band flux density to the V-band and the 1.4 GHz flux density to 5 GHz assuming a flat spectral shape, and we obtain , and . Such values place 1WGA J1216.93743 out of the region occupied by AGNs in the – plane (e.g. Caccianiga et al. 1999) since not even the most extreme BL Lac objects can reach such values (e.g. Costamante & Ghisellini 2002). Taking absorption into account would make the situation even more extreme (e.g. an absorbing column of cm-2 with Galactic dust to gas ratio would enhance the X-ray flux by a factor of and the optical flux of a factor ). We can thus exclude the possibility of 1WGA J1216.93743 being a background AGN.
We can also exclude the possibility of 1WGA J1216.93743 being a supernova remnant for the short timescale variability displayed in the Chandra observation and by the lack of a significant fading in the 9 years between the ROSAT and the Chandra observations.
Even if the best fit model for 1WGA J1216.93743, a convex absorbed broken power-law, is usually used to describe the synchrotron peak observed in beamed sources such as blazars, the sharp change in the power-law shape of 1WGA J1216.93743 (, ) is difficult to reconcile with the smoothly curving blazar synchrotron peak (e.g. , measured for Mrk 421 by Guainazzi et al. 1999).
1WGA J1216.93743 luminosity falls at the lower end of the ULX range. Some emission models implies ergs s (see Table 1). In particular, the absorbed power-law plus Raymond-Smith model, and the absorbed broken power-law models, which have the lowest , give a luminosity of only few ergs s . This would make 1WGA J1216.93743 an ordinary X-ray binary in NGC 4244. However, optically thin bremsstrahlung emission is typical of extended sources, like clusters of galaxies, and we found no evidence for a diffuse nature of this source in Chandra data and the broken power-law model does not have a straightforward physical interpretation. The relatively low luminosity of 1WGA J1216.93743 may still suggest that this source is an X-ray binary with a black hole, of the Cyg X-1 type. The X-ray spectrum however strongly argues against this possibility, being much softer of those of Galactic black hole candidates (BHCs). BHCs spectra in the high state are thermal and soft, but peak around a few keV and extend up to keV.
The extreme softness of the X-ray spectrum makes this source rather peculiar among the ULXs. In fact, while very soft spectra have been already detected from other ULXs with ROSAT, successive observations over a wider energy range showed a harder component. An example of this behaviour is MS 0317.76647 which has been first associated with an isolated neutron star by Stocke et al. (1995) on the basis of its soft, thermal spectrum. The source was later identified with a ULX by Makishima et al. (2000) when ASCA data convincingly showed a hard tail (), possibly associated with a multicolor disk blackbody. Before the advent of Chandra the ULXs seen by ROSAT and ASCA were consistent with emission from a multicolor disk blackbody (e.g. Makishima et al. 2000); Chandra is now discovering a new class of steep ULX (e.g. out of the 30 ULX of Zezas et al. 2002b, 9 have a steep spectrum). 1WGA J1216.93743 is the source for which the best Chandra spectrum is available so far. In the study of the Antennae galaxies Zezas et al. (2002a) find steeper spectra for the least luminous ULX: 1WGA J1216.93743 seem to fit in this picture, interpreted with the possible presence of undetected diffuse hot interstellar medium in the proximity of the source. Alternatively one could consider that the indication of a luminosity dependent spectral shape is due to different accretion properties. The steep ULXs could be the “galactic” analog of Narrow Line Seyfert galaxies (a steep version of the Seyfert galaxies) which are thought to be powered by a lower mass black hole accreting at a higher rate compared to “normal” Seyferts.
Follow-up optical observations allowed us to discover a possible counterpart of 1WGA J1216.93743 at from Chandra position. The association is based only on the positional coincidence. The Chandra error box is quite small (95% confidence radius , Kim et al. in preparation) and the background field is not very crowded (see Fig. 3), so the possibility of a chance alignment appears unlikely, albeit it can not be ruled out on the basis of present data. The optical counterpart has ; if this source is a star in NGC 4244, it has to be a red star or its bolometric correction would imply a luminosity not compatible with even the most luminous stars known. The most likely possibility is that the suggested counterpart is a late type giant/supergiant, like a M5 II-III; for this spectral range the source luminosity, corrected for extinction, would be ergs s , about . The R-K derived from the IR non-detection is not stringent and it is satisfied by the red stars.
ULXs are one of the most interesting class of sources which are now being investigated by the X-ray satellites Chandra and XMM-Newton. We presented in this paper the best spectrum ( photons) available so far for a steep-spectrum ULX. Steep ULXs, like 1WGA J1216.93743, , appear to be related to the least luminous objects of the ULX class (e.g. Zezas et al. 2002a) and were essentially unknown before the launch of Chandra and XMM-Newton. Future investigations are needed to understand the emission mechanisms powering these sources and to confirm and explain a possible luminosity dependence of the spectral shape.
References
- Caccianiga et al. (1999) Caccianiga, A., Maccacaro, T., Wolter, A., della Ceca, R., & Gioia, I. M. 1999, ApJ, 513, 51
- Cagnoni et al. (2002) Cagnoni, I. et al. 2002, ApJ in press (astro-ph/0207085)
- Colbert & Ptak (2002) Colbert, E. & Ptak, A. 2002, ApJS submitted (astro-ph/0204002)
- Costamante & Ghisellini (2002) Costamante, L. & Ghisellini, G. 2002, A&A, 384, 56
- Fabbiano (1989) Fabbiano, G. 1989, ARA&A, 27, 87
- Fry, Morrison, Harding, & Boroson (1999) Fry, A. M., Morrison, H. L., Harding, P., & Boroson, T. A. 1999, AJ, 118, 1209
- Garcia et al. (2001) Garcia, M. R., Kong, A. K. H., Primini, F. A., McDowell, J., & Murray, S. S. 2001, American Astronomical Society Meeting, 198, 9105
- Guainazzi et al. (1999) Guainazzi, M., Vacanti, G., Malizia, A., O’Flaherty, K. S., Palazzi, E., & Parmar, A. N. 1999, A&A, 342, 124
- King et al. (2001) King, A. R., Davies, M. B., Ward, M. J., Fabbiano, G., & Elvis, M. 2001, ApJ, 552, L109
- Makishima et al. (2000) Makishima, K. et al. 2000, ApJ, 535, 632
- Pakull & Mirioni (2002) Pakull, M.W. & Mirioni, L. 2002, to appear in the proceedings of the symposium ’New Visions of the X-ray Universe in the XMM-Newton and Chandra Era’ (astro-ph/0202488)
- Stocke et al. (1995) Stocke, J. T., Wang, Q. D., Perlman, E. S., Donahue, M. E., & Schachter, J. F. 1995, AJ, 109, 1199
- Treves, Turolla, Zane, & Colpi (2000) Treves, A., Turolla, R., Zane, S., & Colpi, M. 2000, PASP, 112, 297
- Wu et al. (2002) Wu, H., Xue, S. J., Xia, X. Y., Deng, Z. G., & Mao, S. 2002, ApJ, 576, 738
- Zezas et al. (2002) Zezas, A., Fabbiano, G., Rots, A. H. & Murray, S. S., 2002a, ApJ submitted (astro-ph/0203175)
- Zezas et al. (2002) Zezas, A., Fabbiano, G., Rots, A. H. & Murray, S. S., 2002b, ApJ submitted (astro-ph/0203174)


| Model | aain units of cm-2 | Parameters values | /d.o.f. | Abs. | Abs. | Unabs. |
|---|---|---|---|---|---|---|
| (, in keV) | bbBetween 0.5 and 10 keV in units of erg cm-2 s-1 | ccBetween 0.5 and 10 keV in units of erg s-1 | ccBetween 0.5 and 10 keV in units of erg s-1 | |||
| Abs power-law | 1.38/47 | 2.31 | 3.6 | 21.6 | ||
| Abs disk blackbody | 1.91/47 | 2.19 | 3.4 | 4.6 | ||
| Abs (power-law disk blackbody) | 1.28/45 | 2.11 | 3.3 | 104.5 | ||
| Abs broken power-law | 0.169ddThe absorption was fixed to the Galactic value in 1WGA J1216.93743 direction; if left as a free parameter it tends to zero | 0.89/46 | 2.15 | 3.3 | 3.5 | |
| Abs (power-law +RS) | 1.05/45 | 2.14 | 3.3 | 9.4 | ||
| eeSimilar values are obtained for Raymond-Smith abundance equal to the solar value |