A very young star forming region detected by the ISOPHOT Serendipity Survey††thanks: Based on observations with the James-Clerk-Maxwell Telescope JCMT, the IRAM 30m Telescope, the United Kingdom Infrared Telescope UKIRT, the MPIfR 100m Telescope, the Calar Alto Observatory and the Infrared Space Observatory ISO, an ESA project funded by Member States (especially France, Germany, the Netherlands and the United Kingdom) and with the participation of ISAS and NASA.
We present a multi-wavelength study of the star forming region ISOSS J 20298+3559, which was identified by a cross-correlation of cold compact sources from the 170 m ISOPHOT Serendipity Survey (ISOSS) database coinciding with objects detected by the MSX, 2MASS and IRAS infrared surveys. ISOSS J 20298+3559 is associated with a massive dark cloud complex (M 760 M⊙) and located in the Cygnus X giant molecular cloud. We derive a distance of 1800 pc on the basis of optical extinction data. The low average dust temperature (T 16 K) and large mass (M 120 M⊙) of the dense inner part of the cloud, which has not been dispersed, indicates a recent begin of star formation. The youth of the region is supported by the early evolutionary stage of several pre- and protostellar objects discovered across the region: I) Two candidate Class 0 objects with masses of 8 and 3.5 M⊙, II) a gravitationally bound, cold (T 12 K) and dense (n(H2) 2 105 cm-3) cloud core with a mass of 50 M⊙ and III) a Herbig B2 star with a mass of 6.5 M⊙ and a bolometric luminosity of 2200 L⊙, showing evidence for ongoing accretion and a stellar age of less than 40000 years. The dereddened SED of the Herbig star is well reproduced by an accretion disc + star model. The externally heated cold cloud core is a good candidate for a massive pre-protostellar object. The star formation efficiency in the central cloud region is about 14 %.
Key Words.:
stars: formation, accretion, Herbig Be, ISM: clouds, dust, ISM:individual objects: ISOSS J 20298+35591 Introduction
It is a challenge to identify massive young stellar objects during their early evolution. The youngest protostars form deeply embedded in their cold (T 10-20 K) parental clouds (Pudritz 2002). The association with dense ambient material makes such objects best detectable as cold condensations at far-infrared and (sub)millimeter wavelengths. The short evolutionary timescales (Palla & Stahler 1993) and low spatial density of massive objects require large scale surveys for their identification. Many of the known intermediate- and high-mass protostellar candidates have therefore been discovered by follow-up studies towards IRAS sources (eg. Shepherd et al. 2000, Cesaroni et al. 1997, Molinari et al. 1998, Beuther et. al 2002), which were selected on the basis of color and flux density criteria (e.g. by Wood & Churchwell 1989, Palla et al. 1991)
The earliest stages of massive star formation are characterized by the initial conditions of their parental cloud cores with spectral energy distributions peaking beyond 100 m (Evans et al. 2002). In order to unveil such young objects we are using the ISOPHOT (Lemke et al. 1996) 170 m Serendipity Survey (ISOSS) (Bogun et al. 1996), which is the largest high spatial resolution survey performed beyond the IRAS 100 m band. We selected bright and compact sources detected by ISOSS and IRAS with a flux ratio [F170m/F100m] 2, implying a low dust temperature T 18 K and a large mass of the cold ISM in these objects. Since the clustered mode of massive star formation commonly involves young stellar objects of different evolutionary stages, we require the presence of embedded sources with thermal infrared excess as indicated by the 2MASS (Cutri et al. 2000) and MSX (Price et al. 2001) infrared surveys. The latter criterium also avoids confusion with cold interstellar cirrus. Here, we present the results of follow-up observations of the cold star forming region ISOSS J 20298+3559 and show evidence for its early evolutionary stage.
2 Observations
2.1 ISO far-infrared measurements
170 m data covering the region around ISOSS J 20298+3559 have been extracted from the ISOPHOT Serendipity Survey. The scans performed with the C200 2x2 pixel detector array of stressed Ge:Ga with a pixel size of 89.4 arcsec provide a spatial resolution of 1.8 arcmin FWHM. A flatfield correction for the individual scans was derived from redundant measurements at scan crossings. The calibration accuracy is estimated to be 30 % (Stickel et al. 2000)
2.2 SCUBA & MAMBO (sub)millimeter mapping
Submillimeter jiggle maps at 450 m and 850 m were obtained with the SCUBA bolometer array (Holland et al. 1999) at the JCMT from Mauna Kea (Hawaii) on July 28, 2001 under excellent and stable sky conditions ( = 0.185 0.01). The observing time was 30 min. The atmospheric transmission was determined from sky dips and water radiometer data (at JCMT and CSO). Mars, Uranus and CRL 618 served as calibrators. The data were reduced using the SCUBA User Reduction Facility (SURF) including identification of noisy bolometer pixels and removal of sky noise. The photometric accuracy derived from the calibration observations is 25 % at 450 m and 20 % at 850 m. The measured HPBW is 7.9 arcsec at 450 m and 14.9 arcsec at 850 m (derived from observations of CRL618). In order to remove the error beam of the telescope, which contributes significantly to the 450 m data, the SCUBA maps were deconvolved with a beam map of Uranus using the SCLEAN algorithm (Keel 1991) and finally restored to the initial spatial resolution. We know that the maps may be distorted by chopping into ambient cloud emission. This will affect the 450 m flux more than the 850 m flux, because the error lobe is larger at 450 m. The 450 m map was therefore finally corrected by adding a constant level of 5 % of the peak value to the map, before convolving it to the final resolution.
1.3mm continuum observations were carried out on June 9 and June 11, 2001 with the IRAM 30m telescope on Pico Veleta (Spain) using the 37-channel bolometer array MAMBO (Kreysa et al. 1998). Our observing strategy adopted On-Off measurements at 8 different raster positions in order to sample most of the object plane. The mode was chosen due to a rather high sky opacity of = 0.62 and = 0.55 and unstable atmosphere on the two days. Calibration measurements were obtained with the nearby source K30A. Data were reduced with the NIC package including sky noise reduction. The photometric accuracy is 30 %.
2.3 UKIRT/MAX mid-infrared imaging
Diffraction limited mid-infrared images were acquired with the MAX camera mounted at the 3.8m United Kingdom Infrared Telescope UKIRT from Mauna Kea (Hawaii) on December 20, 2000. The MAX camera (Robberto et al. 1998) consists of a Rockwell 128x128 Si:As BIB array, providing a field of view of 35 35 arcsec2. Spectrophotometric data were obtained through three narrow band filters ( 8.7, 9.7 11.6 m, 1.0 m) and in the M-, N- and Q-bands. The observations were made using standard beam switching techniques with a chop frequency of 2.5 Hz and a throw of 25 arcsec (PA 90∘). Tau and Boo served as standard stars, also for the narrow band filters where we derived synthetic photometry from data obtained by Cohen (1995). The images were finally deconvolved by the algorithm from Richardson & Lucy with standard stars as PSF estimators and have a resolution with a FWHM of 0.6 arcsec. The photometric accuracy is 20 %.
2.4 Optical spectroscopy and photometry
Optical long-slit spectroscopy was obtained using the TWIN double spectrograph at the 3.5m telescope at Calar Alto (Spain) on December 12, 2000 with a spectral dispersion of 0.55 Å/pixel for the blue (3400-5500 Å) and 1.1 Å/pixel in the red (6300-7100 Å) image channel. A photometric accuracy of 10 % was obtained. The spectra were extracted according to the method of Horne (1986).
CCD images in the Johnson BVRI bands were obtained with the MPIA 0.7m telescope on mount Königstuhl in Heidelberg (Germany), equipped with a Tektronix 1024x1024 camera (scale 0.89 arcsec/pixel). Data reduction of both spectroscopy and direct imaging was carried out using standard IRAF routines. I-band photometry of about 3000 stars has been derived using DAOPHOT (Stetson et. al 1987). The stellar photometry is complete to a limiting magnitude I = 18.8 mag with a photometric uncertainty 0.2 mag.
2.5 Effelsberg NH3 measurements
We carried out NH3 measurements with the MPIfR 100m telescope at Effelsberg in April 2002. The HPBW at the observing frequency of 23.7 GHz is . The facility 1.3 cm receiver was used with a typical system temperature (antenna temperature units) on the sky of 170 K in total power mode. The backend was the facility 8096 channel autocorrelator split into 4 bands in order to observe simultaneously both polarizations at the NH3(1,1) and (2,2) rest frequencies of 23694.495 MHz and 23722.633 MHz, respectively. The resulting spectral resolution was 0.06 km s-1. Pointing and calibration were checked by continuum scans across NGC7027. We estimate a pointing accuracy of about 5. We calibrated our data assuming a main beam brightness temperature for NGC7027 of 8.2 K corresponding to 5.86 Jy (Baars et al. 1977). Our NH3 spectra were reduced using the GILDAS software, and analyzed following procedures described by Harju et al. (1993).
3 Results
3.1 Morphology of the cold ISOSS source
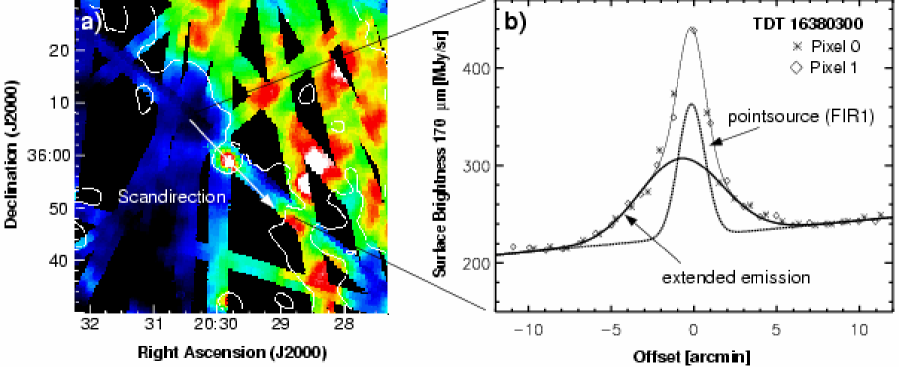
Fig. 1 presents our far-infrared measurements of ISOSS J 20298+3559 obtained by the ISOPHOT Serendipity Survey. The source was detected by two individual scans of the survey. A 170 m continuum map constructed from all scans in the region (Fig. 1a) shows the compact object on a bright galactic background. Overlaid on the map are IRAS 100 m contours, indicating the previous detection of the associated source IRAS20278+3549. Due to the superior spatial resolution of ISOPHOT we could disentangle two emission components from a central scan across the object (Fig. 1b). The 170 m emission is well described by an unresolved source (FIR1) with a flux density of S170μm=110 Jy and an extended emission component (size 5.9 arcmin FWHM, peak surface brightness I170μm = 90 MJy/sr).
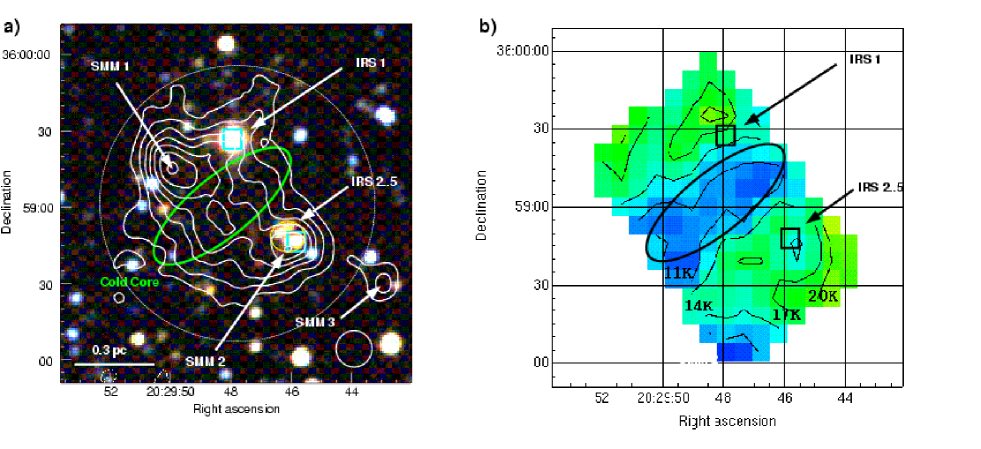
High resolution sub-millimeter continuum maps at 450 m and 850 m with SCUBA and at 1.3 mm with MAMBO have been obtained towards the unresolved far-infrared source FIR1. The 850 m image superimposed on a near-infrared (JHKS) color composite from the 2 MASS survey is presented in Fig. 2. FIR1 indicated by the dashed circle is clearly resolved by the JCMT in the submillimeter. The map indicates the presence of a dense core (outlined by an ellipse) surrounded by extended emission, which covers an area of about 100 70 arcsec2 and accounts for the bulk of the flux. This extended emission is located northeast and southwest of the core and shows three compact dust condensations. We derived positions and fluxes of the compact sources by a two-dimensional gaussian deconvolution using a local background estimation. The source sizes were determined from the 450 m data, which have the highest available resolution. The 1.2 mm fluxes of the fainter sources SMM2 and SMM3 could not be determined due to background confusion at that wavelength. The results are given in Tab. 1. The integrated (sub)millimeter flux density of FIR1 within a circular 2.4 arcmin aperture corresponding to the SCUBA field of view and covering most of the ISOPHOT beam are S450μm =27.5 Jy, S850μm = 3.9 Jy and S1200μm = 1.1 Jy.
| Source | Position [J2000] | Total Flux | Size | Peak Flux | |||||
|---|---|---|---|---|---|---|---|---|---|
| Jy | pc | mJy beam-1 | |||||||
| 450 m | 850 m | 1.2 mm | 450 m | 850 m | 1.2 mm | ||||
| SMM1 | 20:29:49.9 | +35:59:15 | 1.26 | 0.233 | 0.075 | 0.1 x 0.2 | 690 | 251 | 80 |
| SMM2 | 20:29:45.6 | +35:58:46 | 0.31 | 0.091 | - | 0.07 | 610 | 206 | – |
| SMM3 | 20:29:48.2 | +35:59:24 | 1.05 | 0.155 | - | 0.15 x 0.2 | 290 | 117 | - |
| cold core | 20:29:48.4 | +35:58:57 | 6.02 | 0.902 | 0.33 | 0.55 x 0.29 | 410 | 203 | 60 |
| extended | - | - | 18.86 | 2.47 | 0.7 | 0.9 x 0.7 | 368 | 173 | - |
3.2 Distance and structure of the cloud complex

A well known drawback for the use of kinematical distances towards Cygnus is the near-zero radial velocity gradient up to a distance of about 2 kpc from the sun. Therefore we have created an extinction map to determine a reliable distance to ISOSS J 20298+3559 based on a Wolf diagram and to study the large-scale distribution of dust associated with the far-infrared source. We have obtained deep I-band images of the region using the MPIA 0.7m telescope.

The extinction map shown in Fig. 3 was constructed according to the method of Bok (1956) and subsequently smoothed to the ISOPHOT resolution. An adaptive grid (reseau size 1 arcmin) was used for optimization of the angular resolution with respect to the stellar density (Cambrésy et al. 1997). The observed cloud extinction with respect to the reference positions was calculated from the number density of stars seen towards the cloud and their unobscured reference density : a log(N, where denotes the slope of the I-band luminosity function. We use AV = 2.07 AI (Rieke & Lebofsky 1985) to relate visual extinction to our I-band observations. The reference fields are marked with ’R’ in Fig. 3 and are located in direction of the lowest dust column density as indicated by the 170 m continuum.
The extinction derived from the simple Bok formula underestimates the true cloud extinction of a distant cloud due to the contamination by foreground stars. Foreground stars lower the density contrast towards the cloud. Since they are not affected by the cloud extinction, their number density remains constant: = . In order to account for the stellar foreground and background population we apply the general form of the Bok formula (e.g. Cambrésy et al. 2002) providing the true extinction depending on the fraction of background stars.
Fig. 4 presents the Wolf diagram for the reference field (upper curve) and towards the dense region ( 1 mag) of the cloud complex (lower curve). The logarithm of the cumulative distribution of apparent magnitudes is shown, error bars are 1 and are calculated according to Poisson statistics. The number density in the reference field agrees well with the prediction from the Galactic stellar distribution model from Robin & Creeze et al. (1986), assuming an average interstellar extinction coefficient of = 1.5 mag kpc-1 in the distance range 0 d 4 kpc and = 0.7 mag kpc-1 beyond 4 kpc. The higher extinction below 4 kpc is attributed to dust in several giant molecular cloud complexes of the local spiral arm and extending out to the inter-arm gap between local and Perseus spiral arms at a distance of 4 kpc (Ungerechts et al. 2000). The integrated (0 d 5 kpc) line-of-sight extinction of = 6.7 mag towards the reference fields agrees with the value of = 6.9 0.7 mag derived by Schlegel & Finkbeiner (1998) from the IRAS 100 m dust continuum.
To interprete the shape of the Wolf diagram correctly, a model curve of an obscured region was determined from Monte-Carlo simulations using a Galactic stellar distribution model for the unobscured field star luminosity function. We assumed the extinction in the cloud to be gaussian distributed for resolutions smaller than tested by the average extinction A of our integral aperture. The lower curves in Fig. 4 show the results of our simulations for three best-fit cloud models, which are consistent with our observed average extinction ( = 1.1 mag) and are located at distances of 1.5, 1.8 and 2.1 kpc, respectively. From the observations we derive a cloud distance d = 1.8 0.3 kpc and an average extinction of the cloud of = 3.1 0.5 mag, where the errors mainly originate from the Poisson statistics of our star counts. Using the interstellar extinction coefficient of = 1.5 mag kpc-1 determined from the reference field, the foreground extinction towards ISOSS J 20298+3559 is = 2.7 0.3 mag.
We compared our result with the empirical distance estimator d = 320 N0.57 pc by Herbst & Saywer (1987), which relates the cloud distance to the number N of foreground stars counted within a circular aperture of 5 arcmin diameter on the POSS blue print. Using B-band star counts from the USNO-PMM catalogue (Monet 1996) we obtain a distance of d 2.2 kpc for the cloud complex. The formula is however only valid for opaque dark clouds (A 7 mag) and the higher distance might originate in the partly translucent character of ISOSS J 20298+3559.
3.3 Cloud masses
The extinction map clearly reveals the presence of a dusty cloud complex with 4 different dark clouds (C1..C4). C1 coincides with the cold source FIR1 and accounts for the extended far-infrared emission shown in Fig. 1b. Despite being covered by our 170 m scan, the south-western cloud C2 does not show up with a strong 170 m excess and we find an upper limit of S170μm 15 Jy. The cloud complex also shhows a small extinction ridge towards the east (C3) and extends to the north-west (C4).
Cloud masses were derived from the extinction map, using the relation by Dickman (1978):
| (1) |
where is the angular size of the map, d is the distance to the cloud, is the mean molecular weight corrected for helium abundance, and i corresponds to a map pixel. With the dust-to-gas ratio proposed by Savage & Mathis (1979), cm-2mag-1 () we obtain a total mass of the cloud complex of 760 M⊙. We list in Tab. 2 parameters of the four individual clouds. Due to systematic uncertainties in the extinction values and the conversion factor, we assume the mass estimates to be accurate within a factor of 2.
| Source | Position [J2000] | Mass | Peak AV | Size |
|---|---|---|---|---|
| , | M⊙ | mag | pc2 | |
| C1 | 20:29:46.8 +35:59:30 | 188 | 4.7 | 2.0 1.7 |
| C2 | 20:29:35.1 +35:58:09 | 162 | 4.6 | 1.9 1.7 |
| C3 | 20:30:05.3 +36:00:07 | 115 | 2.6 | 2.5 1.5 |
| C4 | 20:29:31.9 +36:00:49 | 295 | 3.7 | 2.3 2.2 |
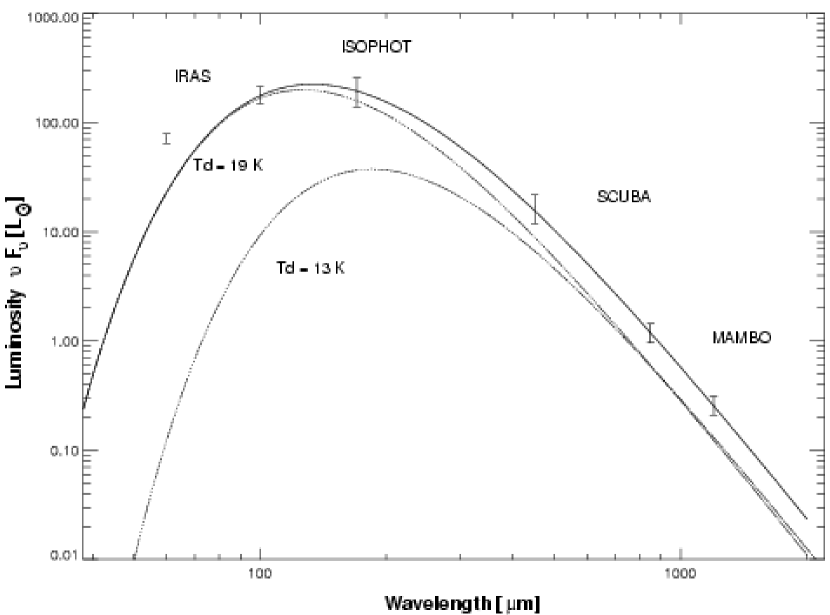
3.4 Dust properties of FIR1
Fig. 5 displays the spectral energy distribution (SED) for the cold region FIR 1. The spectral energy distribution longwards of 100 m is dominated by large grains, which are at an equilibrium temperature within the surrounding radiation field.
| Line | (main) | FWHM | areamain | areasatel | ||
|---|---|---|---|---|---|---|
| K | kms-1 | kms-1 | Kkms-1 | Kkms-1 | ||
| (2,2) | 0.139 (0.074) | 0.66(0.13) | 0.883(0.408) | 0.146 | 0.78(0.10) | |
| (1,1) | 0.329 (0.076) | 0.58(0.02) | 0.955(0.065) | 0.34 | 0.19 | 0.10(0.05) |
The flux density of the diffuse dust component in FIR1 (excluding the knots SMM1, SMM2 and SMM3) is well characterized by optically thin thermal radiation of two modified blackbodies with a dust emissivity =2 and dust temperatures Td = 13 2 K and Td = 19 2 K. As can be seen from Tab. 1, the contribution of SMM1, SMM2 and SMM3 to the total (sub)millimeter flux is less than 15 %. In the large beam measurements of the IRAS/ISO satellites we cannot separate these sources. If they contributed significantly more FIR flux than estimated from our submillimeter data, the dust temperatures of the diffuse dust component would be even lower and the resulting dust mass higher.
Drawing the conclusion of a very cold dust component merely from large-beam integrated photometry is critical without any radiative transfer model. Our spatially resolved submillimeter data allow, however, to confirm the presence of a very cold dust component from the dust color temperature map of ISOSS J 20298+3559-FIR1 presented in Fig. 2b. The map was obtained from the deconvolved 450 m and 850 m maps smoothed to 14.9 arcsec resolution. The color temperature Tcol was derived from the spectral index between the two wavelengths and is given by
| (2) |
with a dust emissivity = 2. A decreasing color temperature and a clear 850 m (and 1.2 mm) excess is observed towards the cloud center, exhibiting a minimum temperature of only Tcol = 11 2 K.
Optical depth effects in the sub-millimeter or a change in the dust emissivity () could affect the spectral index. We conclude, however, that these effects are small and the dust temperature dominates the spectral index: The peak column density towards the cloud core derived from our 850 m data is N(H2) = 2.2 1022 cm-2, in good agreement with our ammonia observation (see next section). The corresponding optical depth is = 2 10. Assuming a roughly ellipsoidal core geometry of pc2 as indicated in Fig. 2 we obtain an absolute molecular gas density of N(H = 2 105 cm-3. Concerning , the centrally decreasing temperature profile points to an external heating of the core region. Therefore the conditions in our core region basically resemble observations of nearby very cold pre-stellar cores for which =2 was found (eg. Juvela et al. 2001, Ward-Thompson et. al. 2002).
Masses for the emitting regions have been derived from the optically thin emission in the submillimeter. The dust mass is given by Md = , where we used a dust mass absorption coefficient of = 2.1 cm2 g-1 following Ossenkopf & Henning (1997) for dense protostellar cores. Following Sodroski et al. (1997) we assume a gas-to-dust mass ratio of 150 and derive a total gas mass M=120 M⊙ 24 M⊙for FIR1. The total mass contained in the cold core is M = 50 10 M⊙.
We calculated the bolometric FIR luminosities re-radiated from large grains by integrating over the Planckian radiation and find for the region LFIR = 250 L and for the cold core LFIR = 15 L, respectively.
3.5 Dense gas in the cold core region
It is important to approve the physical conditions derived from our dust continuum observations by molecular line observations, which reflect the physical conditions of the gas phase ISM. NH3 is a very useful indicator of molecular cloud temperatures and column densities (e.g., Walmsley & Ungerechts 1983).

We detected the NH3(1,1) line with a S/N of 4 and the NH3(2,2) line with a S/N of 2. Fig. 6 presents the (1,1) spectrum. We derived the NH3(1,1) line optical depth and estimated the (1,1)(2,2) rotational temperature K and the gas kinetic temperature K. The derived ammonia column density was estimated as N(NH3)=1.32cm-2. From the column density obtained by our submillimeter continuum observations and smoothed to 40 arcsec resolution we derive a molecular hydrogen column density of cm-2 for the region covered by the Effelsberg beam. This corresponds to a fractional abundance of = 1.0 10-8 which is in the range found by Molinari et al. (2000) in their study of ammonia clumps associated with young intermediate and high mass star forming regions. Ammonia in ISOSS J 20298+3559 seems however to be under-abundant when comparing to the values given by Harju et al. (1993). They find a mean value of in a sample of 22 ammonia clumps in Orion. Ammonia is considered as a molecule characterizing later stages of chemical evolution. Myers & Benson (1993) found to be more abundant in older cores, where stars have already formed. This may indicate that ISOSS J 20298+3559 is a rather young object. Tab. 3 summarizes our ammonia results.
ISOSS J 20298+3559 is located towards the southern outskirts of the Cygnus X Giant Molecular Cloud (Dame & Thaddeus 1985). The majority of active and luminous star forming regions in this giant molecular cloud is found at distances between 1.2 and 2.5 kpc (Odenwald & Schwartz 1993), corresponding to radial velocities (LSR) between -10 km s-1 and +10 km s-1. The ammonia line velocity vLSR = 0.58 0.06 km s-1 is consistent with the kinematical association with the Cygnus X GMC.

| Source | Position [J2000] | I | J | H | KS | 8.3 m | 2MASS | remarks |
|---|---|---|---|---|---|---|---|---|
| , | mag | mJy | counterpart | |||||
| IRS1 | 20:29:47.9 +35:59:26 | 12.90 | 10.98 | 9.45 | 8.15 | 1740 | J2029479+355926 | Herbig B2 star |
| IRS2 | 20:29:45.8 +35:58:47 | 17.23 | 14.70 | 13.01 | 11.95 | 90 | J2029458+355847 | brightest member of cluster IRS2..5 |
| IRS3 | 20:29:46.1 +35:58:46 | 18.54 | 16.1⋆ | 14.3⋆ | 13.1⋆ | JHKS fluxes from 2MASS map | ||
| IRS4 | 20:29:46.1 +36:58:52 | 19.5 | 16.2⋆ | 13.85 | 12.25 | J2029461+365852 | J flux from 2MASS map | |
| IRS5 | 20:29:46.4 +35:58:50 | 18.44 | 15.74 | 13.85 | 13.02 | J2029464+355850 | ||
| IRS6 | 20:29:36.0 +35:58:18 | 15.77 | 13.33 | 11.83 | 10.73 | 75 | J2029360+355818 | |
| IRS7 | 20:29:54.5 +35:57:38 | 12.48 | 11.38 | 10.97 | 10.74 | 1870 | J2029545+355738 | MIR nebula + illuminating star |
| IRS8 | 20:29:47.9 +36:01:08 | 13.09 | 9.78 | 7.94 | 6.98 | 225 | J2029479+360108 | background star |
3.6 Young stellar objects in the cloud complex
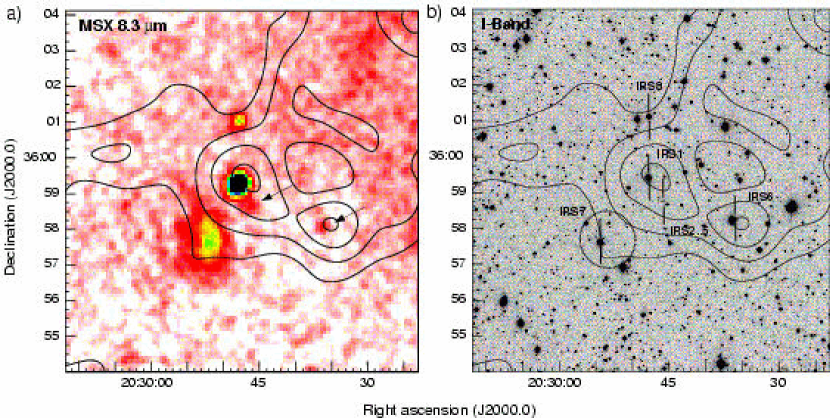
Mid-infrared observations are well suited to identify young stellar objects enshrouded by warm circumstellar dust. An MSX 8.3 m image covering the region of our extinction map is presented in Fig. 7a. Four compact and one extended mid-infrared sources have been detected above the 5 noise level ( 15 mJy/beam). The astrometric accuracy of the MSX image ( 2 arcsec RMS) allows the cross-identification with objects from our I-band image shown in Fig. 7b and the 2MASS point source catalogue. All four compact MSX sources coincide in position with very red (I-KS = 5..7 mag) near-infrared counterparts. The objects are marked in Figs. 2 and 7b. Astrometry and photometry of the sources are given in Tab. 4, where the 8.3 m fluxes were derived from the MSX map performing aperture photometry, yielding a photometric accuracy of 25 %.
The intrinsic excess emission and extinction of the MSX near-infrared counterparts are characterized by the (J-H) vs. (H-Ks) color-color diagram presented in Fig. 8, where the colors of IRS1..8 are plotted with their photometric 1 errors. The solid curve corresponds to the loci of unreddened main sequence and giant branch stars (Bessel & Brett 1988) and is extended by the reddening band, which confines stars with normal photospheres (dashed parallel lines).
IRS1, IRS2, IRS3, IRS4, and IRS6 lie to the right side and show an intrinsic infrared excess due to warm circumstellar dust. Their observed colors are consistent with reddened (A 15 mag) pre-main-sequence stars of low- to intermediate-mass as indicated in the diagram by the loci of unreddened Herbig Ae/Be (dashed parallelogram, Hillenbrand et al. 1992) and T Tauri stars (dashed line, Meyer et al. 1997). The derived extinction is smaller than the total line-of-sight extinction derived from our 850 m, yielding AV=18 mag towards IRS1 and AV=23 mag towards the small cluster IRS2, IRS3, IRS4 and IRS5. The sources are not affected by the total dust column, and are therefore either foreground objects or embedded in the cloud complex. The positional coincidence of dust with IRS1..5 (Fig. 2) favors however the association with the dark cloud: IRS1 is located on a dust ridge in the northwest of the central region of the cloud C1, IRS2 coincides in position with the compact submillimeter source SMM2 and is surrounded by a compact cluster of a least 3 further red sources,
IRS5, IRS7 and IRS8 show no infrared excess. IRS5 and IRS8 are reddened with about (A 15 mag). The corresponding line-of-sight extinctions from our extinction maps are 23 mag for IRS5 and 4.5 mag for IRS7 and IRS8. which are located at the border of the cloud. This suggests that also IRS5 and IRS7 are associated with the cloud, while IRS8 is a background giant.
IRS7 is located approximately in the center of a spherically segmented mid-infrared nebula seen in Fig. 7a. The nebula is located in the south-east of the dark cloud C1 and indicates an external illumination of the outer rim of the molecular cloud by IRS7. The nebula and IRS7 coincide in position with the source IRAS20279+3547. The flux ratio F12/F25 1.4 and the strong emission in the MSX 8.3 m band, which contains a strong PAH feature, indicate a reflection nebula around a B type star. In order to clarify whether IRS7 is the illuminating source we have obtained BVRI photometry of the source. Comparing with the colors of main sequence stars we obtain a best fit for AV = 4.2 0.3 mag and a spectral type B4..B6, in agreement with the total line-of-sight extinction AV = 4.2 0.5 mag towards IRS7 from our extinction map.

| Line | Obs. Wavelength | EW | Flux |
|---|---|---|---|
| [Å] | [Å] | [10-16 erg cm-2 s-1] | |
| H | 6562.8 | -200 | 1950 |
| H | 4861.4 | -19.9 | 99.8 |
| H | 4340.4 | -5.2 | 15.2 |
| HeI | 6678.15 | 0.55 | -13.8 |
| HeI | 7065.18 | 0.29 | -8.5 |
| FeII | 4923.06 | -2.8 | 19.2 |
| FeII | 5017.36 | -3.5 | 19.2 |
| FeII | 5316.05 | -4.3 | 48.3 |
| FeII | 5167.75 | -3.4 | 33.4 |
| FeI | 6358.56 | -0.2 | 4.8 |
| MgI(+FeI) | 6317.84 | -1.3 | 26.8 |
| DIB | 6613.81 | 0.3 | -6.5 |
| NI | 6442.02 | -0.4 | 9.4 |
| NI | 6491.36 | -0.8 | 16.9 |
| NI | 6505.58 | -0.8 | 18.1 |
3.7 The embedded Herbig B2 star IRS1
In order to establish the pre-main-sequence nature of the bright source IRS1 we have obtained optical long-slit spectra presented in Fig. 9. The spectra display strong emission lines of H I, Fe II, N I, Fe I which are all characteristic for luminous young stellar objects (Cohen & Kuhui 1979). Parameters of important spectral features are given in Tab. 5.
We have several strong indications that IRS1 is a rare example of an early B type pre-main-sequence object: He I absorption lines of presumably photospheric origin have been detected at 6678 Å and 7065 Å. Comparing their strength with the theoretical values for stellar atmospheres given by Auer & Mihalas (1973) we derive a spectral type of B2 (Teff = 20000 2500 K, log g = 4.0). This is consistent with the presence of NI emission lines which are confined to hotter Be type stars due to their high-ionization energy (14.5 eV) and the large line excitation ( 10 eV) (Andrillat et al. 1988). The relative strength of FeII with respect to neutral FeI also requires the presence of a more ionized line-emitting region than associated with classical T-Tauri stars (Hamann & Persson 1992), where FeI lines often rival the strength of FeII. In order to derive the rotational velocity of IRS1 from the He I lines we have used the rotational broadening function given by Gray (1976). We obtain v sin(i) = 158 25 km/s, in agreement with a pre-main-sequence star of intermediate mass (Finkenzeller 1985). A small nebulosity (size 15 8 arcsec2, PA = 40∘) around IRS1 which is visible on POSS-B and -R plates was covered by our long slit spectra and identified as a reflection nebula. Its presence and the association with the dark cloud C1 make the emission line object IRS1 by definition a Herbig Be star (Herbig 1960). According to the most comprehensive catalogue of Herbig Ae/Be stars compiled by Thé et al. (1994), only 20 objects known to date have a spectral type B2 or earlier.
IRS1 (=MSX5C_G075.5314-01.8159) was detected by MSX at 8.3, 12.1 and 14.7 m and is included in the MSX point source catalogue (Egan et al. 1999). The source is unresolved by the small MSX telescope (beam 12 arcsec). In order to explore the nature of the thermal excess emission of warm dust around IRS1 we have obtained diffraction-limited sub-arcsecond images with the thermal infrared camera MAX at UKIRT. The observations cover the M, N and Q bands as well as narrow-bands centered on the 9.7 m silicate feature and two strong PAH bands accessible from ground at 8.7 and 11.6 m.
The high-resolution data confirm the presence of a compact mid-infrared source coinciding with IRS1. An unresolved point source (size 0.5 arcsec FWHM) accounts for the bulk ( 80 %) of emission. The image obtained in the 11.6 m PAH band shown in Fig. 10 shows the presence of a faint extended emission region towards the north of the stellar source. Optical broadband photometry of the source in the Johnson BVRI bands have been performed in order to cover the spectral energy distribution of the stellar photosphere of IRS1. Tab. 6 presents our optical and mid-infrared photometry of IRS1.

| Band | B | V | R | M | P8 | S9 | N | P11 | Q |
|---|---|---|---|---|---|---|---|---|---|
| Flux | 17.3 | 15.7 | 14.5 | 5.7 | 3.9 | 4.1 | 3.7 | 3.1 | 2.6 |
| 0.1 | 0.1 | 0.1 | 0.2 | 0.2 | 0.2 | 0.2 | 0.2 | 0.2 |
4 Discussion
4.1 Evidence for a pre-protostellar core in the center of the dark cloud
Our submillimeter observations towards the central region of the dark cloud complex have revealed the presence of a centrally condensed, dense (n(H2) = 2 105 cm-3), very cold (T 12 K) and compact (R 0.2 pc) core with a decreasing temperature gradient towards the center. Similar conditions have been recently observed in FIR studies of nearby pre-protostellar cores (Juvela et al. 2001, Ward-Thompson et al. 2002) and are considered as the initial conditions which pertain in clouds from which stars form. Most of the known prestellar cores are however of low-mass. Is it possible that FIR1 contains a rare example of a massive pre-protostellar core. Even considering that probably more than 50 % of the mass are dispersed during the early phases of star formation, the total mass of the core M = 50 M⊙ is likely to be massive enough to form at least one late O- or early B-type star.
By definition a pre-protostellar object has to be gravitationally bound. In order to investigate the dynamical state of the core, we consider the virial theorem. The condition for a gravitationally bound molecular clump or core is given by
| (3) |
where Emag denotes the net magnetic energy, Epot is the gravitational energy, Ekin the total kinetic energy and Eext accounts for external pressure. We assume that kinetic energy consists of the thermal energy of the molecules and the energy of their turbulent motion:
| (4) |
We derive , where is the observed line width of our ammonia data and m the mass of the ammonia molecule. The total line width of = 0.955 km s-1 is an upper limit, since it was derived from a gaussian fit of the whole maingroup. On the basis on the (1,1) spectrum presented in Fig. 6 it is unclear if the two peak components correspond to the resolved hyperfine structure transition, which would in term lower , or if the double peak is simply due to noise in the spectrum. The error of the kinetic temperature = 21.3 5 K is rather high, due to the low SNR in the (2,2) spectrum. Usually the kinetic gas temperatures in cold and dense regions are lower than the obtained dust temperatures. We therefore consider Tkin as an upper limit.
With the effective core radius of R = 0.2 pc we derive a gravitational potential of the homogenous ellipsoid (Liljeström 1991)
| (5) |
We find , and . Relative to the total kinetic energy sums up to 52 %. Neglecting external pressure and magnetic energy for which we have no data at present, we conclude that the cold core is roughly in virial equilibrium. If it will collapse or not, either as a whole or in fragments, will depend mainly on the local turbulent velocity field. Further molecular line data of sufficiently high spatial resolution are needed to assess the collapse issue. Tab. 7 summarizes the properties of the cold core region.
| Mass | 50 10 | M⊙ |
| Dust Temperature | 12 2 | K |
| Size | 0.55 0.29 | pc2 |
| Visual extinction AV | 30 | mag |
| Column density n(H2) | 2.2 | cm-2 |
| Density N(H2) | 2 | cm-3 |
| Gravitational energy | 6.4 | J |
4.2 The nature of the two cold submillimeter sources SMM1 and SMM3
Phenomenologically, the youngest protostars (Class 0 objects) are characterized by three attributes (André et al. 1993):
-
1.
Very little emission at m,
-
2.
Spectral energy distribution similar to a blackbody of T 15-30 K and
-
3.
Lsubmm / Lbol 5 10-3, where Lsubmm is the luminosity measured at 350 m.
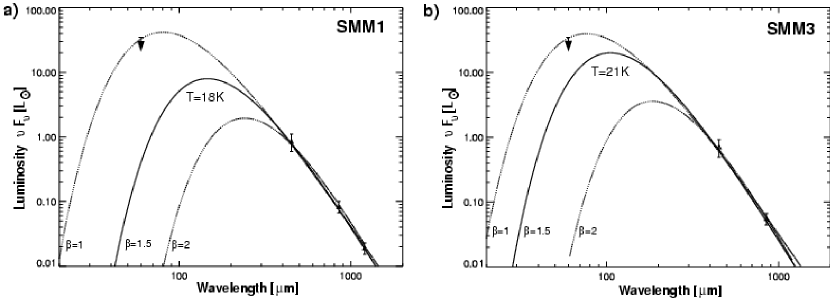
We suggest that SMM1 and SMM3 fullfil these criteria. SMM1 and SMM3 are not detected in the mid-infrared, making them candidates for the youngest protostellar objects in the vicinity of ISOSS J 20298+3559.
The spectral energy distributions of SMM1 and SMM3 are presented in Fig. 11. Relying only on our submillimeter photometry, the spectral energy distributions of both sources can be described by modified blackbodies with dust temperatures between 10 and 38 K. The large uncertainty of the temperature is mainly due to the unknown dust emissivity index which covers the range between 1.0 2.0 for protostellar objects and YSOs (Dent et al. 1998). To unambiguously determine the dust emissivity , measurements at the maximum or Wien part of the energy distribution are required.
Next we try to provide 60 m upper limits for SMM1 and SMM3, considering the flux of FIR1 minus that of main contributors. Due to confusion with large amounts of distributed cold dust detected by the large-beam IRAS 100 m and ISOPHOT 170 m bands, the photometry at these wavelengths can hardly be used for a reliable characterization of the two faint compact sources. The most stringent upper limit for SMM1 and SMM3 can be derived from the IRAS 60 m band. The photometry at this wavelength is however affected by the emission of very small dust particles, transiently heated in the reflection nebula of the Herbig B2 star IRS1. The presence of such extended PAH and VSG emission is indicated on our mid-infrared images of IRS1. The IRAS measurements at 12m, 25m and 60 m are particularly sensitive to such an extended emission component. In order to determine the contribution of thermal radiation of transiently heated PAH and very small grains in these bands we have used the three-phase dust models by Désert et al. (1990). After subtraction of compact emission from IRS1 according to our model (see next section), we determined the relative contributions of PAH and VSG emission from the residual IRAS 12m and 25m photometry and using the model by Désert et al. (1990) for the radiation field of a stellar source with Teff = 20 000K. We find a contribution of F60μm = 7 3 Jy from the Herbig star IRS1 and its reflection to the total flux density of F60μm = 14 Jy. The residual flux density of F60μm = 7 Jy is considered as an upper limit for each of the two sources.
Using the possible range 1.0 2.0 for the emissivity index, we derive total masses of 3.7 M⊙ M 18 M⊙ for SMM1 and 2 M⊙ M 8 M⊙ for SMM3.
The corresponding bolometric luminosities cover the range 36 L⊙ Lbol 1.8 L⊙ for SMM1 and 34 L⊙ Lbol 3.3 L⊙
for SMM3 respectively.
If we favor an intermediate emissivity index of 1.5, which was the average value found in the large submillimeter survey of 73 young stellar objects by Dent et al. (1998),
then we obtain for the two sources the following masses and luminosities:
SMM1: M = 8.0 M⊙, Lbol = 7 L⊙, Td = 18 K
SMM3: M = 3.3 M⊙, Lbol = 17 L⊙, Td = 21 K
We find Lsubmm / Lbol 1 % for each choice of 1.0 2.0, making SMM1 and SMM3 bona-fide candidates for Class 0 objects. Further evidence for SMM1 and SMM3 being genuine protostars could be provided via detections of a molecular outflow and/or a cm-wavelength continuum source.
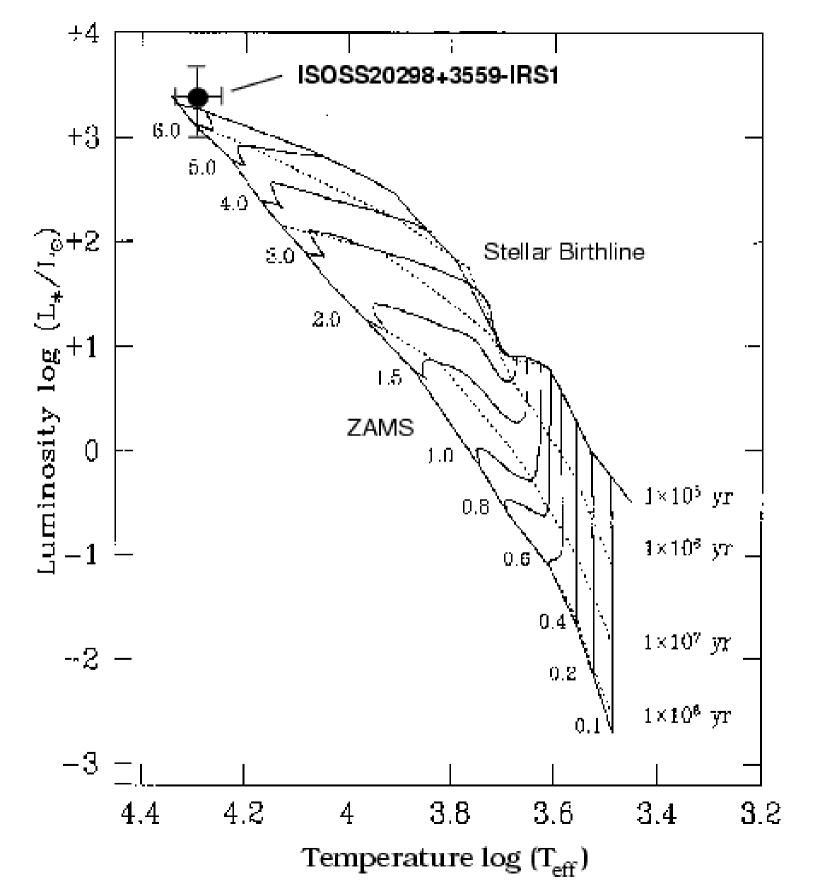
4.3 Evidence for accretion onto the extremely young Herbig B2 star IRS1
The Herbig B2e star IRS1 is the most luminous young stellar object embedded in the cold cloud complex. A very early evolutionary stage of IRS1 is indicated from its locus in the Hertzsprung-Russel diagram presented in Fig. 12. According to the pre-main-sequence evolutionary tracks by Palla & Stahler (1993) the source is located close to the stellar birthline computed for = 10-5 M⊙ yr-1 corresponding to a Mstar = 6.5 M⊙ star with an age of less than 40000 yr immediately after becoming optically visible.
The observation of inverse P Cygni profiles as shown by assymetric red and blue line components of the H I Balmer transitions presented in Fig. 13 provides evidence for ongoing mass infall in a magnetospheric accretion process (Edwards et. al 1994). From the redshifted absorption component in the Si II lines at 6347.1 Å and 6371.4 Å transitions shown in Fig. 9 we derive an infall speed of 110 10 km s-1.

Near-infrared photometry and our sub-arcsecond resolution mid-infrared images revealed the presence of strongly condensed (r 250 AU) warm dust in the immediate surrounding of IRS1. In order to model the optical and infrared spectral energy distribution of the heavily reddened source IRS1, a reliable determination of the extinction towards the source is essential. Based on the effective stellar temperature derived from our observations of photospheric He I lines, we apply a Kurucz model atmosphere with Teff = 20 000 K for the stellar photosphere. We assume solar metallicity. Our dereddened BVRI photometry is best described for AV = 6.1 0.3 mag where the error is due to the uncertainty of Teff. Assuming the distance d = 1.8 kpc of the cloud complex we derive a stellar radius of R⋆ = 4 0.5 R⊙ from the surface flux density of the Kurucz model. The integrated bolometric luminosity of the photosphere is L⋆ = 2200 600 L⊙.
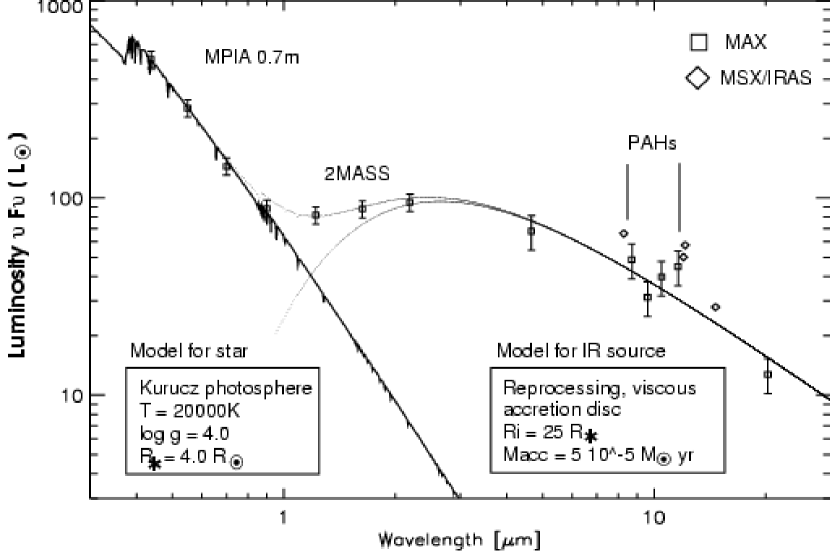
How can our observations of ongoing accretion and circumstellar dust for this extremely young stellar object be combined in a consistent model? Fig. 14 shows the dereddened spectral energy distribution of IRS1. The near-infrared emission bump seen at about 3 m wavelength is characteristic for Herbig AeBe stars and has been interpreted either by the presence of a circumstellar disk with an inner hole (Hillenbrand et al. 1992), by spherical envelopes (Hartmann et al. 1993) or the combination of both (Miroshnichenko et al. 1999). While there is general consensus that the Herbig Ae stars are surrounded by circumstellar disks similar to those of T Tauri stars during most of their pre-main-sequence phase (Natta et al. 2001), only one out of seven Herbig Be stars was detected by mm-interferometry (Natta et al. 2000). Extended halos and envelopes in the near- (Leinert et al. 2001) and mid-infrared (Prusti et al. 1994) are more frequently observed around more massive Herbig Be stars. However, these observational differences could be due to a faster evolution of massive stars and differences in the relative timescales of the PMS phases, which limit the detection of disks around early B stars to the very early stage of their evolution.
We suggest that our spectroscopic signatures of ongoing accretion and the infrared excess can best be combined in terms of an accretion disk around IRS1. We have calculated the spectral energy distribution of an active viscous accretion disk including radiative heating by photospheric radiation from IRS1. The radial temperature dependence of the optically thick, geometrically thin disk is then assumed to be . We use a standard -disk (Lynden-Bell & Pringle 1974). Its accretion disk temperature profile is given by
| (6) |
In the flat disk approximation its temperature profile due to irradiation only is
| (7) |
Emerging spectral energy distributions have been computed for varying inner disk radii Ri and accretion rates . As shown in Fig. 14 the fit of the star+disk SED to the dereddened photometry of IRS1 is consistent with a dusty, optically thick accretion disk. Tab. 8 summarizes the model parameters of the system.
| Mass | 6.5 1 | M⊙ |
| Luminosity | 2200 600 | L⊙ |
| Effective temperature | 20000 2500 | K |
| Radius | 4.0 0.5 | R⊙ |
| Visual extinction AV | 6.1 0.3 | mag |
| Age | 40000 | yr |
| Rotational velocity | 158 25 | km/s |
| Inner disk radius | 60.0 | R⊙ |
| Accretion rate | 5 10-5 | M⊙ yr-1 |
Next we consider whether our data could also allow an envelope: Our spectrophotometry of IRS1 obtained in the narrow-band silicate filter at 9.7 m shows a weak absorption feature ( 0.2 0.1) which is consistent with the total line-of-sight extinction towards the source according to Whittet el al. (1987). Models of spherical envelopes which account for the observed spectral energy distributions of Herbig Be stars all predict strong silicate emission (Berilli et al. 1992, Miroshnichenko et al. 1997). In order to explain the suppression of the silicate emission feature in a B0 star, the inner radius of the envelope must be about 0.02 pc (Natta et al. 2000). This is inconsistent with our diffraction-limited mid-infrared images, which show that the bulk of flux from IRS1 arises from a true point source, i.e. the radius of the mid-infrared emitting region is 400 AU.
4.4 Star formation efficiency
We estimate the star formation efficiency SFE = Mstars / Mtot in the central region ISOSS J 20298+3559-FIR1. Mtot includes the masses of the diffuse component, the dense core and all young stellar objects. We have determined the masses for the near-infrared objects IRS2..5 from the absolute magnitude-mass relation by Carpenter et al. (1993).
Concerning the masses of the Class 0 sources SMM1 and SMM3 we assume that they loose 50 % of their envelopes during their further evolution (Bachiller et. al. 1996). The mass of all young stellar objects is then Mstars= 20 M⊙. Adding the mass of gas and dust in FIR1 to the stellar masses we obtain Mtot = 140 M⊙. This results in a star formation efficiency of about 14 %.
To compare: The SFE is about 2-9 % for the Taurus complex (Cohen & Kuhi 1979) and 1-9 % in Orion A+B (Carpenter 2000). ISOSS J 20298+3559-FIR1 clearly has at least the efficiency of these low- and high-mass star forming regions.
5 Conclusions
We have identified the young star forming region ISOSS J 20298+3559 performing a cross-correlation of cold compact far-infrared sources from the ISOPHOT 170 m Serendipity Survey database with the 2MASS, MSX and IRAS surveys. Multi-wavelength follow-up observations of this region yield:
-
1.
The star forming region is associated with a complex of four optical dark clouds C1..C4 which have a total mass of 760 M⊙.
-
2.
We derived a distance of 1800 300 pc based on optical extinction data. This associates the region with the Cygnus X Giant Molecular Cloud in agreement with our molecular line kinematics.
-
3.
The cold ISOSS source FIR1 corresponds to the dense inner region of the central dark cloud C1 and contains a total mass of 120 M⊙ gas and dust with an average temperature of 16 K.
-
4.
We have identified two candidate Class 0 objects SMM1 and SMM3. The sources have masses of 8 and 3.5 M⊙ which makes them precursors of intermediate mass stars.
-
5.
The externally heated cloud core of C1 has a total mass of 50 M⊙ and a central dust temperature as low as 11K. Ammonia in the NH3(1-1) transition has been detected. The object is gravitationally bound as derived from our ammonia molecular line observations, which makes it a candidate massive pre-protostellar core.
-
6.
The most luminous object in the vicinity is the Herbig B2 star IRS1. The object has a mass of 6.5 M⊙ and a bolometric luminosity of 2200 L⊙. Inverse P Cygni profiles in the higher HI Balmer series and SiII lines indicate ongoing accretion. The spectral energy is well described by a Kurucz model for the stellar photosphere and a viscous reprocessing accretion disk. The stellar age inferred from pre-main-sequence evolutionary tracks is less than 40000 yr.
-
7.
Several embedded near-infrared sources have been identified. One of them (IRS7) is surrounded by a mid-infrared reflection nebula.
-
8.
The star formation efficiency in the dense and cold region FIR1 is about 14 %.
Acknowledgements.
We thank the referee, Debra Shepherd, for useful comments. The ISOPHOT Data Center at MPIA is supported by Deutsches Zentrum für Luft- und Raumfahrt e.V. (DLR) with funds of Bundesministerium für Bildung und Forschung, grant No. 50QI0201. OK thanks the Wernher von Braun-Stiftung zur Förderung der Weltraumwissenschaften e.V. for financial support. This study made use of the SIMBAD database operated at CDS, Strasbourg, France. HIRES images were provided by the Infrared Processing and Analysis Center. This publication makes use of data products from the Two Micron All Sky Survey, which is a joint project of the University of Massachusetts and the Infrared Processing and Analysis Center/California Institute of Technology, funded by the National Aeronautics and Space Administration and the National Science Foundation. This research made use of data products from the Midcourse Space Experiment, funded by the Ballistic Missile Defense Organization with additional support from NASA Office of Space Science.References
- (1) André, P., Ward-Thompson, D. & Barsony, M., 1993, ApJ 406, 122
- (2) Andrillat, Y., Jaschek, M., Jaschek, C., 1988, A&AS 72, 129
- (3) Auer, L.H. & Mihalas, D., 1973, ApJSS 223, 433
- (4) Bachiller, R., 1996, ARA&A 34, 111
- (5) Baars, J.W.M., Genzel, R., Pauliny-Toth, I.I.K. et al. 1977, A&A 61, 99
- (6) Berrilli, F., Cociulo, G., Ingrosso, G. et al., 1992, ApJ 398, 254
- (7) Bessel, M.S. & Brett, J.M., 1988, PASP 100, 1134
- (8) Beuther, H., Walsh, A., Schilke, P. et al., 2002, A&A 390, 289
- (9) Bogun, S., Lemke, D., Klaas, U. et al., 1996, A&A 315, L71
- (10) Bok, B.J., 1956, AJ, 61, 309
- (11) Cambrésy, L., Epchstein, N., Copet, E. et al., 1997, A&A 324, L5
- (12) Cambrésy, L., Beichman, C.A., Jarrett, T.H. et al., 2002, ApJ 123, 2559
- (13) Carpenter, J.M., Snell, R.L., Schloerb, F.P., 1993, ApJ 407, 657
- (14) Carpenter, J.M., 2000, AJ 120, 3139
- (15) Cesaroni, R., Felli, M., Testi, L., 1997, A&A 325, 725
- (16) Cohen, M. & Kuhi, L.V., 1979, ApJSS 41, 743
- (17) Cutri, R. M., et al. 2000, Explanatory Supplement to the 2MASS Second Incremental Data Release
- (18) Dame, T.M. & Thaddeus, P., 1985, ApJ 297, 751
- (19) Dent, W.R.F., Matthews, H.E., Ward-Thompson, D., 1998, MNRAS, 301, 1049
- (20) Désert, F.-X., Boulanger, F., Puget, J.L., 1990, A&A 237, 215
- (21) Dickman, R.L., 1978, AJ, 83, 363
- (22) Eagan, M.P., Price, S.D., Soshir, M.M. et al. 1999, Air Force Laboratory Technical report No. AFRL-VS-TR-1999-1522
- (23) Edwards, S., Hartigan, P., Ghandour, L. et al., 1994, AJ 108, 1056
- (24) Evans , N. J. Shirley, Y.L., Mueller, K.E. et al, 2002, in Proc.”Hot Star Workshop III: The earliest phases of massive star birth”, ed. P.A. Crowther, ASP Conference Series
- (25) Finkenzeller, U., 1985, A&A 151, 340
- (26) Schlegel, D.J., Finkbeiner, D.P., Davies, M., 1998, ApJ 500, 525
- (27) Gray, D.F., 1976, The observation and analysis of stellar photospheres (Wiley, New York)
- (28) Hamann, F. & Persson, S.E., 1992, ApJSS 82, 285
- (29) Harju, J. ,Walmsley, C.M., Wouterloot, J.G.A., 1993, A&AS 98, 51
- (30) Hartmann, L., Kenyon, S., Calvet, N., 1993, ApJ 407, 219
- (31) Herbig, G.H., 1960, ApJSS 4, 337
- (32) Herbst, W. & Sawyer, D.L., 1981, ApJ, 243, 935
- (33) Horne, K., 1986, PASP 98, 609
- (34) Robberto, M. & Herbst, T.M., 1998, SPIE 3354, 711
- (35) Hillenbrand, L.A., Strom, S.E., Vrba, F.J. et al., 1992, ApJ 397, 613
- (36) Holland, W. S., Robson, E.I., Gear, W.K. et al., 1999, MNRAS, 303, 659
- (37) Juvela, M., Mattila, K., Lehtinen, K. et al., 2002, A&A, 382, 583
- (38) Keel, W., 1991, PASP, 103, 723.
- (39) Kreysa, E. et al. 1998, Proc. SPIE, 3357, 319
- (40) Leinert, Ch., Haas, M.,Ábrahám, P. et al., 2001, A&A 377, 1098
- (41) Lemke, D., Klaas, U., Abolins, J., 1996, A&A 315, L64
- (42) Liljeström, T., 1991, A&A, 244, 483
- (43) Meyer, M.R., Calvet, R., Hillenbrand, L.A., 1997, AJ 114, 288
- (44) Miroshnichenko, A., Ivezic, Z. & Elitzur, M., 1997, ApJ 475, L41
- (45) Miroshnichenko, A., Ivezic, Z., Vinkovic, D. et al., 1999, ApJ 520, 115
- (46) Molinari, S., Testi, L., Brand, J., et al., 1998, ApJ 505, L39
- (47) Molinari, S., Brand, J., Cesaroni, R., et al., 2000, A&A 355, 617
- (48) Monet, D., 1996, BAAS, 28, 905
- (49) Myers, P.C., Benson, P.J., 1983, ApJ 266, 309
- (50) Natta, A., Grinin, V.P. & Mannings, V., 2000, in Protostars and Planets IV, ed. V. Mannings, A.P. Boss & S.S. Russell (Tuscon: Univ. of Arizona Press), 559
- (51) Natta, A., Prusti, T., Neri, R. et al., 2001, A&A 371, 186
- (52) Odenwald, S. & Schwartz, P., 1993, ApJ 405, 706
- (53) Ossenkopf, V. & Henning, Th., 1994, A&A 291, 943
- (54) Palla, F., Brand, J., Comoretto, G. et al., 1991, A&A 246, 249
- (55) Palla, F. & Stahler, S., 1993, ApJ 418, 414
- (56) Palla, F., Stahler, S. W., 1999, ApJ 525, 772
- (57) Price, S.D. et al. 2001, AJ 121, 2819
- (58) Prusti, T., Natta, A., Palla, F., 1994, A&A 292, 593
- (59) Pudritz, R.E., 2002, Science 295, 68
- (60) Rieke, G.H. & Lebofsky, M.J., 1985, ApJ 288, 618
- (61) Robin, A., Creeze, M., 1986, A&A, 157, 71
- (62) Savage, B.D. & Mathis, J.S., 1979, ARA&A, 17, 73
- (63) Shepherd, D. S., Yu, K. C., Bally, J. et al, 2000, ApJ 535, 833
- (64) Sodroski, T. J., Odegard, N., Arendt, R. G. et al., 1997, ApJ 480, 173
- (65) Stetson, P.B., 1987, PASP 99, 191
- (66) Stickel, M., Lemke, D., Klaas, U. et al., 2000, A&A 359, 865
- (67) Thé, P.S., de Winter, D., Pérez, M.R., 1994, A&ASS 104, 315
- (68) Ungerechts, H., Umbanhowar, P., Thaddeus, P., 2000, ApJ 537, 221
- (69) Walmsley, C.M., Ungerechts, H., 1983, A&A 122, 164
- (70) Ward-Thompson, D.; Andr , P.; Kirk, J. M., 2002,MNRAS, 329, 257
- (71) Whittet, D., Bode, M.F., Murdin, P., 1987, VA 30, 135
- (72) Wood, D.O.S., Churchwell, E., 1989, ApJ 340, 265