Efficient radiative transfer in dust grain mixtures
Abstract
The influence of a dust grain mixture consisting of spherical dust grains with different radii and/or chemical composition on the resulting temperature structure and spectral energy distribution of a circumstellar shell is investigated. The comparison with the results based on an approximation of dust grain parameters representing the mean optical properties of the corresponding dust grain mixture reveal that (1) the temperature dispersion of a real dust grain mixture decreases substantially with increasing optical depth, converging towards the temperature distribution resulting from the approximation of mean dust grain parameters, and (2) the resulting spectral energy distributions do not differ by more than 10% if grain sizes are considered which justifies the mean parameter approximation and the many results obtained under its assumption so far. Nevertheless, the dust grain temperature dispersion at the inner boundary of a dust shell may amount to 100 K and has therefore to be considered in the correct simulation of, e.g., chemical networks.
In order to study the additional influence of geometrical effects, a two-dimensional configuration – the HH 30 circumstellar disk – was considered, using model parameters from Cotera et al. (2001) and Wood et al. (2002). A drastic inversion of the large to small grain temperature distribution was found within the inner of the disk.
1 Introduction
The simulation of spectral energy distributions (SEDs), images, and polarization maps of young stellar objects has become a profound basis for the analysis and interpretation of observing results. Many techniques and approximations for the solution of the radiative transfer (RT) problem in different model geometries (1D–3D), considering more and more special physical processes, such as the stochastic and photo-electric heating of small grains (see, e.g, Draine & Li 2001; Bakes & Tielens 1994, Siebenmorgen, Krügel, & Mathis 1992), scattering by spheroidal grains (see, e.g., Wolf, Voshchinnikov, & Henning 2002; Gledhill & McCall 2000), or the coupling of line and continuum RT (see, e.g., Rybicki & Hummer 1992), have been developed. The simulation of the temperature structure in simple-structured circumstellar shells or disks (see, e.g., Malbet, Lachaume, & Monin 2001; Chiang et al. 2001), the estimation of the properties (luminosity, temperature, mass) of heavily embedded stars (see, e.g., Kraemer et al. 2001), or the determination of the inclination of a circumstellar disk (see, e.g., Chiang & Goldreich 1999; Men’shchikov, Henning, & Fischer 1999; Wood et al. 1998) represented modest, first attempts of the application of the existing sophisticated numerical techniques. More recent efforts are directed to derive the dust grain size distribution in a circumstellar disk from its SED (Wood et al. 2002; D’Alessio, Calvet & Hartman 2001). Thus, it is clear that beside strong observational constrains, the model parameters and considered physical processes have to be questioned in depth in order to derive such detailed conclusions. However, looking behind the scenes, many of the RT models are based on simplifying assumptions of very basic processes such as isotropic instead of anisotropic scattering, mean dust parameters representing dust grain ensembles (different radii and chemical compositions), or the flux-limited diffusion approximation - approximations which are well-suited for handling the energy transfer in hydrodynamic simulations or a rough data analysis but which may not necessarily guarantee the desired accuracy for a detailed SED and image/polarization data analysis.
In the advent of (space) observatories such as SIRTF111Space Infrared Telescope Facility, which will be able to obtain SEDs of evolved debris disks around young stars, there exists a strong need for adequate numerical RT techniques in order to allow to trace dust grain growth (Meyer et al. 2001) and the influence of other physical effects and processes such as the Poynting-Robertson effect (see, e.g., Srikanth 1999) and dust settling (Dubrulle, Morfill, & Sterzik 1995, Miyake & Nakagawa 1995) on the dust grain size distribution in these disks. Therefore, we clearly have to understand which influence the different approximations (as long as they are required) in the RT simulations may have on the resulting observables. Based on two different grain size distributions consisting of astronomical silicate, the differences in the resulting dust grain temperature distributions and the resulting SEDs between simulations of the RT in (A) a “real” dust grain mixture and (B) under the assumption (approximation) of mean dust grain parameters will be discussed. This investigation is therefore mainly focused on two questions: (1) Of what order of magnitude are the differences (?) and (2) How many grain sizes have to be considered to represent the properties of a real grain size distribution? The spatial temperature distribution of the considered dust configurations is calculated on the basis of local thermal equilibrium. Stochastic heating processes which are expected in case of very small grains consisting of tens to hundreds of atoms (see, e.g., Draine & Li 2000 and references therein) are not subject of this investigation.
In Sect. 2, the RT and the dust grain model are briefly introduced. In Sect. 3, the definition of the mean dust grain parameters is given and the expected deviations of the RT results – once based on the mean dust parameters and once on a real grain size distribution – are outlined. In Sect. 4, the RT in a spherical shell with variable optical depth and density distribution (see Sect. 4.1) is considered, while the temperature structure in a model of the HH 30 circumstellar disk is investigated in Sect. 4.2. The SED resulting from a models with a dust grain mixture is compared to the mean particle approximation in Sect. 5.
2 Radiative transfer and Dust model
The RT simulations presented in this article have been performed with the three-dimensional continuum RT code MC3D which has been described by Wolf & Henning 2000 (see also Wolf, Henning, & Stecklum 1999; Wolf 2002). It is based on the Monte-Carlo method and solves the RT problem self-consistently. Instead of the iterative procedure of estimating the dust temperature distribution (as described in Wolf et al. 1999), the concept presented by Bjorkman & Wood (2001), which is based on the immediate correction of the dust grain temperature after absorption of a photon package, has been used. Furthermore, the method described by Lucy (1999), which takes into account the absorption not only at the points of interaction of the photons with the dust grains but also in-between, has been applied. While the first method allows to simulate the RT for optical depths222Throughout the whole article the quantity refers to the optical depth based on the extinction cross section of the dust grains at a wavelength of 550 nm. , the second was used in order to increase the efficiency of the simulation for low optical depths. In addition to the test of MC3D described by Wolf et al. (1999) considering a single grain size, it has been successfully tested for the case of dust grain mixtures against the one-dimensional code of Chini et al. (1986).
The RT is simulated at separate wavelengths within the wavelength range [, ]. For this reason, the radiation energy of the emitting source(s) is partitioned into so-called weighted photons (Fischer, Henning, & Yorke 1999) each of which is characterized by its wavelength and Stokes vector . In order to consider dust grain ensembles instead of a single grain species, the RT concept as described by Wolf et al. (1999), Lucy (1999), and Bjorkman & Wood (2001) has to be extended in the following manner:
-
1.
The mean free path length between the point of emission and the point of the first photon-dust interaction (and - subsequently - between two points of interaction) is given by
(1) (2) Here, is the optical depth along the path of the length , is the corresponding numerical accumulated optical depth (), is the number of chemically different dust grain species, is the number of particle radii being considered, and is the spatial coordinate corresponding to the th integration point along the path length . The quantity is the number density at the spatial coordinate , the quantity is the extinction cross section, and is the number of integration points along the path. Furthermore, is a random number uniformly distributed in the interval .
-
2.
According to the concept of immediate reemission described by Bjorkman & Wood (2001), at each point of interaction of a photon with a dust grain either scattering or absorption occurs. The probability for a photon to undergo the one or the other interaction process with a grain with the chemical composition # and the particle radius # is given by
(3) where ’’ stands either for absorption or scattering. In case of absorption, the immediate reemission occurs from the same dust grain (species).
-
3.
In Lucy’s concept (1999), which considers the absorption of the electromagnetic radiation field not only at the end points of the photon path (points of interaction) but also in-between, simply the absorption due to all dust grain species (instead of only one) has to be taken into account:
(4)
The investigations presented in this paper are based on dust grain ensembles with different grain size distributions but the same chemical composition. Since the formalism (and therefore at least the qualitative conclusions) are the same for ensembles consisting of grains with different chemical composition or size distribution or even both, this restriction is justified. The optical properties of astronomical silicate (Draine & Lee 1984) for [A] a size distribution of small grains with radii m and [B] a size distribution of larger grains with radii m have been used in Sect. 3, 4.1, and 5.
The grains are assumed to be spherical with a size distribution described by the widely applied power law (Mathis, Rumpl, & Nordsieck 1977). The optical properties such as the extinction and scattering cross sections as well as the scattering distribution function have been derived on the basis of Mie scattering, using the Mie scattering algorithm published by Bohren & Huffman (1983). The correct (anisotropic) scattering distribution function (for each dust grain size) has been considered in the RT process.
3 Mean dust grain parameters
In case of non-self-consistent RT in a dust grain mixture, the numerical effort (finally, the computing time and RAM requirement) may be substantially decreased by assuming weighted mean values of those parameters which describe the interaction of the electromagnetic field with the dust grains: the extinction, absorption, and scattering cross section, the Stokes parameters, and – as as function of the extinction and scattering cross section – the Albedo.
The weight , which represents the contribution of the th component of the dust grain mixture, results from the abundance of this component in respect of its dust grain number density (assuming chemically different dust species) and the size distribution of the respective material:
| (5) |
where and are the minimum and maximum grain radius of the size distribution. The Stokes parameters as well as the extinction, absorption, and scattering cross section (, , ) are additive. Therefore, the representative values in case of a dust grain mixture can be derived on the basis of their weighted contributions (see, e.g., Martin 1978, S̆olc 1980):
| (6) |
| (7) |
| (8) |
and
| (9) |
where is the Mueller matrix which is used to describe the modification of the photon’s Stokes vector due to the interaction of a photon with the scattering/absorbing medium (dust grains; see Bickel & Bailey 1985, Bohren & Huffman 1983). For the albedo follows:
| (10) |
Since this formalism (Eq. 5-10) covers both grain size and chemical distributions, the conclusions to be derived for a grain size distribution but a single chemical component is also valid for grain ensembles consisting of grains with different chemical compositions. The mean dust grain parameters used in the following sections have been derived on the assumption of grain radii equidistantly distributed in the grain size range of the small/large grain ensemble.
In thermal equilibrium, the temperature of a dust grain (th grain size or composition) can be estimated from the assumption of local energy conservation. If
| (11) |
is the energy being absorbed by the th dust grain component during the time interval , then the local energy conservation can be written as
| (12) |
where is the total amount of energy being re-emitted during the time interval , and are the monochromatic absorbed/re-emitted luminosity at the wavelength , is the absorption efficiency and is the Planck function of the grain with the temperature . For two particles of the same composition but different radii (, ) the temperature is consequently only the same if
| (13) |
This is usually not the case. Thus, mean dust grain parameters may be used only in case of the simulation of dust scattering but not for the estimation of the dust grain temperature distribution and resulting observables, such as the spectral energy distribution and images in the mid-infrared to millimeter wavelength range.
In the following Sections (§4 and §5) it will be investigated under which conditions the approximation of the mean dust grain parameters provides nevertheless a good estimate for these observables. While the most crucial information can be derived on the basis of a one-dimensional model (§4), the study presented in §5 is aimed to reveal the influence of geometrical effects in case of two-dimensional disk-like structures. In each case, typical parameters for both the dust grain composition (see §2) and the circumstellar shells/disks are considered.
4 Temperature Distribution
4.1 Basic Model: Spherical Shell
In order to reveal the differences between the results of the RT based on real dust grain size distributions and the approximation of mean dust grain parameters representing the weighted mean optical parameters of the grain size distribution, a simple-structured but in respect of the astrophysical applications very useful model has been used for the following investigations. It consists of a spherical shell (outer radius: AU; inner boundary: AU) with a radial density profile described by a power law, , where is a negative, constant quantity. The dust grain size distribution is assumed to be constant throughout the whole shell. The only heating source is an embedded, isotropically radiating star in the center of the shell with an effective temperature and radius identical to that of the Sun.
In order to study the influence of multiple scattering and (additional) heating due to the dust reemission, the optical depth of the shell (as seen from the star) and the exponent , describing the relative density gradient in the shell, have been considered as variable parameters of the model. Four values (-1.0, -1.5, -2.0, and -2.5) for the exponent were chosen, covering a broad range of astrophysical objects ranging from circumstellar shells (see, e.g., Chini et al. 1986, Henning 1985, Yorke 1980) and disks (see, e.g., Men’shchikov & Henning 1997, Sonnhalter et al. 1995, Lopez et al. 1995) to the radial density profile being assumed for the dust density distribution in AGN models (see, e.g., Manske et al. 1998, Efstathiou & Rowan-Robinson 1995, Stenholm 1994). The optical depth was varied from the optical thin case (=0.1) to the case of intermediate optical depth () and finally to as the optically thick case. For optical depths below this interval no remarkable differences to the case are expected since multiple scattering and reemission have a negligible influence on the dust grain temperature which is determined only by the distance from the star (attenuation of the stellar radiation field) and the absorption efficiency of the dust grains. For optical depths preparatory studies have shown that the temperature difference between the different dust grains becomes negligible, converging towards the temperature distribution obtained on the basis of the mean dust grain approximation. This finding is in agreement with results obtained by Krügel & Walmsley (1984 – investigation of dust and gas temperatures in dense molecular cores), Wolfire & Churchwell (1987 – study of circumstellar shells around low-mass, pre-main-sequence stars), and Efstathiou & Rowan-Robinson (1994 – multi-grain dust cloud models of compact H II regions). Furthermore, only the inner region of the circumstellar shell shows a broad distribution of dust grain temperatures at a given distance from the star.
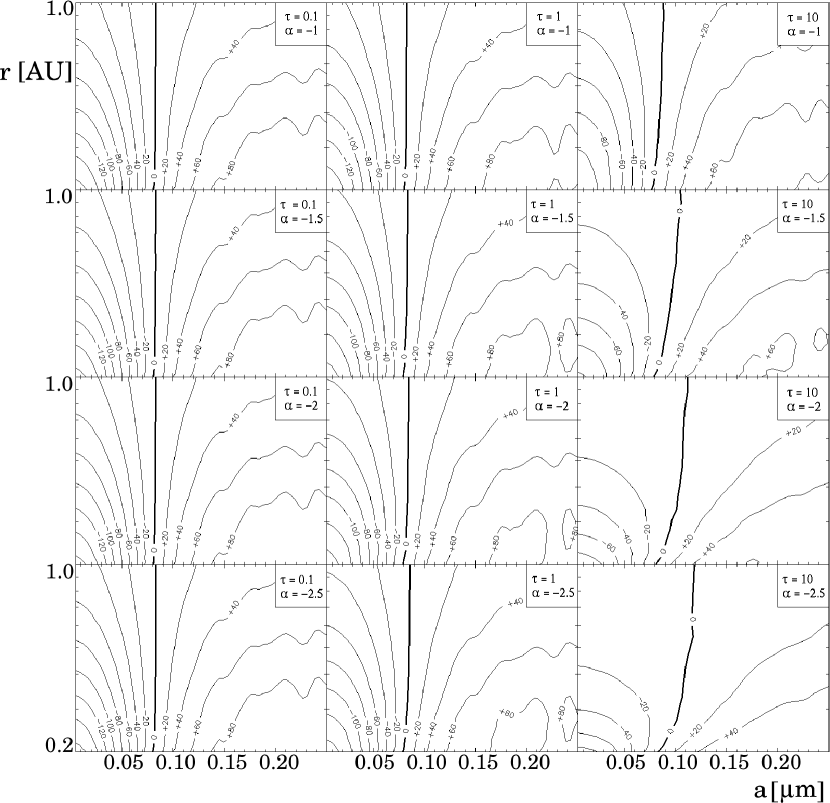
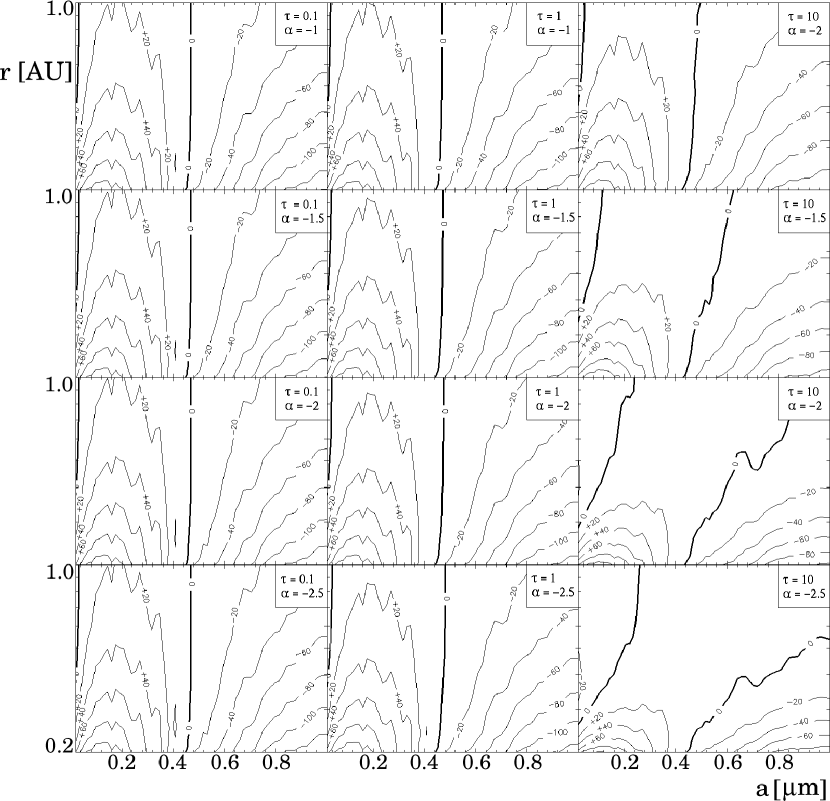
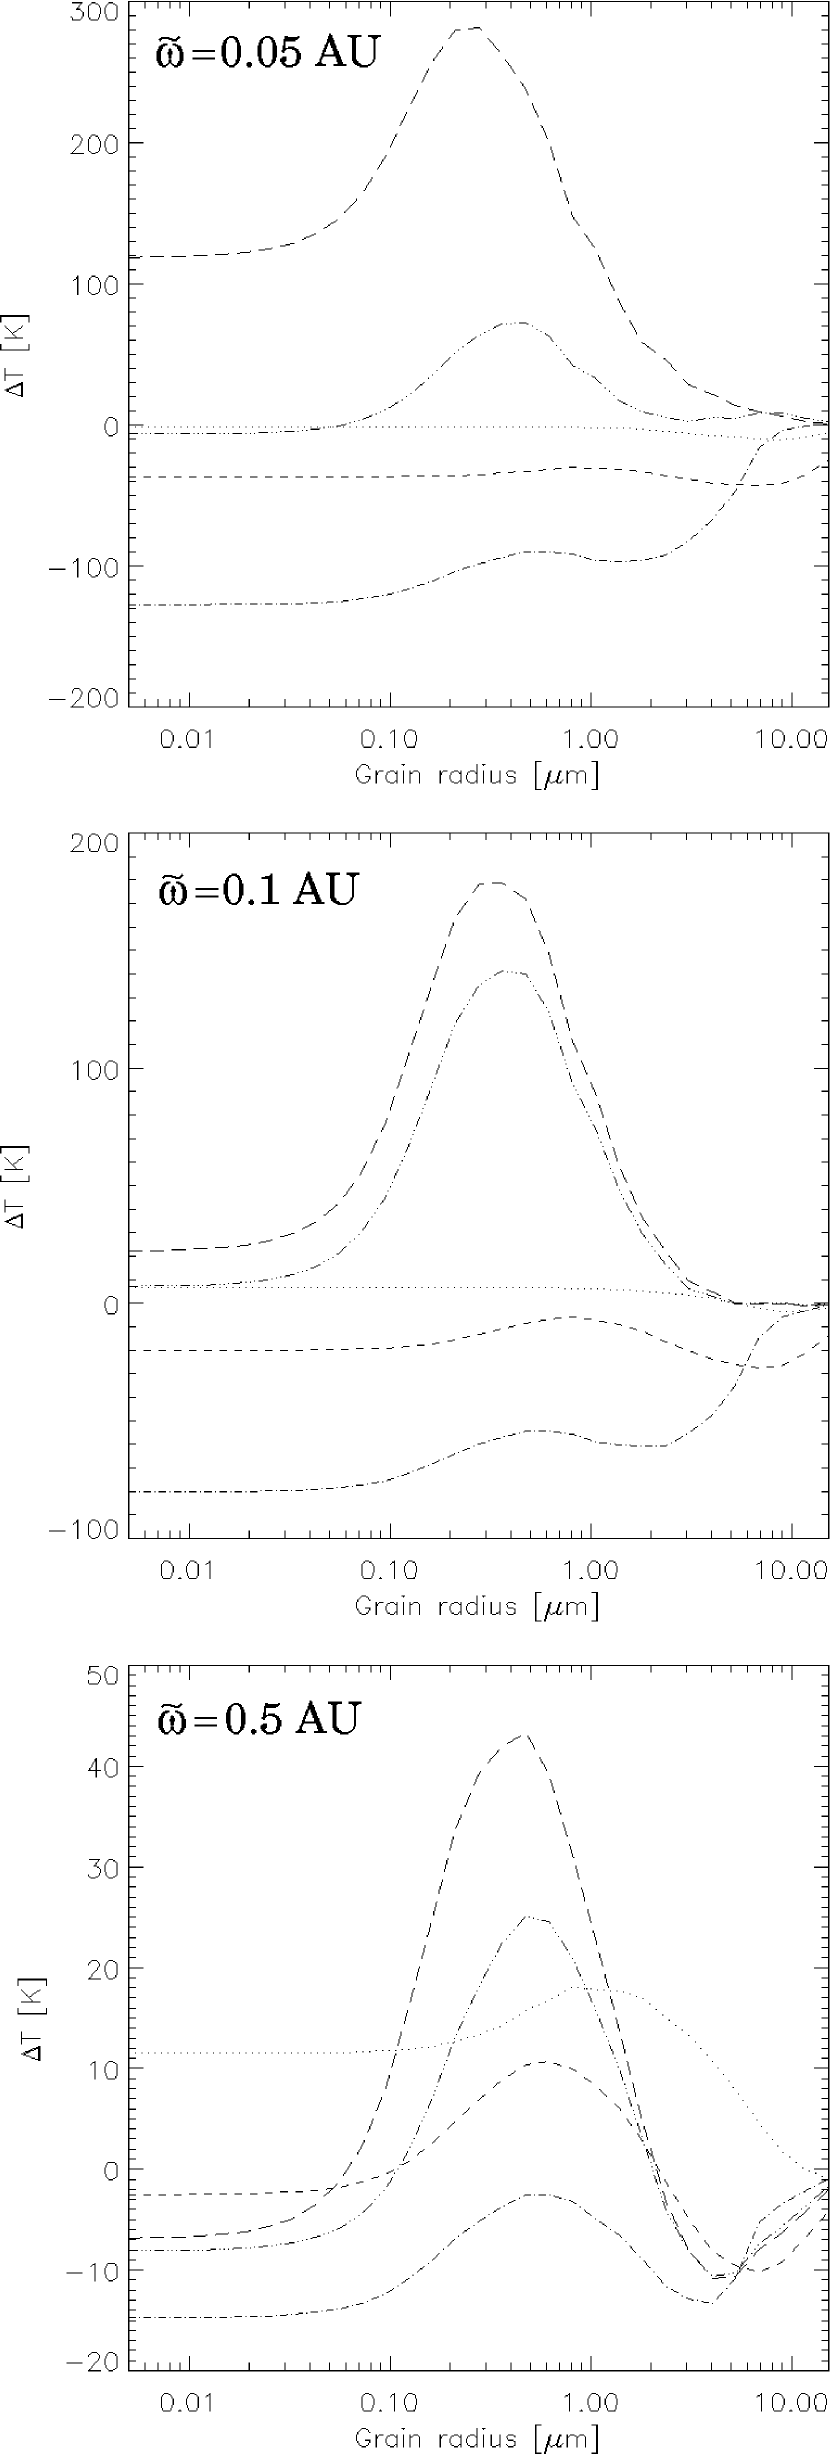
In Fig. 1 and 2 the differences between the radial temperature distribution of the single dust grains and that resulting from the approximation of mean dust grain parameters is shown from the inner boundary of the shell to a distance of 1 AU from the star. The main results are:
-
1.
The temperature of the different grains spans a range of K (% of the corresponding mean temperature) around the temperature of the mean grains at the inner boundary of the shell.
-
2.
The temperature difference decreases
-
•
towards larger distances from the star, and
-
•
with increasing optical depth as soon as the shell becomes optically thick.
-
•
-
3.
The relativ density gradient, described by the exponent is of minor importance. However, an increase of the absolute amount of this exponent results in an increased redistribution of energy between the different dust grain components at the inner boundary of the shell () and therefore in a decrease of the temperature dispersion.
-
4.
The difference () strongly depends on both the absorption efficiency, and thus on the dust grain size distribution, and the temperature of the heating source since the combination of these parameters determines the amount of energy being absorbed. This is clearly illustrated by the different signs of the temperature difference of the large and the small grain size distribution to the temperature of the mean grains shown in Fig. 1 and 2.
The found complex, highly dispersed temperature structure in a dust grain mixture requires a large number (here: ) of considered grain radii to be correctly taken into account and cannot be adequately represented by a mean particle. This finding is of special interest for the simulation of chemical networks, since the existence of ice layers, the possibility of a certain reaction on the grain surface, surface reaction rates, and the temperature of the surrounding gas phase depend on the dust grain temperature (see, e.g., Cazaux & Tielens 2002, Markwick et al. 2002, Charnley 2001). The dust phase in the close stellar environment is of particular importance, since the chemical evolution takes place here on its smallest timescale. Furthermore it was found, that the approximation of mean particle properties is found to be justified for dust configurations of high () optical depth.
4.2 HH 30 circumstellar disk
Although all basic characteristics of the temperature structure in a dust grain mixture can be studied on the basis of a one-dimensional model (Sect. 4.1), a disk-like structure will be considered in the following. The motivation for this is to investigate the possible influence of geometrical effects which have been minimized in case of the spherical shell. Furthermore, two-dimensional models are of particular importance since they are widely applied in simulations of circumstellar disks, debris disks around evolved stars, active galactic nuclei, and galaxies (see, e.g., Chiang & Goldreich 1997, 1999; see also the references in Sect. 4.1).
In the following, a model of the nearly edge-on disk around the classical T-Tauri star HH 30 is considered (see, e.g., Burrows et al. 1996 for observational details). Following Cotera et al. (2001) and Wood et a. (2002), a flared geometry as described by Shakura & Sunyaev (1973) is adapted:
| (14) |
where is the radial coordinate in the disk midplane, is the density at the stellar surface, and the scale height increases with radius:
| (15) |
In order to reproduce the high density (and therefore temperature) gradient in the inner region of the disk, a very high resolution of the model both in radial and vertical direction has been applied. The smallest resolved structure at the inner radius of the disk has a linear extent of about 29 % both in vertical and radial direction. As for the SED modelling performed by Wood et al. (2002), the following values have been used: stellar radius , stellar effective temperature , , , , inner radius of the disk , and the outer radius of the disk amounts to 200 AU. In contrast to the simulations presented by Cotera et al. (2001) and Wood et al. (2002), only one chemical dust grain component (astronomical silicate as in Sect. 4.1) has been chosen in order to simplify the simulation analysis. The size distribution is specified using a power law with exponential decay:
| (16) |
(see, e.g., Kim et al. 1994). Following Cotera et al. (2001), a maximum grain size has been chosen (other parameter values: , ). A total number of 32 grain sizes with radii equidistantly distributed on a logarithmic scale between 0.05 and 20 are considered. The visual extinction of the disk amounts to at an inclination of (see Wood et al. 2002, Tabl. 2). The RT simulations have been performed on the basis of the model geometry shown in Fig. 6[B] in Wolf, Henning, & Stecklum 1999. While the star could be assumed to be point-like in the one-dimensional model (§4.1), its real extend has to be taken into account now. The radiation characteristic at each point of the stellar surface is described by a law (star without limb-darkening; see Wolf 2002 for details).
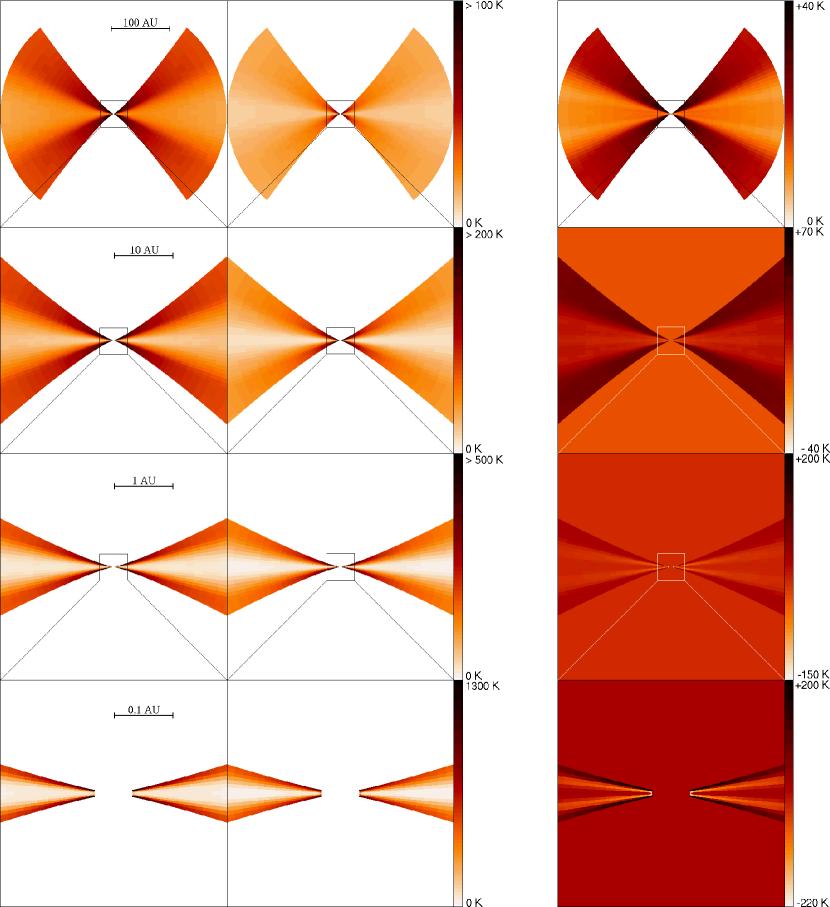
The resulting temperature distribution for two selected grain sizes ( and ) and their difference are shown in Fig. 3. On the largest, 10–100 AU scale the temperature of the small grains is up to 40 K higher than that of the large grains in the optically thin atmosphere above/below the disk. In agreement with the results found in optically thick spherical shells, the temperature difference decreases towards the optically extremly thick midplane where it amounts to only a few Kelvin.
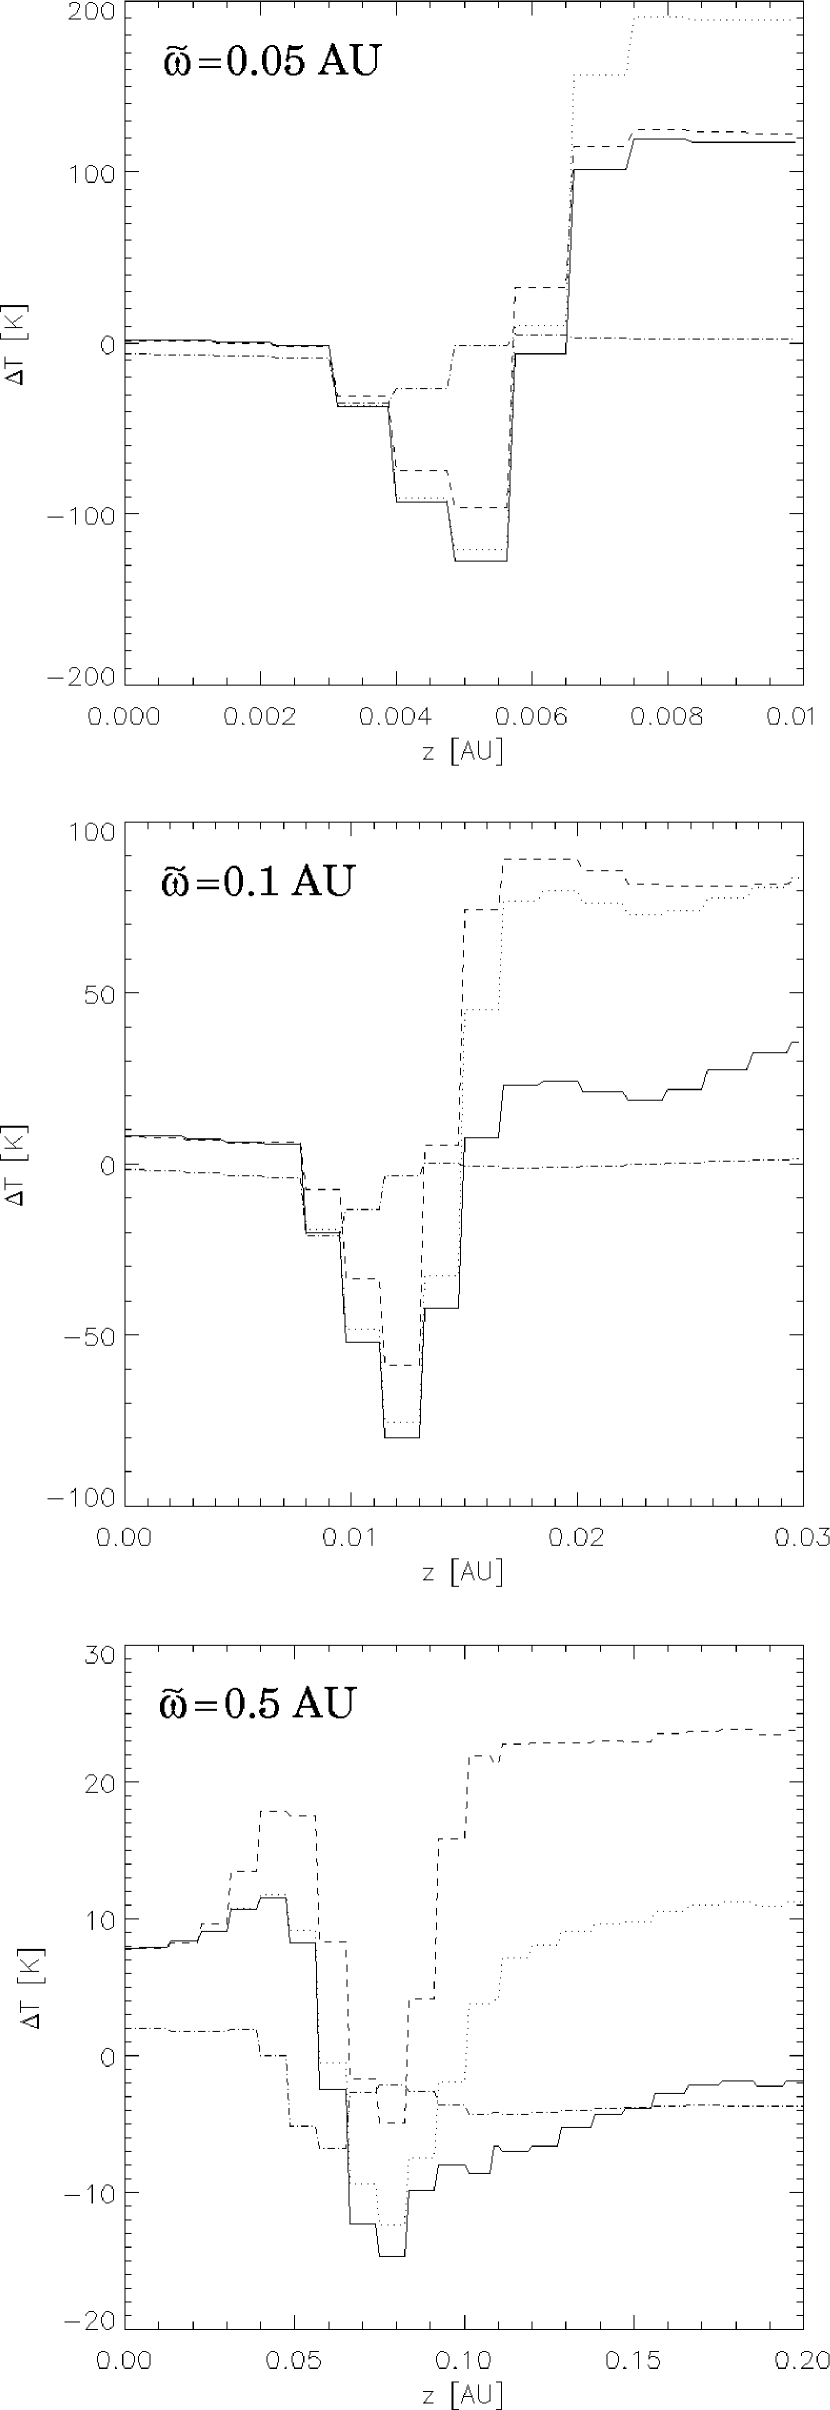
However, the vertical temperature structure shows a more complex behaviour in the inner region of the disk, on a size scale of a few AU and smaller. Here, an inversion of the temperature difference in the upper layer of the optically thick disk occurs, i. e., the large grains are substantially warmer than the small grains. This remarkable effect can be explained by the more efficient heating of large grains by the mid-infrared to far-infrared reemission of the hot inner disk. This explanation is also supported by the comparison of the vertical temperature structure obtained at different distances from the star333In order to obtain the spatially high-resolved temperature distributions shown in Fig.4 and 5 on a PC with 1 GByte RAM, the RT has been simulated only in the inner disk region with a diameter of 8.8 AU, which is one to two orders of magnitude larger than the regions considered in the following discussions. The comparison with the results obtained on a temperature grid with a lower resolution (Fig. 3) showed that the resulting differences in the spatial temperature distribution is in the order of or smaller than the statistical noise of the results and therefore negligible.: Fig. 4 shows the difference between vertical temperature distribution of grains with increasing radii (, 0.1 , 1.1 , 9.0 ) and grains. Furthermore, Fig. 5 shows the temperature difference as a function of the grain radius and radial distance from the star at different distances from the midplane. While at a radial distance of 0.05 AU the temperature of the 20 m grains is about 130 K higher than that of grains in the “inversion layer”, the amount of this temperature difference drops to less than at a radial distance of 0.5 AU from the star (see Fig. 4). Consequently, the vertical extent and location of the minimum of the temperature inversion region depends on the particular grain size (and the vertical density distribution in the disk). For instance it was found that the minimum of the distribution shown in Fig. 4 is shifted towards smaller distances from the midplane in all three considered cases (=0.05 AU, 0.1 AU, and 0.5 AU). According to the explanation of the temperature inversion given above, a similar shift of the minima of the difference temperature distribution is expected in case of the other grain sizes (0.01 to 1.1 ) as well. However, the spatial distribution of the simulated temperature distribution is too low to allow the verification of this assumption.
5 Spectral Energy Distribution
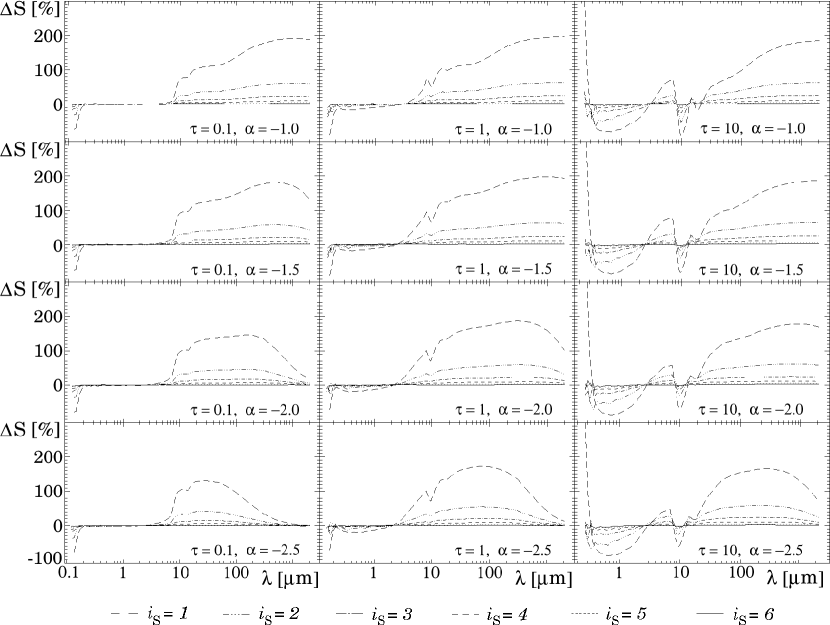
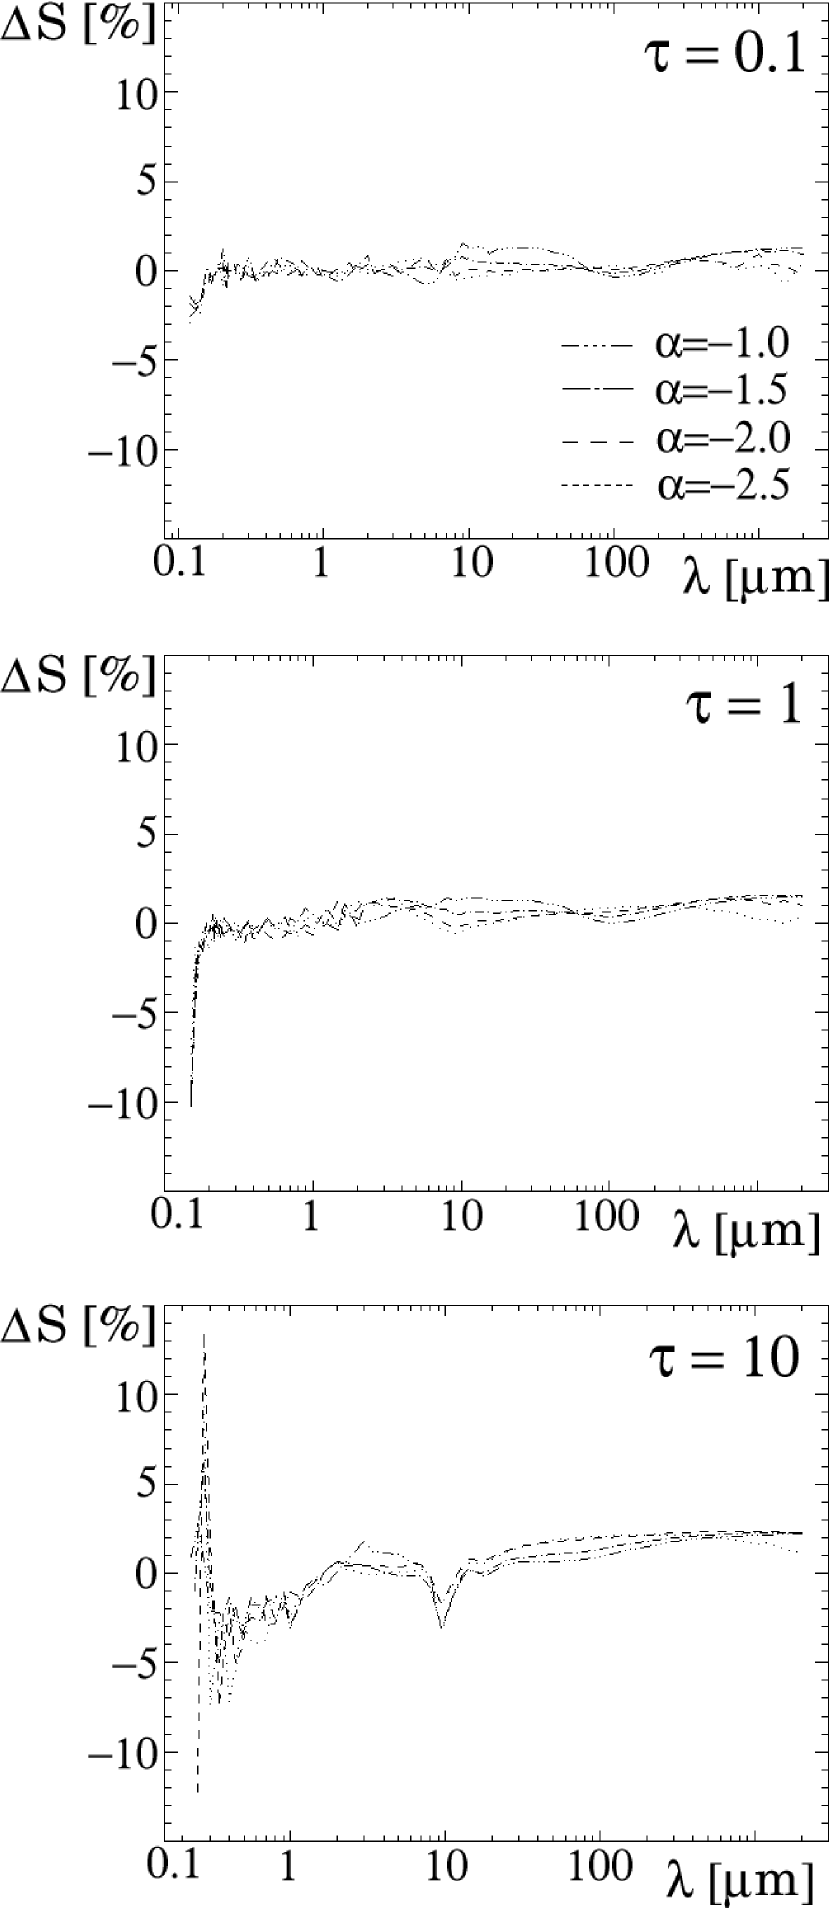
Based on the dust grain temperature distribution shown in Fig. 1, the spectral energy distribution (SED) for the different (spherical) shells have been calculated assuming () different grain sizes. The relative difference
| (17) |
is shown in Fig. 6 and 7. Here, represents the SED of the real grain size distribution, and is the SED resulting from the approximation of mean dust grain parameters.
As Fig. 6 illustrates, the results of the real grain size distribution converges towards the results based on the approximation of mean dust grain parameters. As it also shows, a minimum of to grain sizes have to be considered to achieve deviations of less then . If too few single grain sizes are considered, the SED does not represent the observable SED of the real grain size distribution sufficiently but drastically overestimates
-
1.
The absorption of the stellar radiation (and therefore underestimates the visual to near-infrared SED),
-
2.
The depths of the absorption bands in general (as the silicate absorption feature at m demonstrates), and
-
3.
The dust reemission spectrum in the near-infrared to millimeter wavelength range.
While the different absorption behaviour influences the temperature structure and overall SED in general, the influence of the different scattering behaviour depends on the optical depth. In the optically thin case, differences in the scattering behaviour result mainly in deviations of the short wavelength region of the stellar SED. At higher optical depth, the scattering behaviour has direct influence on the energy transfer in the dust envelope and thus on the temperature structure and the near- to far-infrared wavelength range as well. However, this effect is of importance only at intermediate optical depths (), since for even higher optical depths the temperature structure, at least in case of a one-dimensional dust configuration, tends not to depend on the description of the dust grain ensemble (real dust grain size distribution / approximation of mean dust grain parameters).
6 Conclusions
In simulations of the radiative transfer in the circumstellar environment of young stellar objects it has been widely established to use mean values for those parameters which describe the interaction of the electromagnetic field with the dust grains (see, e.g., modelling efforts by Calvet et al. 2002: circumstellar disk around the young low-mass star TW Hya; Cotera et al. 2001 and Wood et al. 2002: circumstellar disk around the classical T Tauri star HH 30; Fischer, Henning, & Yorke 1994, 1996: polarization maps of young stellar objects). A main reason for this is given by the fact that the consideration of a large number of single grain sizes and chemically different grain species results in a nearly linearly increasing amount of required computer memory in order to store the separate temperature distributions. Furthermore, the calculation of the spatial temperature distribution for all grains of different sizes and chemical composition requires significantly more computing power since (a) the heating by the primary sources (e.g., the star embedded in a circumstellar envelope) has to be performed independently for each grain species, and (b) the number of computing steps required to model the subsequent mutual heating of the different dust grain species due to dust re-emission scales even as , where is the number of chemically different components and is the number of separate dust grain radii considered. While these simulations are feasible in case of one-dimensional models (see, e.g., Chini, Krügel, & Kreysa 1986 and Efstathiou & Rowan-Robinson 1994: Dust emission from star forming region; Krügel & Siebenmorgen 1994 and Siebenmorgen, Krügel, & Zota 1999: Radiative transfer in galactic nulei) or simple-structured two-dimensional models (Men’shchikov & Henning 1997: Circumstellar disks; Efstathiou & Rowan-Robinson 1994: Disks in active galactic nuclei), it is hardly possible to handle two- and three-dimensional models with high density gradients and/or high optical depth which require high-resolution temperature grids.
In this study, the difference between the results of RT simulations based (a) on a mean dust grain parameter approximation and (b) real dust grain size distributions have been investigated. Based on a one-dimensional density distribution it was found that the temperature structure of a real grain size distribution shows a very complex behaviour in the inner, hot region of the shell depending on (1) the grain size distribution, (2) the effective temperature of the embedded star and the optical depth and therefore on the density distribution. However, the relative difference between the SED based on a real dust grain size distribution on the one hand and the approximation of mean dust grain parameters on the other hand was found to be smaller than about 10% if a minimum number of to grain sizes have been considered.
As the temperature structure in a circumstellar disk – based on the model for HH 30 – shows, the geometry of the density distribution is a significant parameter for the resulting temperature differences between grains of different size, too. In the inner region of the disk with a diameter of a few AU a temperature inversion layer was found where the sign of the temperature difference of the largest and smallest grains is reverted. As this and the results obtained on the basis of the spherical shell (§4.1) show, the dust grain temperature structure is not sufficiently represented by dust grains with mean optical parameters. On the one hand, this is of tremendous importance for the simulation of chemical networks since the largest deviations from results based on the approximation of mean dust grain parameters have been found in the inner hot, dense region of the shell/disk where the chemical evolution takes place on its smallest timescale. On the other hand, the complex temperature structure may significantly change the hydrostatic properties of the considered gas/dust density distribution itself. However, these questions have to be investigated in future studies in order to find out the influence on observable quantities such as SEDs, images, polarization maps, and visibilities. Furthermore, the influence on processes taking place in more evolved circumstellar disks, such as the dust settling and dust grain growth, have to be considered taking into account the temperature structure of real grain size distributions.
References
- bakes (1994) Bakes, E.L.O., Tielens, A.G.G.M. 1994, ApJ, 427, 822
- bickel (1985) Bickel, W.S., Bailey, W.M. 1985, Am. J. Phys., 53 (5), 468
- bjorman (2001) Bjorkman, J.E., Wood, K. 2001, ApJ, 554, 615
- bohren (1983) Bohren, C.F., Huffman, D.R. 1983, “Absorption and scattering of light by small particles”. John Wiley & Sons, New York
- burrows (1996) Burrows, C.J., et al., 1996, ApJ, 473, 437
- (6) Calvet, N., D’Alessio, P., Hartmann, L., et al. 2002, ApJ, 568, 1008
- (7) Cazaux, S., Tielens, A.G.G.M. 2002, ApJ, 575, L29
- (8) Charnley, S.B. 2001, ApJ, 562, L99
- chiang (1997) Chiang, E.I., Goldreich, P. 1997, ApJ, 490, 368
- chiang (1999) Chiang, E.I., Goldreich, P. 1999, ApJ, 519, 279
- chiang (2001) Chiang, E.I., Joung, M.K., Creech-Eakman, M.J. 2001, et al., ApJ, 547, 1077
- chini (1986) Chini, R., Krügel, E., Kreysa, E. 1986, A&A, 167, 315
- cotera (2001) Cotera, A.S., Whitney, B.A., Young, E., Wolff, M.J., Wood, K., et al. 2001, ApJ, 556, 958
- dalessio (2001) D’Alessio, P., Calvet, N., Hartmann, L. 2001, ApJ, 553, 321
- draine (1984) Draine, B.T., Lee, H.M. 1984, ApJ, 285, 89
- (16) Draine, B.T., Li, A., 2000, ApJ, 551, 807
- draine (2001) Draine, B.T., Li, A. 2001, ApJ, 551, 807
- dubrulle (1995) Dubrulle, B., Morfill, G., Sterzik, M. 1995, Icar., 114, 237
- efst (1994) Efstathiou, A., Rowan-Robinson, M. 1994, MNRAS, 266, 212
- efst (1995) Efstathiou, A., Rowan-Robinson, M. 1995, MNRAS, 273, 649
- fischer (1994) Fischer, O., Henning, Th., Yorke, H. 1994, A&A, 284, 187
- fischer (1994) Fischer, O., Henning, Th., Yorke, H. 1996, A&A, 308, 863
- gledhill (2000) Gledhill, T.M., McCall, A. 2000, MNRAS, 314, 123
- henning (1985) Henning, Th. 1985, ApSS, 114, 401
- kim (1994) Kim, S.-H., Martin, P.G.,Hendry, P.D. 1994, ApJ, 422, 164
- kraemer (2001) Kraemer, K.E., Jackson, J.M., Deutsch, L.K., et al. 2001, ApJ, 561, 282
- (27) Krügel, E., Siebenmorgen, R. 1994, A&A, 282, 407
- (28) Krügel, E., Walmsley, C.M. 1984, A&A, 130, 5
- lopez (1995) Lopez, B., Mekarnia, Lefvre, J. 1995, A&A, 296, 752
- lucy (1999) Lucy, L.B. 1999, A&A, 344, 282
- malbet (2001) Malbet, F., Lachaume, R., Monin, J.-L. 2001, A&A, 379, 515
- manske (1998) Manske, V, Henning, Th., Menshchikov, A.B. 1998, A&A, 331, 52
- martin (1974) Martin, P.G. 1978, “Cosmic dust. Its impact on astronomy.”, Claderon Press, Oxford
- (34) Markwick, A.J., Ilgner, M., Millar, T.J., Henning, Th. 2002, ApJ, 385, 632
- mathis (1977) Mathis, J.S., Rumpl, W., Nordsieck, K.H. 1977, ApJ, 217, 425
- men (1998) Menshchikov, A.B., Henning, Th. 1997, ApJ, 318, 879
- men (1999) Menshchikov, A.B., Henning, Th., Fischer, O. 1999, ApJ, 519, 257
- meyer (2001) Meyer, M.R., Backman, D., Mamajek, E.E., et al. 2001, AAS, 199, 7608
- miyake (1995) Miyake, K., Nkagawa, Y. 1995, ApJ, 441, 361
- rybicki (1992) Rybicki, G.B., Hummer, D.G. 1992, A&A, 262, 209
- shakura (1973) Shakura, N.I., & Sunyaev, R.A. 1973, ApJ, 24, 337
- sieben (1992) Siebenmorgen, R., Krügel E., Mathis, J.S. 1992, A&A, 266, 501
- (43) Siebenmorgen, R., Krügel, E., Zota, V. 1999, A&A, 351, 140
- solc (1980) S̆olc, M., 1980, Acta universitatis carolinae - Mathematica et physica, 21
- sonnhalter (1995) Sonnhalter, C., Preibisch, Th., Yorke, H. 1995, A&A, 299, 545
- srikanth (1999) Srikanth, R. 1999, Icar., 140, 231
- stenholm (1994) Stenholm, L. 1994, A&A, 290, 393
- wolf (1999) Wolf, S., Henning, Th., Stecklum B. 1999, A&A, 349, 839
- wolf (2000) Wolf, S., Henning, Th. 2000, Comp. Phys. Comm. 132, 166
- wolf (2002a) Wolf, S., Voshchinnikov, N.V. Henning, Th., 2002, A&A, 385, 365
- wolf (2002b) Wolf, S. 2002, Comp. Phys. Comm., in press
- (52) Wolfire, M.G., Churchwell, E. 1987, ApJ, 315, 315
- wood (2002) Wood, K., Wolff, M.J., Bjorkman, J.E., Whitney, B. 2002, ApJ, 564, 887
- wood (1998) Wood, K., Kenyon, S.J., Whitney, B., Turnbull, M. 1998, ApJ, 497, 404
- yorke (1980) Yorke, H.W. 1980, A&A, 86, 268