Search for the optical counterpart of the nearby pulsar J0108-1431.111Based on observations obtained with ESO under Progr. 65.H-0400(A)
Abstract
We present the results of first deep optical observations of the field of the old ( yr), nearby, isolated pulsar J01081431, in an attempt to detect its optical counterpart. The observations were performed using the FORS1 instrument at the focus of the European Southern Observatory Antu Telescope of the VLT. Observations with the Australia Telescope Compact Array (ATCA) were made to determine an accurate position for the radio pulsar at the current epoch. The imaging data, obtained in the , , and passbands reveal no counterpart at the revised radio position down to , and . For a distance of 130 pc, estimated from the pulsar’s dispersion measure, our constraints on the optical flux put an upper limit of K for the surface temperature of the neutron star, assuming a stellar radius km. Our new radio position allows us to place an upper limit on the pulsar proper motion of 82 mas yr-1 which, for pc, implies a transverse velocity km sec-1.
1 Introduction
PSR J01081431 was discovered by Tauris et al. (1994) during observations performed as a part of the Parkes Southern Pulsar Survey (Manchester et al. 1996). With a period s and a period derivative s s-1 (D’Amico et al. 1998), the pulsar has a characteristic age Myr, rotation energy loss rate erg s-1, and magnetic field G. The dispersion measure of cm-3 pc (D’Amico et al. 1998), the lowest observed so far for a radio pulsar, puts PSR J0108–1431 at a distance of about 130 pc, estimated according to the Taylor & Cordes (1993) model for the Galactic electron density distribution. Tauris et al. (1994) suggest that the local electron density may be greater than average in this direction, giving a distance as low as 60 pc. Regardless of the exact value, the small distance to PSR J01081431 implies a radio luminosity a factor smaller than the average for other old pulsars of similar ages. This pulsar could thus be representative of a population of sub-luminous radio pulsars (e.g., Dewey et al. 1985).
Since PSR J0108–1431 is apparently the closest known pulsar, it is a natural candidate for observations in other wavelength bands. However, it has not yet been detected outside the radio range. Presumably too faint to be detected in the ROSAT All Sky Survey, PSR J0108–1431 has not been observed in a pointing mode with an X-ray observatory so far. The field was observed with the Extreme Ultraviolet Explorer (EUVE), but the pulsar was not detected (Korpela & Bowyer 1998). In the mid-infrared, observations with the Infrared Space Observatory were performed to search for a disk around the pulsar but with no conclusive result (Koch-Miramond et al. 2002). Particularly interesting would be the detection of optical-UV thermal radiation from the neutron star (NS) surface to examine various heating mechanisms that can operate in the NS interiors. According to the current models (see, e.g., Tsuruta 1998, for a review), by the age of 170 Myr a NS would have cooled down to very low (surface) temperatures, K, and its thermal radiation would be virtually undetectable unless some (re)heating mechanisms operate.
Amongst several proposed heating mechanisms, two are most efficient in slowly rotating pulsars. The first one is the dissipation of energy of differential rotation. As invoked by models of pulsar glitches, the interior neutron superfluid rotates more rapidly than the outer solid crust. Frictional interaction with the crust dissipates the energy of the differential rotation, heating the star (Shibazaki & Lamb 1989; Umeda et al. 1993; Van Riper et al. 1994; Larson & Link 1999). The amount of heat released depends on the differential angular momentum of the frictionally coupled superfluid layers. For instance, at an age Myr, plausible values of can provide – K, depending on the equation of state of the NS interiors and properties of nucleon superfluidity. The other heating mechanism is Joule heating caused by dissipation of the magnetic field in the NS crust. According to Miralles, Urpin & Konenkov (1998), the NS luminosity at 10 Myr is approximately equal to the energy released due to the field dissipation. At this stage, the surface temperature decreases slowly, being comparable to that produced by the frictional heating at Myr.
Thus, if the heating mechanisms indeed operate, one can expect the surface NS temperature of a few times K, which would be detectable in the optical-UV range but undetectable in X-rays, traditionally used for observations of thermal radiation from NSs. It is also possible that the pulsar emits nonthermal optical radiation. So far, this has only been firmly detected from younger pulsars (e.g., the Vela pulsar — Mignani & Caraveo 2001; PSR B0656+14 — Koptsevich et al. 2001).
The only previous observations of PSR J0108–1431 in the optical range (,,, bands) were carried out with the 6-m telescope of Special Astrophysical Observatory (Russia), but they were not deep enough to detect the pulsar and provide useful constraints on the radiation mechanisms (Kurt et al. 2000). Therefore, we performed a deep observation of the pulsar field with one of the ESO Very Large Telescopes (VLT) units in several passbands.
The most recent published coordinates of PSR J01081431 (D’Amico et al. 1998) were derived from timing data obtained in the interval 1993 April to 1996 June, giving a mean epoch of 1994.9. Therefore, our knowledge of the actual position of the pulsar at the epoch of our VLT observations is affected by a significant uncertainty due to its unknown proper motion. A pulsar distance of 130 pc and a transverse velocity of 400 km s-1, a typical value for a radio pulsar (Lorimer, Bailes & Harrison 1997), give a proper motion of yr-1. For the epoch of our VLT observations (2000.6), such a proper motion would imply a displacement in an unknown direction of with respect to the original radio timing position. This obviously makes impossible a straightforward positional search for the optical counterpart. For this reason, we observed the pulsar with the Australia Telescope Compact Array (ATCA) to obtain a radio position at an epoch close to that of our optical observations and to measure the pulsar’s proper motion.
We describe the radio and optical observations in §2, while the results and their implications are presented and discussed in §3 and §4, respectively.
2 Observations
2.1 Radio imaging
The pulsar field was observed using the ATCA, a 6-km east-west synthesis array consisting of six 22m-diameter antennas, on 2001 March 31 for 11.3 hours. Data were obtained in two bands, each with dual polarization and bandwidth of 128 MHz, centered on 1384 MHz and 2496 MHz, respectively. The flux density scale was calibrated using a short observation of the standard source 1934-638. Two phase calibrators, 0048-097 and 0114-211, were each observed for 2 min every 30 min to establish the position reference frame. Each of these calibrators has positional uncertainties of in the NRAO VLA calibrator list. Pulsar-gating mode was used, giving 32 phase bins across the pulsar period at both frequencies. The 128-MHz bandwidth at each frequency was also split into 32 channels allowing removal of dispersive delays during processing.
Data were processed using standard techniques with the analysis package MIRIAD555http://www.atnf.csiro.au/computing/software/miriad/. Use of pulsar binning allowed images to be made using on-pulse minus off-pulse difference visibility data. This removed essentially all artifacts from the images, allowing clear identification of the pulsar in both bands. Positions were derived by fitting to the peak of the source, at 1384 MHz and, separately for calibration with each phase calibrator, at 2496 MHz.
2.2 Optical imaging
Optical observations of the field of PSR J01081431 were performed in Service Mode in July and August 2000 with the 8.2-meter Antu Telescope of the ESO VLT, located at the Paranal Observatory (Chile). The images were obtained using the FOcal Reducer and Spectrograph 1 (FORS1) instrument, a four-port CCD detector which can be used both as a high/low resolution spectrograph and an imaging camera. The instrument was operated in imaging mode at its standard angular resolution of 02 per pixel, with a corresponding field of view of . We chose to sacrifice the angular resolution in favor of a larger field of view to increase the number of reference stars needed for a precise CCD astrometry (see §2.3). The images were taken in the Bessel filters (Å, Å), (Å, Å), and (Å, Å). For each of the filters, the total integration time was split in shorter exposures to avoid saturation effects of the CCD and allow for a better cosmic ray filtering. In five nights we collected 12 exposures of 600 s each in , 6 exposures of 900 s in , and 5 exposures of 1 800 s in , for total integration times of 7 200, 5 400 and 9 000 s, respectively. The journal of the observations is summarized in Table 1. The target was always observed close to the minimum airmass () and under sub-arcsecond seeing conditions (, as measured directly on the image). Atmospheric conditions were optimal, with little wind and humidity always below 10%. All the nights were photometric, with the only exception of the last one which was affected by the presence of variable thin cirrus. However, the effect of the extinction was estimated to be below 0.05 magnitudes.
Basic reduction steps to remove instrumental signatures and to renormalize the counts for the different gains of the four CCD ports have been applied through the FORS1 reduction pipeline. For each night, master bias and flats collected in day/night time have been used for debiassing and flatfielding. Finally, all the exposures corresponding to a given observation block (see Table 1) have been combined using a median filter algorithm to remove cosmic ray hits. The and band images taken in different nights were further registered on each other and coadded. For all the science images, the flux calibration was performed using images of photometric standards obtained during the same nights, yielding extinction and color-corrected zero-points with an accuracy of a few hundredths of magnitude for each of the filters. The atmospheric extinction correction was computed according to the most recent coefficients measured for Paranal666http://www.eso.org/observing/dfo/quality/FORS1/qc/photcoeff/. The zero-points were stable, showing negligible fluctuations from night to night, which makes it possible to compare the photometry of different nights.
3 Results
3.1 Pulsar position and proper motion
The ATCA observations give a mean position in J2000 coordinates, with estimated uncertainties, of R.A.=, Dec.= at epoch 2001.3 (MJD 51999). This position is coincident within the uncertainties with that obtained from the timing data (D’Amico et al. 1998): R.A.=, Dec=, which has mean epoch 1994.9 (MJD ). These results imply an upper limit on the pulsar proper motion of mas yr-1, mas yr-1.
The corresponding upper limits on the pulsar transverse velocity components are km s-1, km s-1, where is the pulsar distance in units of 130 pc. The total transverse velocity amounts to km s-1. This is within the bottom 10% of measured velocities. The pulsar is at a Galactic latitude of , and it is quite possible that its main velocity component is along the line of sight. Indeed, there is some indication of a secular increase in the dispersion measure, suggesting a significant line-of-sight velocity component.
3.2 The search for the optical counterpart
In order to register accurately the most recent pulsar position on the optical images, we needed an astrometric solution more precise than the default one derived from the telescope pointing, which can show frame to frame variations up to few arcseconds. Thus, astrometry on the FORS1 images was recomputed using as a reference the positions of stars selected from the recently released Guide Star Catalogue II (GSC-II777http://www-gsss.stsci.edu/gsc/gsc2/GSC2home.htm), which have an intrinsic absolute astrometric accuracy of per coordinate. About 50 GSC-II objects have been identified in one of the two averaged -band images. Of these, only 21 (those which are not extended, not too faint, and not too close to the CCD edges) have been considered suitable astrometric calibrators. The pixel coordinates of the reference stars have been computed by a gaussian fitting procedure using the tools available in the SKYCAT image display interface. The transformation from pixel to sky coordinates was then computed using the program ASTROM888http://star-www.rl.ac.uk/Software/software.htm, yielding an rms error of in both coordinates.
Considering the uncertainties in both the radio position and in the optical astrometry, the final rms uncertainty in registration of the pulsar on the optical image is in R.A. and in Dec. The final error budget takes into account the errors of the radio pulsar coordinates at the epoch of the optical observations ( and in the R.A. and Dec. directions, respectively), the rms error of our astrometric fit (), and the propagation of the intrinsic absolute errors on the GSC-II coordinates (). We note that since the astrometry of the GSC-II was originally calibrated using stars from the Hipparcos and Tycho catalogues, which are tied to the extragalactic radio source frame (ICRF), our position should not be affected by any systematic offset between the radio and optical reference frames.
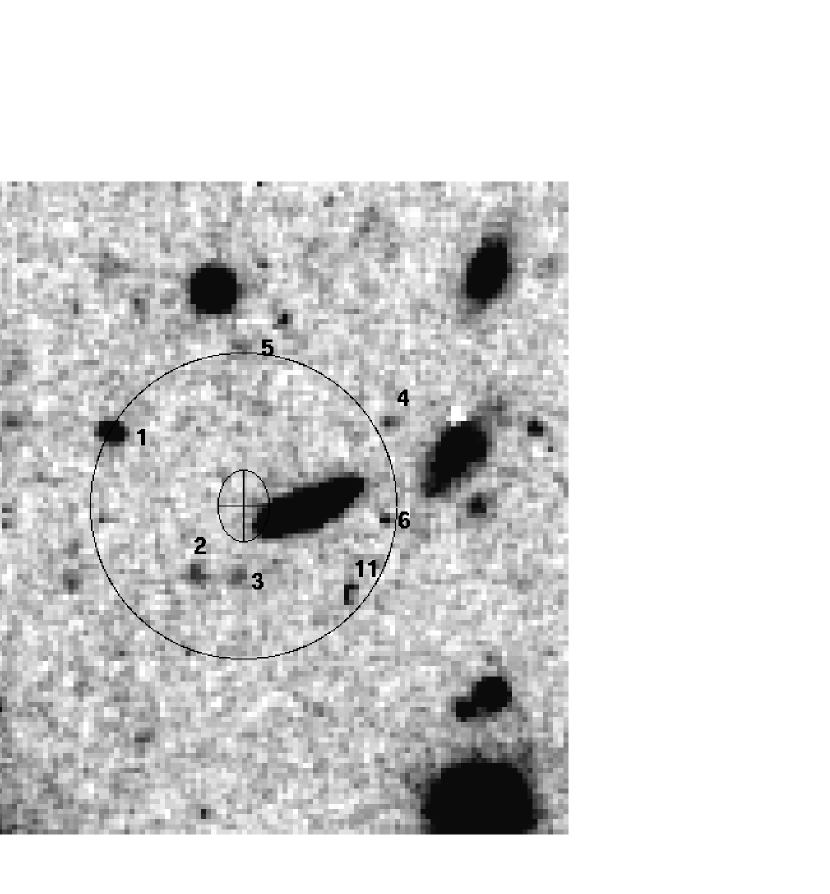
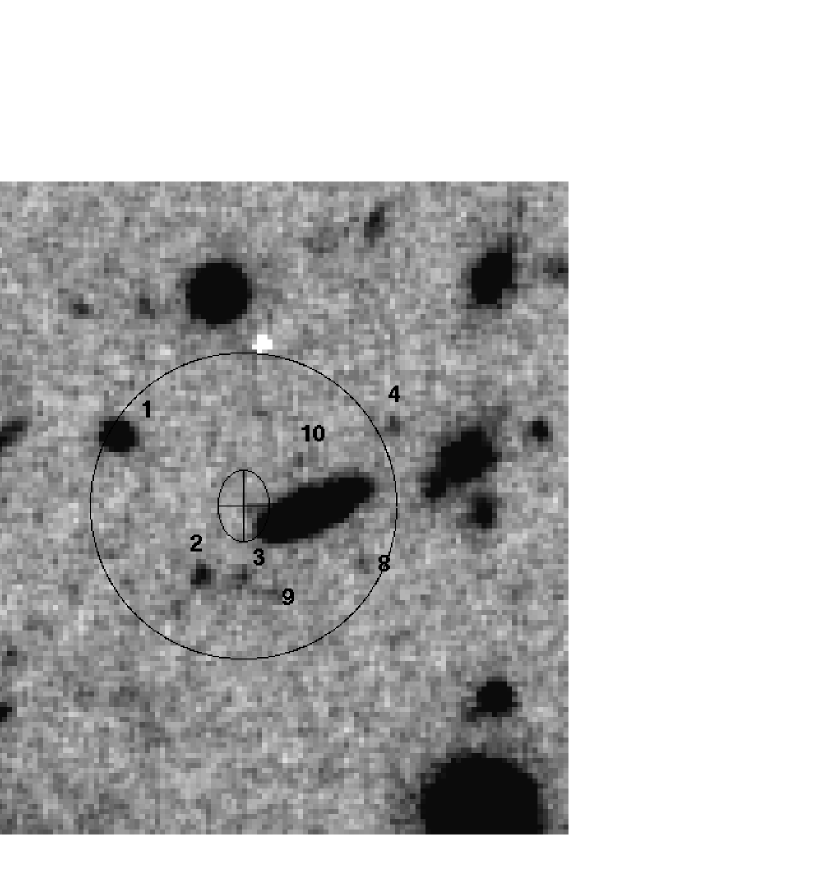
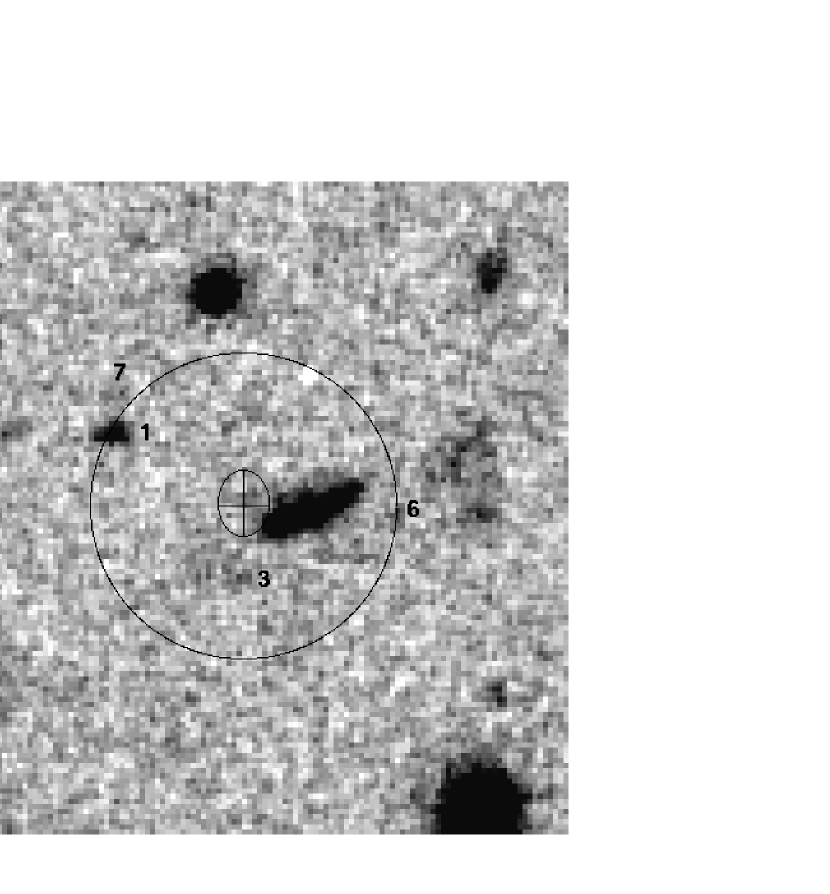
The pulsar position at the epoch of our optical observations is marked in Figures 1 through 3, where we show cutouts of the co-added , , and images. We note that our determination of the pulsar position differs by about from that shown in Figure 5 of Kurt et al. (2000). The reason for this is probably due to the fact that Kurt et al. assumed as a reference the original pulsar coordinates reported by Tauris et al. (1994).
To facilitate the object detection, all the images have been smoothed using a gaussian filter with a of 3 pixels in both and directions. We see from these images that the computed pulsar position falls close to an elliptical galaxy in the field. The distance from the galaxy edge is about , in the East direction. Since such a distance corresponds to about twice the uncertainty of the pulsar position in R.A, it is unlikely that the pulsar is hidden behind the galaxy, but we cannot rule it out. While no point source is obviously visible at the pulsar location in the and images, an excess of counts can be recognized in the image, with a magnitude of . However, the low significance of this detection (), together with the lack of corresponding detections in the other filters and the proximity of the galaxy, suggest that it may be due to a background fluctuation. Only few point-like objects (labelled in Figures 1–3) have been detected within a radius of from the pulsar position. These objects, together with their positions relative to the pulsar and the extinction-corrected photometry in the three filters, are listed in Table 2. However, as it is evident from both Table 2 and Figures 1–3, all these objects are too distant from the nominal pulsar position to be considered candidate counterparts.
Therefore, we conclude that no optical counterpart to the pulsar can be identified in our data. Using as a reference the fluxes of the faintest objects detected in the pulsar surroundings (Table 2), we can derive upper limits of , and on the pulsar magnitudes. Thus our limits are deeper than those obtained by Kurt et al. (2000) by more than 3 magnitudes.
4 Discussion
The upper limits on spectral flux at effective frequences of the three bands (Fukugita, Shimasaku, & Ichikawa 1995) are plotted in Figure 4. The deepest -band limit corresponds to the following limit on the (brightness) temperature
| (1) |
where , , the subscript denotes the quantities as measured by a distant observer: , , is the gravitational redshift parameter ( for a neutron star mass and radius km.) In this estimate, we neglect corrections due to interstellar extinction as they are expected to be negligible at the small distance. For the dispersion distance pc and radius km, we obtain K. This value is considerably lower than K, which follows from the upper limit on the EUVE flux of this pulsar (Korpela & Bowyer 1998), for the same and , and cm-2. It is also much lower than the lowest upper limit, K, estimated from optical/UV observations of another nearby pulsar, B0950+08 999The limit of K in the paper of Pavlov et al. (1996) was estimated for pc. The distance pc was obtained by Brisken et al. (2002) from improved parallax measurements. — see Pavlov, Stringfellow, & Córdova (1996). The limiting temperature is even lower for pc, suggested by Tauris et al. (1994): K. We plot the blackbody spectra at these values of and in Figure 4. The corresponding limits on bolometric luminosity, , are and erg s-1, for pc and 60 pc, respectively. We adopt the more conservative 130 pc estimate in the following discussion and consider K and erg s-1 as plausible upper limits.
The limit on thermal emission strongly constrains possible heating mechanisms. For the frictional heating mechanism (see §1), one can constrain the excess angular momentum , residing in the superfluid, and the angular velocity lag , between the superfluid and the crust, averaged over the superfluid moment of inertia. For instance, using equation (9) of Larson & Link (1999), we obtain erg s, rad s-1, where rad s-2 is the time derivative of the angular frequency of the pulsar, g cm2 is the moment of inertia of the portion of the superfluid that is differentially rotating, estimated for the Friedman & Pandharipande (1981) equation of state. The upper limit on the lag is well below the maximum lag, rad s-1 (e.g., Van Riper et al. 1995), sustainable by superfluid vortices before unpinning from the crust lattice.
The rate of Joule heating caused by dissipation of the magnetic field in the NS crust depends on the strength of the magnetic field generated in the crust during or shortly after NS formation, the density of at the crust bottom, the crust impurity parameter that determines the crust conductivity, and equation of state of the matter in the NS interior (Miralles et al. 1998). Comparing our limit with the results of Miralles et al., we can conclude that, for instance, if G, the values of g cm-3 are excluded for a plausible range of impurity parameter, , for both Friedman & Pandharipande (1981) and Pandharipande & Smith (1975) equations of state.
The upper limit on optical flux gives also a constraint on the temperature and size of hot polar cap(s) predicted by radio pulsar models (e.g., Beskin, Gurevich, & Istomin 1993): K, where is the effective cap radius in km. However, this constraint is not truly restrictive because the limiting temperature is improbably high, K, for the standard estimate of polar cap radius, km. X-ray observations would be more efficient for observing such small, hot polar caps.
The limiting magnitude allows one to estimate a limit on the X-ray flux assuming a non-thermal energy spectrum with slope as observed for several middle-aged pulsars (e.g., Koptsevich et al. 2001). We obtain erg cm-2 s-1 in the 0.1–2.4 keV (ROSAT) energy band (or erg cm-2 s-1 in the 0.1–10 keV band). Such a flux corresponds to an upper limit on X-ray luminosity erg s-1 (in 0.1–2.4 keV), close to the value erg s-1 expected from the empirical dependence found for a sample of radio pulsars observed with ROSAT (Becker & Trümper 1997). Even if the nonthermal radiation is a factor of a few lower than this upper limit, it can be detected with the XMM-Newton and Chandra X-ray observatories.
Clearly, it would be desirable to have a better estimate of the pulsar distance. The pulsar’s ecliptic latitude is about , so a parallax measurement using the NRAO Very Long Baseline Array, for example, is quite feasible. It is also possible that the electron-density model could be improved, giving a more reliable dispersion-based distance estimate. However, this will be difficult to achieve since the pulsar is so close.
References
- (1) Becker, W. & Trümper, J. 1997, A&A, 326, 682
- (2) Beskin, V. S., Gurevich, A. F., & Istomin, Y. N. 1993, Physics of Pulsar Magnetosphere (Cambridge: Cambridge Univ. Press)
- (3) Brisken, W. F., Benson, J. M., Goss, W. M., & Thorsett, S. E. 2002, ApJ, 571, 906
- (4) D’Amico, N., Stappers, B. W., Bailes, M., Martin, C. E., Bell, J. F., Lyne, A. G., & Manchester, R. N. 1998, MNRAS, 297, 28
- (5) Dewey, R. J., Taylor, J. H., Weisberg, J. M., & Stokes, G. H. 1985, ApJ, 294, L25
- (6) Friedman, B., & Pandharipande, V. R. 1981, Nucl. Phys. A. 361, 502
- (7) Fukugita, M., Shimasaku, K., & Ichikawa, T. 1995, PASP, 107, 945
- (8) Koch-Miramond, L., Haas, M., Pantin, E., Podsiadlowski, P., Naylor, T.,& Sauvage, M. 2002, A&A, 387, 233
- (9) Koptsevich, A. B., Pavlov, G. G., Zharikov, S. V., Sokolov, V. V., Shibanov, Yu. A., & Kurt, V. G. 2001, A&A, 370, 1004
- (10) Korpela, E. J., & Bowyer, S. 1998, AJ, 115, 2551
- (11) Kurt, V. G., Komarova, V. N., Fatkhullin, T. A., Sokolov, V. V., Koptsevich, A. B., & Shibanov, Yu. A. 2000, Bull. Special Astrophys. Obs., 49, 5 (astro-ph/0005500)
- (12) Larson, M. B., & Link, B. 1999, ApJ, 521, 271
- (13) Lorimer, D. R., Bailes, M., & Harrison, P. A. 1997, MNRAS, 289, 592
- (14) Manchester, R. N., et al. 1996, MNRAS, 279, 1235
- (15) Mignani, R., & Caraveo, P. A. 2001, A&A, 376, 213
- (16) Miralles, J. A., Urpin, V., & Konenkov, D. 1998, ApJ, 503, 368
- (17) Pandharipande, V. R., & Smith, R. A. 1975, Nucl. Phys. A, 237, 507
- (18) Pavlov, G. G., Stringfellow, G. S., & Córdova, F. A. 1996, ApJ, 467, 370
- (19) Shibazaki, N., & Lamb, F. D. 1989, ApJ, 346, 808
- (20) Tauris, T. M., et al. 1994, ApJ, 428, L53
- (21) Taylor, J. H., & Cordes, J. M. 1993, ApJ, 411, 674
- (22) Tsuruta, S. 1998, Phys. Rep. 291, 1
- (23) Umeda, H., Shibazaki, N., Nomoto, K., & Tsuruta, S. 1993, ApJ, 408, 186
- (24) Van Riper, K. A., Link, B., & Epstein, R. I. 1995, ApJ, 448, 294
| Date | Filter | No. of exp. | Exposure(s) | seeing | airmass |
|---|---|---|---|---|---|
| 2000 July 06 | 6 | 600 | 06 | 1.35 | |
| 2000 July 07 | 6 | 600 | 055 | 1.10 | |
| 2000 July 26 | 3 | 1 800 | 08 | 1.07 | |
| 2000 July 31 | 6 | 900 | 06 | 1.12 | |
| 2000 August 03 | 2 | 1 800 | 052 | 1.02 |
| Obj | ||||||
|---|---|---|---|---|---|---|
| psr | 0 | 0 | 0 | |||
| 1 | +5.18 | +2.91 | 5.86 | 25.01 (0.02) | 25.34 (0.05) | 24.78 (0.1) |
| 2 | +1.93 | –2.74 | 3.47 | 26.62 (0.10) | 27.15 (0.10) | … |
| 3 | +0.20 | –2.70 | 2.85 | 26.78 (0.15) | 27.74 (0.15) | 26.11 (0.15) |
| 4 | –5.65 | +3.33 | 6.49 | 27.14 (0.15) | 27.68 (0.10) | … |
| 5 | +0.072 | +6.27 | 6.12 | 27.05 (0.15) | … | … |
| 6 | –5.53 | –0.53 | 5.59 | 27.92 (0.35) | … | 26.42 (0.25) |
| 7 | +4.70 | +4.30 | 6.26 | … | … | 26.07 (0.20) |
| 8 | –4.59 | –2.16 | 5.15 | … | 28.12 (0.20) | … |
| 9 | –1.06 | –3.44 | 3.75 | … | 28.61 (0.25) | … |
| 10 | –2.19 | +1.73 | 2.72 | … | 28.61 (0.35) | … |
| 11 | -4.17 | –3.36 | 5.35 | 26.40 (0.3) | … | … |