Comparing the old Stellar Population in Globulars and Dwarf Galaxies: The Cases of Phoenix and Leo A
Abstract
Due to their star formation history (SFH), the stellar population in Dwarf Galaxies (DG) is likely to have a metallicity spread which is best traced by the morphology of the Red Giant Branch (RGB). We probe here a purely empirical approach aimed at estimating average metallicity () and spread by comparing the Color-Magnitude Diagrams (CMD) of galactic Globular Clusters (GCs) with those of two DGs: Leo A (HST data) and Phoe (VLT Fors2 data).
Universitäts-Sternwarte München, Scheiner Str. 1, D 81679 Munich, Germany
INAF, Osservatorio Astronomico di Padova, Vicolo dell’Osservatorio 5, Padova, Italy
The older ( 1 Gyr) stellar population of nearby galaxies holds a very important information of the SFH of the local universe. This is often derived by comparing the observed CMDs with theoretical simulations based on isochrones (e.g. Tosi, 2000). However, theoretical isochrones have some difficulty in reproducing the overall appearence of the RGBs of globular clusters and their systematics with metallicity. As an alternative method we propose to use observed CMDs of GCs as empirical Simple Stellar Populations (SSP), i.e. assembly of coeval stars all with the same metallicity .
As test cases, we select the HST observations by Schulte-Ladbeck et al. (2002) of the outer envelope of Leo A and our own VLT FORS2 observations of the Phoenix dwarf galaxy. Both galaxies have undergone an extended period of SF, as evidenced from the presence of an extended horizontal branch as well as younger stars (in their centers). Thus, both systems are an example of Composite Stellar Populations (CSP). The globular cluster comparison set comes from Rosenberg et al. (1999), and encompasses the metallicity range -2.2 [Fe/H] -0.7. Since this set is limited to old ages, we only consider the outer parts of the galaxies, dominated by the old component of the CSP.
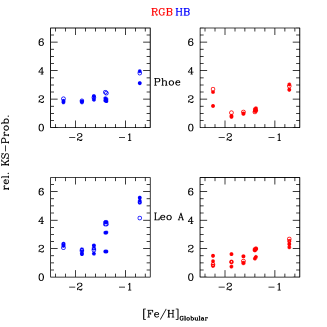
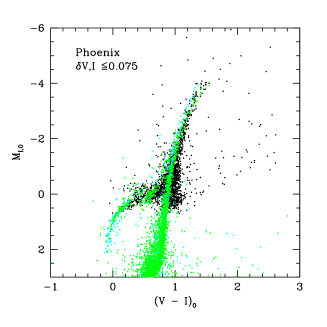
In Fig. 1 (left panel) we superimpose the CMD of Phoenix to the CMDs of the GCs, with [Fe/H]= -1.6. The morphology of the galaxy’s RGB and HB are very well matched. The results of Kolmogorov-Smirnov (KS) tests applied to the stellar distribution of the two DGs against the GCs of various metallicities are shown in the right panel of Fig. 1. The comparisons indicate an average metallicity (spread) of [Fe/H] = -1.8 (0.8 dex) for Leo A and -1.6 (0.6 dex) for Phoenix.
As a further step one can compare the galaxies’ data to a CSP constructed with a set of GCs, taken in a suitable combination. For an SSP, the number of stars populating a given Post Main Sequence (PMS) phase is proportional to the total mass of the SSP () through a factor , which is a robust prediction from stellar evolution models (Greggio 2002, astro-ph/0111241). Thus, if is the total nmber of stars of the empirical CSP in a selected PMS phase (e.g. the RGB), each cluster contributes
| (1) |
RGB stars, where is the contribution by mass of cluster (to be adopted), and the sum is performed on all the clusters composing the empirical CSP. This produces the RGB of the CSP. The other evolutionary phases can be obtained by simply scaling to the original proportions in the GC CMD.
For old stellar populations mostly depends on and on the Initial Mass Function slope (). As an example, for RGB stars brighter than =-1.5, decreases by a factor of 0.6 when increases from -2.4 to 0. At solar metallcity, increases by a factor of 1.2 when varies from -2.35 to -1.3.
References
Rosenberg, A. et al. 2000, A\&A, 144, 5
Schulte-Ladbeck,R.E. et al. 2002, AJ, 124, 896
Tosi, M. 2000 in: The Magellanic Clouds and other dwarf galaxies,
eds. K. S. De Boer, R.-J. Dettmar, U. Klein, Shaker Verlag, p. 67