New optical filamentary structures in Pegasus
Deep H[N ii] CCD images have been obtained in the area of the Pegasus Constellation. The resulting mosaic covers an extent of 7°.5 8°.5 and filamentary and diffuse emission is discovered. Several long filaments (up to 1°) are found within the field, while diffuse emission is present mainly in the central and northern areas. The filaments show variations in the intensity along their extent suggesting inhomogeneous interstellar clouds. Faint soft X–ray emission is also detected in the ROSAT All–Sky Survey. It is mainly concentrated in the central areas of our field and overlaps the optical emission. The low ionization images of [S ii] of selected areas mainly show faint diffuse emission, while in the medium ionization images of [O iii] diffuse and faint filamentary structures are present. Spectrophotometric observations have been performed on the brightest filaments and indicate emission from photoionized or shock–heated gas. The sulfur line ratios indicate electron densities below 600 cm-3, while the absolute H emission lies in the range of 1.1 – 8.8 erg s-1 cm-2 arcsec-2. The detected optical line emission could be part of a single or multiple supernova explosions.
Key Words.:
ISM: general – ISM: supernova remnants – ISM: individual objects: Pegasus1 Introduction
Several surveys have been made in the last decade concerning galactic supernova remnants (SNRs – Arendt 1989; Seward 1990; Koo & Heiles 1991; Saken et al. 1992;). Green (2001) published a revised catalogue containing 231 Galactic SNRs and details for a number of possible and probable SNRs. In an effort to deepen our knowledge on the properties of the optically detected remnants, many imaging and spectral observations have been performed (Fesen & Hurford 1995, Fesen et al. 1995, 1997; Boumis et al. 2001; Mavromatakis et al. 2001, 2002a, 2002c) while, new optical SNRs have also been discovered (Boumis et al. 2002; Mavromatakis & Strom 2002; Mavromatakis et al. 2002b).
The Pegasus constellation is a region without any historical record of SN events. The Palomar Observatory Sky Survey (POSS) plates do not provide clear evidence of optical emission however, careful examination of the POSS plates reveals very weak extended optical emission. In particular, two of the filaments were detected on the POSS plates and we considered that such structures in high galactic latitudes would be interesting to study. The imaged area was expanded as more emission line structures were discovered. However, the final field size was restricted by the available telescope time. The published radio maps do not provide evidence for excess non–thermal emission which could be attributed to a supernova remnant.
In this paper, we report the discovery of faint optical filamentary and diffuse X–ray emission from the Pegasus constellation. We present an HN ii mosaic which covers an area of 7°.5 8°.5, and S ii and O iii images of selected regions showing filamentary and diffuse structures. Spectrophotometric observations of the brightest filaments were also performed and the emission lines were measured. In Sect. 2, we present information concerning the observations and data reduction, while the results of the imaging and spectral observations are given in Sect. 3 and 4, respectively. Information about the X–ray data are given in Sect. 5, while in the last section (Sect. 6) we discuss the physical properties of the newly detected structures.
2 Observations
2.1 Imaging
| IMAGING | |||||
| Date | Telescope | Detector | Filter | – FWHM (Å) | Object |
| 2000 Aug 25–Sep 01 | 0.3 m | Thomsona | H [N ii] | 6560 – 75 | Mosaic |
| 2000 Aug 25–Sep 01 | 0.3 m | Thomson | Cont red | 6096 – 134 | Mosaic |
| 2000 Sep 02–03 | 0.3 m | Thomson | [S ii] | 6708 – 20 | F3–F6 |
| 2000 Sep 02–03 | 0.3 m | Thomson | Cont red | 6096 – 134 | F3–F6 |
| 2000 Sep 03–04 | 0.3 m | Thomson | [O iii] | 5005 – 28 | F3–F6 |
| 2000 Sep 03–04 | 0.3 m | Thomson | Cont blue | 5470 – 230 | F3–F6 |
| 2001 Aug 10–11 | 1.3 m | SITeb | H [N ii] | 6570 – 75 | F3b, F5a, F6 |
| SPECTROSCOPY | |||||
| Date | Telescope | Detector | Slit width (m) | Waveband (Å) | Object |
| 2001 Aug 12, 20–24 | 1.3 m | SITec | 320 | 4750 – 6815 | F2–F6 |
a 70′70′, 4″.12 pixel-1
b 8′.58′.5, 0″.5 pixel-1
c 7′.920′, 0″.59 pixel-1
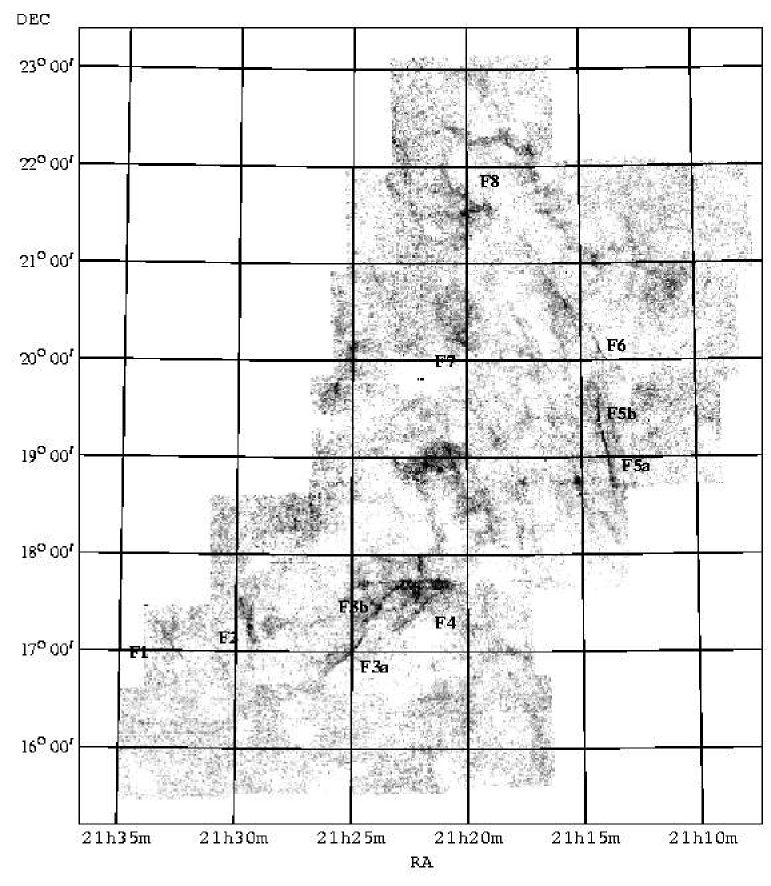
The image of the filamentary and diffuse nebulosities shown in Fig. 1 is a mosaic of 27 images taken through an H[N ii] filter with the 0.3 m Schmidt–Cassegrain (f/3.2) telescope at Skinakas Observatory in Crete, Greece from August 25 to September 04, 2000. The 10241024 (with 1919 m2 pixels) Thomson CCD was used resulting in a scale of 4″.12 pixel-1 and a field of view of 70′ 70′. The brightest filaments named F3, F4, F5 and F6 in Fig. 1 were also observed using the same configuration with the [O iii] and [S ii] emission line filters. One 1800 s exposure in the light of H[N ii] and two in the light of [S ii] and [O iii] (bringing their total exposure times to 3600 s) were taken for each field. Optical images of filaments F3, F5 and F6 were also obtained through the H[N ii] filter (Fig. 5) with the 1.3 m (f/7.7) Ritchey–Cretien telescope at Skinakas Observatory on August 10–11, 2001. The detector was the 10241024 (with 2424 m2 pixels) SITe CCD giving a field of view of 8′.5 8′.5 and an image scale of 0″.5 pixel-1. Details of all observations are summarized in Table 1.
The image reduction was carried out using the IRAF and MIDAS packages and their grey-scale representation using the STARLINK Kappa and Figaro packages. The astrometric solutions were calculated for each field using reference stars from the Hubble Space Telescope (HST) Guide Star Catalogue (Lasker et al. 1999). All coordinates quoted in this paper refer to epoch 2000.
2.2 Spectroscopy
Low dispersion long–slit spectra were obtained with the 1.3 m telescope at Skinakas Observatory on August 12 and August 20-24, 2001. The 1300 line mm-1 grating was used in conjunction with a 2000800 SITe CCD (1515 m2 pixels) resulting in a scale of 1 Å pixel-1 and covers the range of 4750 Å – 6815 Å. The spectral resolution is 8 pixels and 11 pixels full width at half maximum (fwhm) for the red and blue wavelengths, respectively. The slit width is 77 and in all cases, was oriented in the south–north direction, while the slit length is 79. Details about the observations are presented in Table 1, while the coordinates of the slit centers, the number of spectra and their individual exposure times are given in Table 2. The spectrophotometric standard stars HR5501, HR7596, HR9087, HR718, and HR7950 (Hamuy et al. 1992, 1994) were observed in order to calibrate the spectra.
| Area | Slit centers | No of spectraa | |
|---|---|---|---|
| R.A. | Dec. | ||
| F2 | 21h29m18.5s | 17°14′36″ | 1 |
| F3a | 21h25m15.2s | 16°56′25″ | 2 |
| F3b(I) | 21h23m46.0s | 17°28′38″ | 1 |
| F3b(II) | 21h23m57.8s | 17°23′35″ | 2 |
| F4 | 21h22m05.3s | 17°25′35″ | 2 |
| F6(I) | 21h14m00.7s | 20°02′34″ | 2 |
| F6(II) | 21h14m09.0s | 20°05′12″ | 2 |
a Single exposure time is 3600 sec
3 Imaging of newly detected structures
3.1 The HN ii mosaic
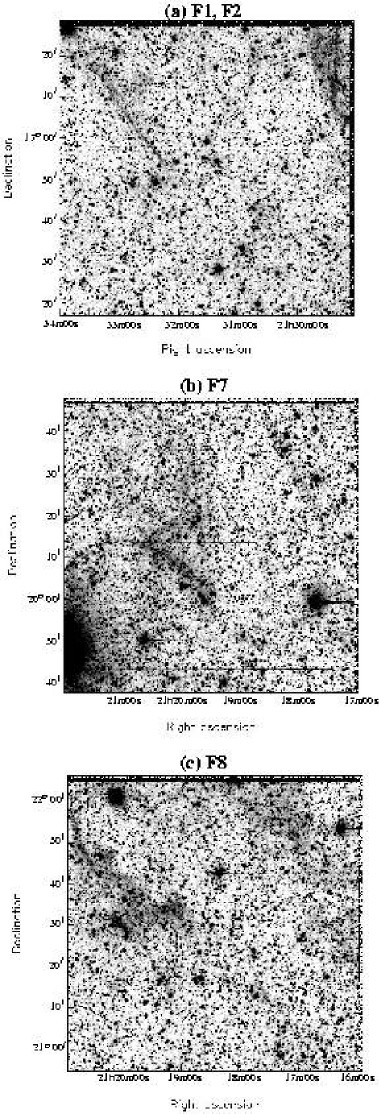
Fig. 1 shows our HN ii mosaic. The image reveals considerable new faint emission including filamentary and diffuse structures. Several thin and curved filaments can be seen in this image and the most interesting are described here in detail. Starting the morphological study from the south–east area, an extremely faint thin filament 28′ long is present (area F1 in Fig. 1 – see also the full resolution image in Fig. 2a), which lies a few arcminutes to the south of the star HD 205300 with its center approximately at 21h32m50s and 17°05′. A brighter filamentary structure lies west of F1 (area F2 in Fig. 1, Fig. 2a), where faint curved filaments and diffuse emission appear south of the star HD 204560, extending down to a declination of 17°04′ (40′ long). The curvature of these faint filaments is complex and it is difficult to define their radii. Three of the most prominent bright structures appear to the south of the center of our mosaic between 21h25m50s, 16°50′ and 21h21m40s, 17°26′ (areas F3a, b and F4 in Fig. 1, Fig. 3a). Arcs F3a, b are separated by a 5′ gap but their morphology suggests that they belong to same filament. Diffuse emission is also present along the 25′ long arc F3a, which becomes brighter along arcs F3b and F4. A large diffuse area covers a region of 1° north of these filaments and exactly in the center of the HN ii mosaic. Two more new structures are present further to the west of this diffuse emission. The first appears as a 1° long filament (F5a, b in Fig. 1, Fig. 4a) separated by faint diffuse emission. The second structure (F6 in Fig. 1, Fig. 5a) is located further to the north at 21h13m50s and 20°00′ and seems to be correlated with a 1° long faint structure. The latter, is north–west of F6 where faint filamentary and diffuse emission is present. Finally, there are two more structures (areas F7, F8 in Fig. 1, Figs. 2b,c) which are located at 21h20m40s, 20°07′very close to the multiple bright star HD 203504 (Tokovinin 1997) and 21h19m50s, 21°40′, respectively. Both are dominated by diffuse emission, while faint small scale filamentary structures are also present. Emission also detected further to the north–west and north–east of F8 seems to extend outside our field.

3.2 An intercomparison of the brightest filaments
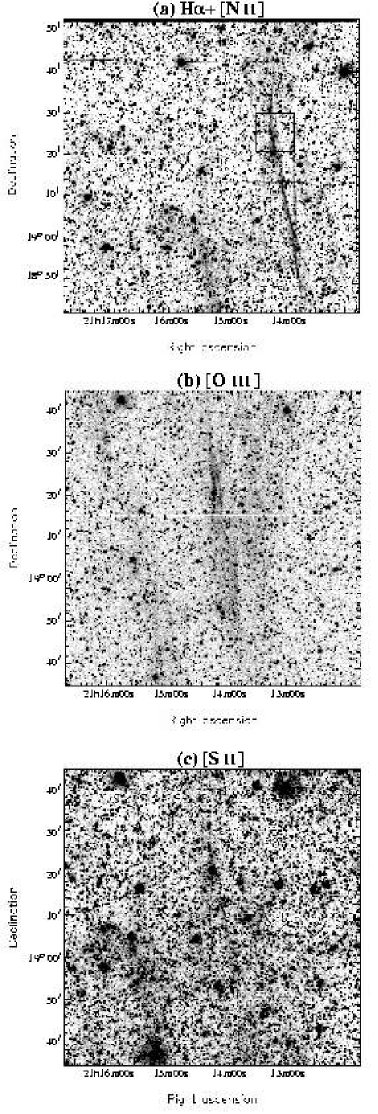
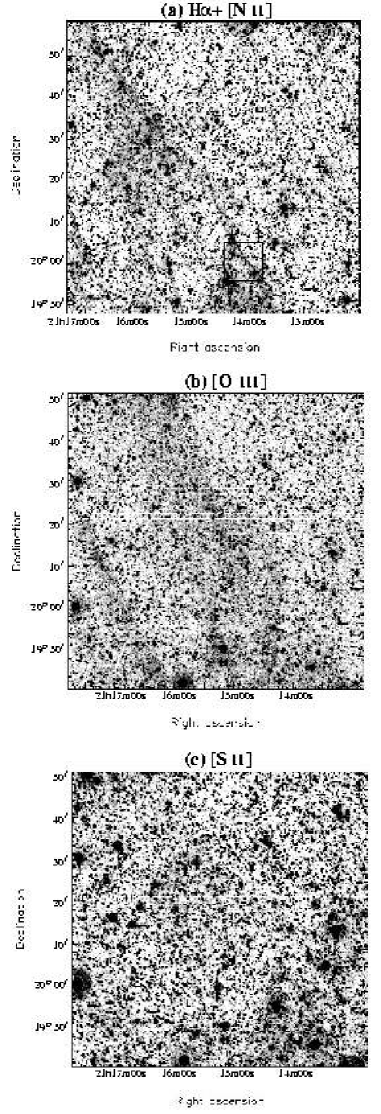
The HN ii images best describe the newly detected structures. However, S ii and O iii emission from structures F3–F6 is also detected and generally appears less filamentary and more diffuse than in the HN ii image. Significant differences between the HN ii, O iii and S ii images are found for most of the filaments. In filament F3 (Fig. 3), the arc–like structure F3b appears intense and filamentary in the first two emission lines, while at the same location the S ii emission is weaker and diffuse. Furthermore, the filamentary structure F3a which is present in the HN ii image does not have O iii or S ii counterparts and only very faint diffuse emission is found. On the other hand, small scale filamentary and diffuse structures appear in all the emission line images of filament F4 (Fig. 3), but still much better defined in HN ii than in O iii or S ii. A similar situation appears in filament F5 (Fig. 4), where the long filamentary arc in HN ii is separated by a 5′ gap of faint diffuse emission. The north part of this filament (F5b) appears both in O iii and S ii, while only diffuse emission is present at the location of filament F5a. In the case of filament F6, the lower ionization lines of HN ii (Fig. 5a) display a different morphology than the medium ionization line of O iii (Fig. 5b). The small scale filamentary structures which are present in the former do not appear in the latter, where only diffuse emission is detected. Weak and diffuse emission is also found in the low ionization image of S ii (Fig. 5c).
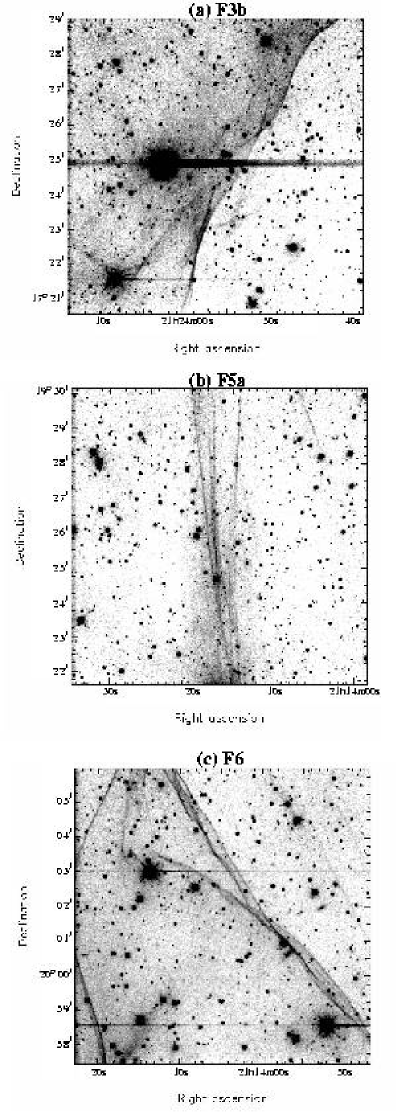
3.3 The HN ii higher resolution images
Portions of selected filamentary structures (F3b, F5a and F6) have been imaged in higher angular resolution (0″.5 pixel-1) with the 1.3 m telescope through the HN ii interference filter (Fig. 6). All images show very thin filamentary structures as well as diffuse emission. Starting from filament F3b (Fig. 6a) the image shows a thin filament along the north–south direction separated by a 1′ gap in the center and extends outside the borders of the image. This filament seems to separate the diffuse emission on the left and the interstellar medium on the right. A thin and much fainter complex of filamentary structures appears in the area of filament F5a (Fig. 6b) which are almost parallel to the north–south direction. In this area diffuse emission seems to be present only close to these structures and mostly to the south. However, the possibility that part of this diffuse emission may be stray light from a bright star, just outside the south border of the image, cannot be ruled out. Finally, in the area of filament F6 (Fig. 6c) a number of new filamentary structures have been discovered to the east and west, which cover the north–south direction across the image and extending outside the borders of the 8′.5 8′.5 square area. The filament F6 located in the right side of the image consists of two bright and two faint thin filaments. In addition, we detected one bright filament in the lower left side of the image and three faint filaments in the north. Diffuse emission is again present to the east part of this area. Note that the exact position and the area covered by the higher resolution images are marked in Figs. 3a, 4a and 5a with solid rectangles.
4 The long–slit spectra
The deep low resolution spectra were taken on the relatively bright optical filaments at seven different locations (their exact positions are given in Table 2). In Table 3, we present the relative line fluxes taken from different apertures along the slit, that are free of field stars and include sufficient line emission to allow an accurate determination of the observed lines. The background extraction apertures were selected towards the north and south ends of each slit depending on the filament’s position within the slit. The signal to noise ratios presented in Table 3 do not include calibration errors which are typically less than 10%. The absolute H flux covers a range of values from 1.1 to 8.8 erg s-1 cm-2 arcsec-2. The extracted apertures do not show the same nature of emission. There are areas (e.g. filament F3b(IIb), F6(Ia) etc.) which show that the observed optical emission must originate from shock heated gas, since S ii/H 0.4 (Smith et al. 1993), while other areas (e.g. F3a(Ia), F3b(I) etc.) display S ii/H 0.3 and therefore suggest photoionization processes.
The S ii ratio of 1.1 indicates low electron densities (less than 440 cm-3; Osterbrock 1989). However, taking into account the statistical errors on the sulfur lines, we calculate with the nebular package (Shaw & Dufour 1995), that electron densities up to 600 cm-3 are allowed. The logarithmic extinction c towards a source of line emission was calculated by using the H/H observed ratios and an intrinsic ratio of 2.85 (see Sect. 5 for details). Furthermore, O iii emission was only detected in filaments F3b and F6(II), while in the rest of the filaments only upper limits are given. The O iii/H ratio was measured and in almost all cases was found to be less than 4. The theoretical models of Cox & Raymond (1985) and Hartigan et al. (1987) suggest that shocks with complete recombination zones must be present, while shock velocities 100 km s-1 are estimated.
| Line (Å) | F2(Ia) | F2(Ib) | F3a(Ia)a | F3a(Ib)a | F3b(I) | F3b(IIa)a | F3b(IIb)a | F4a |
| 4861 H | 12 | 16 | 19 (9) | 15 (3) | 23 (5) | 28 (20) | 17 | 16 (4) |
| 5007 [O iii] | 9 | 15 | 10 | 15 | 33 (8) | 6 | 55 (25) | 15 |
| 6548 N ii | 6 (4) | 6 (3) | 28 (22) | 9 (5) | ||||
| 6563 H | 100 (62) | 100 (52) | 100 (89) | 100 (66) | 100 (41) | 100 (142) | 100 (74) | 100 (53) |
| 6584 N ii | 27 (19) | 25 (14) | 18 (8) | 21 (34) | 93 (71) | 23 (13) | ||
| 6716 S ii | 18 (16) | 21 (11) | 8 (9) | 19 (17) | 12 (6) | 12 (22) | 63 (54) | 24 (16) |
| 6731 S ii | 13 (12) | 20 (10) | 4 (5) | 17 (16) | 7 (4) | 6 (11) | 45 (40) | 21 (15) |
| Absolute H fluxb | 3.7 | 3.0 | 6.7 | 3.1 | 3.1 | 8.8 | 3.1 | 4.1 |
| H/H | 5.2 (9) | 6.7 (3) | 4.4 (5) | 3.6 (20) | 6.1 (4) | |||
| S ii/H | 0.3 (19) | 0.4 (14) | 0.1 (10) | 0.4 (22) | 0.2 (7) | 0.2 (23) | 1.1 (50) | 0.5 (20) |
| F(6716)/F(6731) | 1.4 (9) | 1.1 (7) | 1.9 (4) | 1.1 (12) | 1.6 (3) | 2.1 (10) | 1.4 (32) | 1.1 (11) |
| [O iii]/H | 1.5 | 1.0 | 1.4 | 0.2 | 3.2 | 0.9 | ||
| c | 0.77 (6) | 1.06 (3) | 0.53 (3) | 0.28 (4) | 0.98 (3) |
| Line (Å) | F6(Ia)a | F6(Ib)a | F6(II)a |
| 4861 H | 25 (3) | 18 (8) | 6 |
| 5007 [O iii] | 27 | 7 | 10 (11) |
| 6548 N ii | 10 (2) | 5 (3) | |
| 6563 H | 100 (26) | 100 (70) | 100 (142) |
| 6584 N ii | 48 (13) | 11 (9) | 11 (7) |
| 6716 S ii | 32 (10) | 7 (6) | 14 (26) |
| 6731 S ii | 24 (8) | 4 (3) | 4 (8) |
| Absolute H flux | 1.1 | 6.9 | 6.7 |
| H/H | 4.0 (3) | 5.7 (7) | |
| S ii/H | 0.6 (11) | 0.1 (7) | 0.2 (24) |
| F(6716)/F(6731) | 1.3 (6) | 1.9 (3) | 3.1 (8) |
| [O iii]/H | 1.1 | 0.4 | 1.7 |
| c | 0.42 (3) | 0.83 (5) |
a Listed fluxes are a signal to noise weighted average of two fluxes
b In units of erg s-1 cm-2 arcsec-2
All fluxes normalized to
F(H)=100 and are uncorrected for interstellar extinction. Numbers in
parentheses represent the signal to noise ratio of the quoted fluxes.
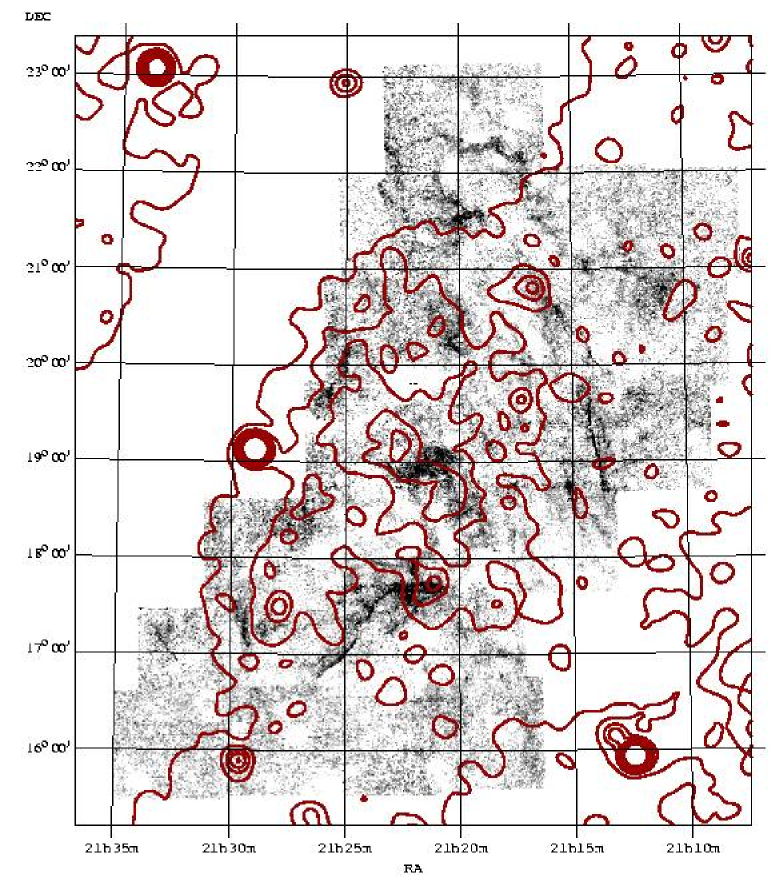
5 The ROSAT All–Sky Survey data
The area in the Pegasus Constellation was observed by ROSAT during the All–Sky Survey for 500 s. Very weak and diffuse emission is present in the area where optical line emission is detected (Fig. 7). The typical level of X–ray emission in the central areas of our field is cts s-1 arcmin-2. Note that a lane of very low X–ray emission to the east has a much more lower exposure time (120 s). Unfortunately, the faintness of the soft X–ray emission did not allow us to obtain reliable results from the spectral analysis.
6 Discussion
The newly discovered filamentary structures towards the Pegasus constellation show up as incomplete circular structures in the optical, as diffuse emission in the soft X–ray wavelengths and without any radio emission detected so far. The low ionization HN ii mosaic shows several filaments across the observed field, while the selected S ii and O iii images generally display diffuse emission. The weak soft X–ray emission seems to overlap the optical emission. The long–slit spectra suggest that part of the detected emission results from shock heated gas, while in other locations the emission seems to result from photoionization processes. Low S ii/H ratios are indicative of H ii regions, while higher values support the interpretation of an expanding SNR shell.
The interstellar reddening was derived from the H/H ratio (Osterbrock 1989), using the interstellar extinction law by Fitzpatrick (1999) and R for all objects. Therefore, the interstellar extinction c(H) can be derived from the relationship
| (1) |
where 0.348 is the relative logarithmic extinction coefficient for H/H and 2.85 the theoretical value of F(H)/F(H). Consequently, the interstellar extinction c at the positions of different filaments (see Table 3) was found between 0.3 and 1.0 or an AV of 0.6 to 2.1. In Table 3, we have also calculated the estimated signal to noise for each extinction value. We propose that an interstellar extinction c of 0.7–0.8 or an AV of 1.4–1.6 is representative of the extinction towards this area.
An estimated value of the hydrogen column density N cm-2 is given by Dickey & Lockman (1990) in the direction of the optical filaments. Using the statistical relation of Predehl & Schmitt (1995)
| (2) |
where A (Kaler 1976), we obtain an NH of and for the minimum and maximum c values calculated from our spectra, respectively. These values are consistent with the estimated galactic NH considering the uncertainties involved.
The electron densities have been determined by measuring the ratio of S ii and found densities below 440 cm-3. In case of complete recombination zones, it is possible to estimate the preshock cloud density nc by using the relationship (Dopita 1979)
| (3) |
where is the electron density derived from the sulfur line ratio and Vs is the shock velocity into the clouds in units of 100 km s-1. Thus, we obtain from Eq. (3). Shock velocities below 100 km s-1 are consistent with our data suggesting that the preshock cloud densities are typically around or below 10 cm-3.
Both optical and X–ray observations do not uniquely identify the nature of the detected emission. The optical observations suggest the existence of H ii regions in the area as well as shock–heated filamentary structures. However, the presence of soft X–ray emission which seems to overlap the optical emission may not be a chance coincidence and would provide support to the scenario where the optical filaments may be part of an extended supernova remnant. Shock–heated emission was found in almost all the filamentary structures and taking into account their morphology it may be possible that they belong to a single extended SNR with its east part lying outside our field. The overall orientation of the filaments suggests an estimated center of the possible supernova event at around 21h24m and 19°30′ (equivalent to galactic longitude and latitude ) with a angular diameter of 4°.56°. Large–scale H surveys also show evidence of optical emission in the area and its morphology gives support to the SNR scenario. In particular, the Wisconsin H Mapper (WHAM – Haffner et al. 2002) shows a very faint elliptical distribution of emission almost at the same location with its center at , and an angular size of 4°6°, while several maps of the Virginia Tech Spectral-Line Survey (VTSS – Dennison et al. 1998) suggest a roughly spherical distribution in the area of the brighter emission. Duncan et al. (1997) presented a number of large ( 2°) SNR candidates where almost all appear as edge–brightened and filamentary arcs, detected towards high latitudes away from the Galactic plane. They concluded that these structures must be large and old, within the radiative phase and almost at the point of merging with the interstellar medium (ISM). If our newly detected structures form indeed a SNR, then it is probably in the late stages of evolution where it begins to merge to the ISM. This may explain why no radio emission has been detected from radio surveys since as it becomes older it is difficult to distinguish its emission from the radio emission of the galactic plane (Duncan et al. 1997). Assuming a distance to the SNR of 1 kpc and an angular diameter of 5° then its radius would be 44 pc. If this is the case then this SNR would be one of the largest known SNRs. However, it must be pointed out that the possibility of the existence of more than one supernova explosions cannot be excluded since the unclear nature of both optical and X–rays does not help to clarify which scenario is more probable.
The observed variation in the absolute line fluxes could be due to variations of the interstellar clouds density, shock velocities, intrinsic absorption, while the absence of the X–ray emission in the north–west area suggests even lower interstellar medium densities in that region. According to Chu (1997), when a supernova event occurs in a hot, low–density medium, the classical SNR signatures may not be observable and mostly X–ray diffuse emission is present. Massive stars are usually formed in groups, such as OB associations, thus the possibility that the optical emission is associated to a supernova remnant within an OB association must be examined further in the future. If the optical emission belongs to a supernova remnant, then it would be one of the largest remnants and this may explain why, unlike other known SNR, it is not observed as a source of non–thermal emission. The origin of these large scale structure is not yet understood especially at this high galactic latitude and deeper observation in radio and X–ray wavelengths would be required to identify its nature.
Three pulsars (PSRs 21132754, 21161414 and 21241407) have been found within a few degrees away from the brightest filaments (Taylor et al. 1995). These pulsars rotate at a period of 601, 440 and 694 ms, at estimated distances of 1.37, 2.11 and 2.08 kpc, respectively. An estimate of the proper motion of PSRs 21132754 and 21161414 was determined by Harrison et al. (1993) who measured , and , , respectively. It is not clear at the moment if any of these pulsars is related to the supernova event(s) associated to the optical filaments but a correlation can not be ruled out.
7 Conclusions
Unknown filamentary and diffuse structures have been discovered in Pegasus constellation through deep imaging and spectral observations. These structures appear more filamentary in HN ii emission lines images than the O iii and S ii images. Diffuse X–ray emission is detected in the area and may be associated with the optical line emission. The flux calibrated long–slit spectra indicate that the emission arises from both photoionized and shock heated gas. The S ii ratio indicates low electron densities while shock velocities around 100 km s-1 were found. The equivalent hydrogen column density was estimated from the extinction derived from H/H ratio to be between 1.0 to 3.8 cm-2. It may be possible that most of the optical emission is part of one or more supernova remnants.
Acknowledgements.
We would like to thank the referee R. G. Arendt for his comments which helped to clarify the scope of this paper. Skinakas Observatory is a collaborative project of the University of Crete, the Foundation for Research and Technology-Hellas and the Max-Planck-Institut für Extraterrestrische Physik. This research has made use of data obtained through the High Energy Astrophysics Science Archive Research Center Online Service, provided by the NASA/Goddard Space Flight Center. The Wisconsin H-Alpha Mapper (WHAM) and the Virginia Tech Spectral-Line Survey (VTSS) are funded by the National Science Foundation.References
- (1) Arendt R. G., 1989, ApJS, 70, 181
- (2) Boumis P., Dickinson C., Meaburn J., Goudis C.D., Christopoulou P. E., Lopez J. A., Bryce M., Redman M. P., 2001, MNRAS, 320, 61
- (3) Boumis P., Mavromatakis F. and Paleologou, E. V., 2002, A&A, 385, 1042
- (4) Chu Y-H., 1997, AJ, 113, 1815
- (5) Cox D. P. and Raymond J. C., 1985, ApJ, 298, 651
- (6) Dennison B., Simonetti J. H. & Topasna G., 1998, PASA, 15, 147 (The Virginia Tech Spectral–Line Survey, http://www.phys.vt.edu/ halpha/)
- (7) Dickey J. M. and Lockman F. J., 1990, ARAA, 28, 215
- (8) Dopita M. A., 1979, ApJS, 40, 455
- (9) Duncan A. R., Stewart R. T., Haynes R. F. and Jones K. L., 1997, MNRAS, 287, 722
- (10) Fesen R. A. and Hurford A. P., 1995, AJ, 110, 747
- (11) Fesen R. A., Downes R. A., Wallace D. and Normandeau M., 1995, AJ, 110, 2876
- (12) Fesen R. A., Winkler P. F., Rathore Y., Downes R. A., Wallace D. and Tweedy R. W., 1997, AJ, 113, 767
- (13) Fitzpatrick E. L., 1999, PASP, 111, 63
- (14) Green D. A., 2001, A Catalog of Galactic Supernova Remnants (2001 version), Mullard Radio Astronomy Observatory, Cavendish Laboratory, Cambridge, UK (http://www.mrao.cam.ac.uk/surveys/snrs/)
- (15) Haffner, L. M., Reynolds, R. J., Tufte, S. L., et al., 2002, The Wisconsin H Mapper, in prep (http://www.astro.wisc.edu/wham/)
- (16) Hamuy M., Walker A. R., Suntzeff N. B., Gigoux P., Heathcote S. R. & Phillips M. M., 1992, PASP, 104, 533
- (17) Hamuy M., Suntzeff N. B., Heathcote S. R., Walker A. R., Gigoux P. & Phillips M. M., 1994, PASP, 106, 566
- (18) Harrison P. A., Lyne A. G. & Anderson B., 1993, MNRAS, 261, 113
- (19) Hartigan P., Raymond J. and Hartmann L., 1987, ApJ, 316, 323
- (20) Kaler J. B., 1976, ApJS, 31, 517
- (21) Koo B.-C. and Heiles C., 1991, ApJ, 382, 204
- (22) Lasker B. M., Russel J. N. & Jenkner H., 1999, in the HST Guide Star Catalog, version 1.1-ACT, The Association of Universities for Research in Astronomy, Inc
- (23) Mavromatakis, F., Papamastorakis, J., Ventura, J., Becker, W., Paleologou, E. V. and Schaudel, 2001, A&A 370, 265
- (24) Mavromatakis, F., and Strom R. G., 2002, A&A, 382, 291
- (25) Mavromatakis, F., Boumis P. and Paleologou, E. V., 2002a, A&A, 383, 1011
- (26) Mavromatakis, F., Boumis P. and Paleologou, E. V., 2002b, A&A, 387, 635
- (27) Mavromatakis, F., Boumis P., Papamastorakis J. and Ventura J., 2002c, A&A, 388, 355
- (28) Osterbrock D. E., 1989, Astrophysics of gaseous nebulae, W. H. Freeman & Company
- (29) Predehl P. and Schmitt J. H. M. M., 1995, A&A, 293, 889
- (30) Saken J. M., Fesen R. A. and Shull J. M., 1992, ApJS, 81, 715
- (31) Seward F. D., 1990, ApJS, 73, 781
- (32) Shaw R. A. and Dufour R. J., 1995, PASP, 107, 896
- (33) Smith R. C., Kirshner R. P., Blair W. P., Long K. S. and Winkler P. F., 1993, ApJ, 407, 564
- (34) Taylor J. H., Manchester R. N., Lyne A. G., and Camilo F., 1995, A Catalog of 706 Pulsars, Princeton Pulsar Group, Princeton University
- (35) Tokovinin A. A., 1997, A&AS, 124, 75