Dust grain properties in atmospheres of AGB stars
Abstract
We present self-consistent dynamical models for dust driven winds of carbon-rich AGB stars. The models are based on the coupled system of frequency-dependent radiation hydrodynamics and time-dependent dust formation. We investigate in detail how the wind properties of the models are influenced by the micro-physical properties of the dust grains that enter as parameters. The models are now at a level where it is necessary to be quantitatively consistent when choosing the dust properties that enters as input into the models. At our current level of sophistication the choice of dust parameters is significant for the derived outflow velocity, the degree of condensation and the estimated mass loss rates of the models. In the transition between models with and without mass-loss the choice of micro-physical parameters turns out to be very significant for whether a particular set of stellar parameters will give rise to a dust-driven mass loss or not.
Niels Bohr Institute for Astronomy, Geophysics and Physics, Copenhagen University, Juliane Maries Vej 30, DK-2100 Copenhagen, Denmark
Department of Astronomy and Space Physics, Uppsala University, Box 515, SE-751 20 Uppsala, Sweden
Rüti, Switzerland
1. Introduction
Mass loss by dust driven winds of asymptotic giant branch (AGB) stars probably is one of the major mechanism which recycle material in the Galaxy (e.g. Sedlmayr 1994). Most stars () will eventually become AGB stars and subsequently end their life as white dwarfs surrounded by planetary nebulae.
AGB stars are cool ( K) and luminous ( of a few to a few L⊙) and a majority of them are pulsating long-period variables (LPVs). The outer layers of many AGB stars provide favorable conditions for the formation of molecules and dust grains. Dust grains play an important role for the heavy mass loss of these stars (up to (/yr).
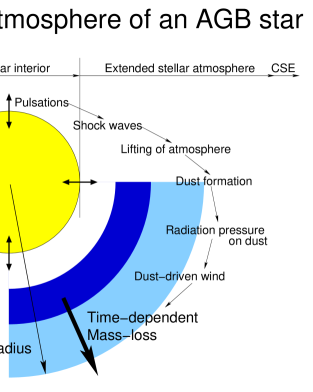
Pulsation causes an extended atmosphere where the dust is condensing. The dust absorbs the light of the central star and re-radiates it at longer wavelengths in the infrared rage (m). The density of material in the circumstellar envelope may be so large that the star becomes completely obscured in the optical rage. Due to observational difficulties in determining the mass loss rates of these objects considerable effort has been put into a theoretical description of the mass loss of AGB stars (e.g. Fleischer et al. 1992; Höfner & Dorfi 1997). The overall goal is to develop a mass loss description that can be used as input to evolutionary models and thereby probe the chemical evolution of the Galaxy.
We present here how the wind properties of carbon-rich models are influenced by the micro-physical properties of the dust grains.
2. The Atmosphere Model
The models predict mass loss rates, wind velocities and dust-to-gas ratios by solving the equations of continuity, motion and energy for the gas and a set of equations describing the formation of dust grains. The transfer of radiation is calculated frequency-dependently for the gas and dust (Höfner 1999; Höfner et al. 2002). Basically only four stellar parameters are needed as input for the models; the stellar mass (), the effective temperature (), the luminosity () of the star and the gas abundance ratio () of carbon to oxygen. However, to describe the pulsations of the star two additional parameters are required for the prescription of the inner boundary condition; a pulsation period (P) and a velocity amplitude (), which simulates a pulsating stellar surface as a means of mechanical energy input.
The number densities of the molecules relevant to the carbon dust formation are calculated assuming chemical equilibrium between H, H2, C, C2, C2H and C2H2 after the fraction of carbon bound in CO has been subtracted. Nucleation, growth and destruction of dust grains are supposed to proceed by reactions involving C, C2, C2H and C2H2.
Dust is formed by a series of chemical reactions in which atoms or molecules from the gas phase combine to clusters of increasing size. The molecular composition of the gas phase determines which atoms and molecules are available for the cluster formation and grain growth. This can lead to a layered structure of the circumstellar envelope. Dust formation alters the atmospheric structure which significant influence the local and global circumstellar envelope dynamics and the detailed time-dependent spectral appearance.
In the case of pulsating atmospheres of Mira and other LPVs the condensation of dust grains is strongly connected with the shock wave structure of the circumstellar envelope, usually triggered by a 2-step mechanism. First there is nucleation of critical clusters followed by growth to macroscopic dust grains. Grain growth will usually proceed far from equilibrium and it is necessary to use a time-dependent description of grain growth to determine the degree of condensation and other relevant properties of the dust.
The grain growth is treated by the moment method which describe the time evolution of an ensemble of macroscopic dust grains of various sizes and requires the nucleation rate as input (Gail & Sedlmayr 1988; Gauger et al. 1990). The moment method needs the following dust properties as external input: (1) the optical properties of the relevant dust types, (2) the intrinsic density of the dust material(s), (3) the sticking coefficient which describes the efficiency of growing dust grains from the atomic precursors, and (4) the surface tension of the dust grains which controls the efficiency of nucleation. The purpose of this work is to investigate in detail how the predicted wind properties of the carbon-rich AGB models are influenced by the choice of these quantities.
For the mass loss models it is important to know how the uncertainty in the chosen dust parameters affects the obtained results. The model parameters are listed in Tables . For a given set of stellar parameters and elemental abundance, the mass loss rate, the outflow velocity and the degree of condensation is obtained by averaging the outflow of the time-dependent models. Previous models presented in earlier papers (e.g. Andersen et al. 1999) were all based on gray radiative transfer while the models presented here are calculated using frequency dependent radiative transfer for the gas and dust (see Höfner et al. 2002 for details). Dynamic atmosphere models are undergoing a transition from qualitative modeling of physical processes to realistic quantitative predictions and interpretations of observations.

3. Amorphous carbon dust
| Reference | Material | Designation | ||
| name | (g/cm3) | % | in this paper | |
| Jäger et al. 1998 | cel400 | 1.435 | 67 | Jäger 400 |
| Jäger et al. 1998 | cel1000 | 1.988 | 80 | Jäger 1000 |
| Rouleau & Martin 1991 | AC2 | 1.85 | - | Rouleau |
Amorphous carbon particles are considered to be a very good candidate for the most common type of dust present in circumstellar envelopes of carbon-rich AGB stars. The infrared data of late-type stars generally show a dust emissivity law () with a spectral index of (e.g. Campbell et al. 1976; Sopka et al. 1985; Martin & Rogers 1987; Gürtler et al. 1996). A behavior can be expected in a very disordered two-dimensional material like amorphous material (e.g. Huffmann 1988; Jäger et al. 1998). Graphite formation in AGB stars is ruled out, because of the absence in the observed spectra of the narrow band at m and the overall shape of infrared graphite spectra which are proportional to (e.g. Draine & Lee 1984).
Amorphous carbon covers by nature a broad span of material properties. The difference in optical properties for three different types of amorphous carbon can be seen in Fig. 1. The dust properties needed as input for the models are not always know from laboratory experiments. In the case of amorphous carbon it has therefore been custom to use values of the intrinsic density for graphite material instead of the real value. If the intrinsic density of graphite is used instead of the correct laboratory value for amorphous carbon it will influence the efficiency of dust formation and therefore the predicted mass loss and colors as seen from Table 3.
4. Results and Discussion
A frequency-dependent treatment of the radiative transfer in the dynamical models has turned out to be crucial for obtaining realistic structures, synthetic spectra, and reliable mass loss rates (Höfner et al. 2002). How the choice of the micro-physical parameters can change the predictions for the mean outflow velocity of the gas and dust, the degree of dust condensation and the mass loss is discussed in the following focusing on the optical dust properties, the intrinsic dust density, the sticking coefficient and the surface tension.
4.1. Dust opacity
The direct influence of the extinction efficiency () on the structure and the wind of the dynamical models are shown in Table 2. The models are dependent on the choice of laboratory measurements of the extinction efficiency () as already show for gray models in Andersen et al. (1999). In contrast to the gray models then for the frequency-dependent models both the absolute value and the slope of the dust opacity data become relevant. The absolute value of the extinction efficiency has a profound influence on the determined outflow velocity of the models, while the slope of the extinction efficiency determines the grain temperature. In the models where the Jäger 400 data is used for the extinction efficiency of the dust, no dust is formed, since the slope of the material opacity dictates a high grain temperature which make the grains unstable against evaporation.
| Model | |||||||
| [] | [K] | [g/cm3] | [] | [km/s] | |||
| l13dj10199 | 13000 | 2700 | Jäger 1000 | 1.99 | 14.8 | 0.05 | |
| l13drou185 | 13000 | 2700 | Rouleau | 1.85 | 7.38 | 0.10 | |
| l13dj04144 | 13000 | 2700 | Jäger 400 | 1.44 | - | - | - |
| l10dj10199 | 10000 | 2600 | Jäger 1000 | 1.99 | 16.3 | 0.10 | |
| l10drou185 | 10000 | 2600 | Rouleau | 1.85 | 3.64 | 0.12 | |
| l10dj04144 | 10000 | 2600 | Jäger 400 | 1.44 | - | - | - |

4.2. Intrinsic dust density
We have calculated models with different intrinsic densities for the given material assumed to be formed in the stellar wind. When the moment method was developed by Gail & Sedlmayr (1988) the intrinsic density for the amorphous carbon used in that generation of models was not know. The value of graphite (2.25 g/cm3) was therefore assumed. This value was later used in almost all of the existing models (e.g. Fleischer et al. 1992; Höfner & Dorfi 1997). The models become much redder when the intrinsic density of graphite is used instead of the value for amorphous carbon since significantly more dust is formed in these models. Even a small increase of about 10% in the intrinsic density of the dust material (as is the case from Model l13dj10199 to l13dj10225) results in a doubling of the degree of condensation and a substantial increase in the outflow velocity, .
| Model | |||||||
| [] | [K] | g/cm3 | [] | [km/s] | |||
| l13dj10199 | 13000 | 2700 | Jäger 1000 | 1.99 | 14.8 | 0.05 | |
| l13dj10225 | 13000 | 2700 | Jäger1000 | 2.25 | 20.8 | 0.11 | |
| l13drou185 | 13000 | 2700 | Rouleau | 1.85 | 7.38 | 0.10 | |
| l13drou225 | 13000 | 2700 | Rouleau | 2.25 | 18.1 | 0.31 | |
| l13dj04144 | 13000 | 2700 | Jäger400 | 1.44 | - | - | - |
| l13dj04225 | 13000 | 2700 | Jäger400 | 2.25 | 1.38 | 0.13 |
The influence on the mass loss rate is very sensitive to the discrepancy between the value of the intrinsic density of the amorphous carbon and the value for graphite. For the models l13drou185 and l13drou225 where the only difference is a 20% difference in the value used for the intrinsic density, the estimated mass loss rate differ almost by a factor of 2. For the models using the Jäger 400 material data (l13dj04144 to l13dj04225), where the difference is almost 40%, using the true material value instead of the higher value for graphite result in a model that will not develop a wind at all.
4.3. Sticking coefficient
The sticking coefficient (also called the reaction efficiency factor) is not definitely know as long as we do not know explicitly the sequence of chemical reactions responsible for the dust formation. To isolate the importance of how uncertainties in the value of will influence the results of the models we have varied this parameter in otherwise identical models. Choosing a value for the sticking coefficient of one increases the degree of condensation and the outflow velocity by about a factor of 2 compared to when a value of 0.3 is chosen. Dust formation occurs beyond independent of the value assumed for the sticking coefficient since the condensation threshold is determined mainly by the temperature. With the low choice of sticking coefficient () only about 10% of the condensable carbon material present in the gas actually condense into grains, while for the much more favorable choice of sticking coefficient () twice as much material condense into grains. A complete condensation of carbon grains is prevented by the rapid velocity increase after the onset of avalanche nucleation and the subsequent rapid dilution.
| Model | |||||||||
|---|---|---|---|---|---|---|---|---|---|
| [] | [K] | [] | [km/s] | ||||||
| l1303 | 13000 | 2700 | 0.37 | 0.34 | 0.34 | 0.34 | 7.38 | 0.10 | |
| l1302 | 13000 | 2700 | 0.20 | 0.20 | 0.20 | 0.20 | 3.87 | 0.09 | |
| l1305 | 13000 | 2700 | 0.50 | 0.50 | 0.50 | 0.50 | 10.5 | 0.12 | |
| l1310 | 13000 | 2700 | 1.00 | 1.00 | 1.00 | 1.00 | 16.5 | 0.22 | |
| l1003 | 10000 | 2600 | 0.37 | 0.34 | 0.34 | 0.34 | 3.64 | 0.12 | |
| l1010 | 10000 | 2600 | 1.00 | 1.00 | 1.00 | 1.00 | 12.3 | 0.23 |
4.4. Surface tension
The surface tension of amorphous carbon is not know from laboratory experiments, it has therefore become a custom to use the values for graphite e.g. given by Tabak et al. (1975). One problem however is that there are huge variations in the values determined due to the anisotropy with orientation of graphite.
The surface tension enters into the surface contribution to the free energy, , calculated on the basis of classical thermodynamics, see Gail et al. (1984) for details.
As already demonstrated by Tabak et al. (1975) then variating the value of the surface tension produces an enormous change in the nucleation rate. To determine how significant the prescribed value for the surface tension that we use in the models is for the results we have varied the value around the value of 1400 erg/cm2 which were used in all previous models, see Table 5. Altering the value of the surface tension of the forming dust grains by 28% around the value of graphite will make the difference between obtaining a mass loss or not for the model. Also it has a substantial influence on how much of the available material in the circumstellar envelope will condense into dust grains. For a comparison the measured surface tension for other materials are: Fe ( erg/cm2), MgS ( erg/cm2) and SiO ( erg/cm2) (Gail & Sedlmayr 1986).
| Model | ||||||
| [] | [K] | [erg/cm2] | [] | [km/s] | ||
| l13drou18510 | 13000 | 2700 | 1000 | 3.52 | 0.76 | |
| l13drou18514 | 13000 | 2700 | 1400 | 7.38 | 0.10 | |
| l13drou18518 | 13000 | 2700 | 1800 | - | - | - |
5. Conclusions
We have investigated in detail how the predicted wind properties of the carbon-rich AGB models are influenced by the choice of micro-physical dust parameters.
For the mass loss models it is important to know how the uncertainty in the chosen dust parameters affects the obtained results. The choice of the micro-physical parameters can change the predictions for the mean outflow velocity of the gas and dust by a factor of 4, the predicted degree of dust condensation by a factor of 10 and the predicted mass loss by a factor of 2. In the transition between models with and without mass-loss the choice of micro-physical parameters is vital for whether a particular set of stellar parameters will give rise to a dust-driven mass loss or not.
Acknowledgments.
ACA gratefully acknowledges financial support from the Carlsberg Foundation. This work was supported by NorFA, the Royal Swedish Academy of Science and the Swedish Research Council.
References
Andersen A., Loidl R., Höfner S., 1999, A&A 349, 243
Campbell M.F., Harvey P.M., Hoffmann W.F., Elias J.H., Neugebauer G., Gezari D.Y., Westbrook W.E., Hudson H.S., Soifer B.T., Werner M.W., 1976, ApJ 208, 396
Draine B.T., Lee H.M., 1984, ApJ 285, 89
Fleischer A.J., Gauger A., Sedlmayr E., 1992, A&A 266, 321
Gail H.-P., Sedlmayr E., 1986, A&A 166, 225
Gail H.-P., Sedlmayr E., 1988, A&A 206, 153
Gauger A., Gail H.-P., Sedlmayr E., 1990, A&A 235, 345
Gürtler J., Kömpe C., Henning Th., 1996, A&A 305, 878
Höfner S., 1999, A&A 346, L9
Höfner S., Dorfi E.A., 1997, A&A 319, 648
Höfner S., Loidl-Gautschy R., Aringer B., Jørgensen U.G., 2002, subm. A&A
Jäger C., Mutschke H., Henning Th., 1998, A&A 332, 291
Martin P.G., Rogers C., 1987, ApJ 322, 374
Rouleau F., Martin P.G., 1991, ApJ 377, 526
Sedlmayr E., 1994, in Molecules in the Stellar Environment, LNP 428, ed. U.G. Jørgensen (Springer, Berlin), 163
Sopka R.J., Hildebrand R.H., Jaffe D.T., et al., 1985, ApJ 294, 242
Tabak R.G., Hirth J.P., Meyrick G., Roark T.P., 1975, ApJ 196, 457