The Central Parsecs of the Bright Quasar PKS 1921–293
Abstract
We report on a VLBA imaging study of the nearby bright southern blazar
PKS 1921–293 (OV–236).
High resolution VLBA observations, made at four frequencies
(5, 12, 15, and 43 GHz) over the period 1994-2000, have
revealed a strongly curved jet extending out to about 50 parsecs
from the presumed central engine.
Two epoch VLBA observations, each simultaneously carried out at both 5
and 43 GHz, show a large position angle difference of
51∘ – 67∘ between the jet emission at 5 and 43 GHz.
Although the core of PKS 1921–293 has one of the highest brightness
temperatures measured in any compact radio source, unlike other
bright blazars it is not a source of –ray emission.
However, there is evidence in these images for superluminal motion
within the central region (a few parsecs from the core) and within
the north-east diffuse emission region.
In all six-epoch 43 GHz images, two equally compact bright components
within the central parsec are seen.
1 Introduction
PKS 1921–293 (OV–236) is identified with a 17.5 V-magnitude quasar. At a redshift of 0.352 (Wills & Wills 1981), PKS 1921293 is one of the closest members of its class. An angular resolution of 1 mas corresponds to a linear resolution of 4.6 pc (assuming H0 = 65 km s-1 Mpc-1 and q0 = 0.5).
PKS 1921–293 is one of the strongest and most compact extragalactic radio sources known,
which makes it a prime candidate for high-resolution VLBI observations.
PKS 1921–293, together with 3C 273B and 3C 279, is currently among the brightest
extragalactic sources
in the sky at millimeter wavelengths, having a flux density at 3 mm greater than
5 Jy since 1990 with a peak of 15.3 Jy in April 1994 (Tornikoski et al. 1996). Its compactness,
implied by its flat radio spectrum, has been confirmed by space VLBI (VSOP)
observations (Shen et al. 1999). On projected space-ground baselines of 25,000 km (about
three times longer than the longest ground baselines), PKS 1921–293 had a correlated flux
density of 1.0 Jy (1.6 GHz), and a derived core brightness temperature limit
of 3.0 K (in the rest frame of the quasar).

2 Observations and Imaging
The new observations of PKS 1921–293 were made with the NRAO111The National Radio Astronomy Observatory (NRAO) is operated by Associated Universities, Inc., under cooperative agreement with the National Science Foundation. VLBA at four frequencies (5, 12, 15, and 43 GHz) over a period of six years from 1994 to 2000. The data were correlated at the VLBA correlator in Socorro, New Mexico, USA. Standard VLBI data calibrations and corrections for residual delays and rates were done in AIPS. At 43 GHz, the atmospheric opacity correction was also performed in addition to a priori amplitude calibration. The final image processing was carried out using AIPS and DIFMAP.
In general, the source morphologies obtained at various centimeter wavelengths (i.e., 5, 12 and 15 GHz) are very similar and consistent with the past observations. However, their overall structural orientation shows a significant difference from that observed at 43 GHz. Figure 1 shows two images observed simultaneously at 5 and 43 GHz in September 2000. At centimeter wavelengths all of the VLBA images are characterized by a diffuse emission region (cm-jet) extended about 10 mas along a position angle (P.A.) of 30∘ as well as a very compact, bright core at the center. At 43 GHz, our six-epoch VLBA images reveal an even more compact core emission region plus the jet emission (mm-jet). The mm-jet has a varying P.A. with time, but is oriented toward the north-west. The core brightness temperature derived from 43 GHz images has a lower limit between 1011 to 1012 K.
3 Curvature
One of the important results of the analysis of the multi-epoch, multi-frequency VLBA images of PKS 1921–293 is its strongly curved jet emission. The difference in P.A. between the cm-jet and the mm-jet is at least 51∘ – 67∘, as determined by the simultaneous two-frequency (5 and 43 GHz) observations made both in February 1996 and in September 2000 (see Figure 1). Such a large bending is not unexpected for a jet that is beamed close to the observer’s line of sight, for which small changes in angle can be amplified by projection effects.
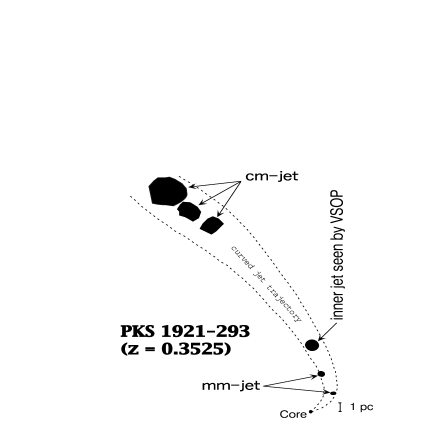
The 43 GHz VLBA observations of the mm-jet and its motions (see section 4 below) suggest a curved trajectory within the central few parsecs, while the trajectory of the cm-jet appears to be constant at larger core separations (seen at lower frequencies). Figure 2 is a schematic diagram showing a single smoothly bent path connecting the mm-jet and the cm-jet through an inner jet component detected by the VSOP observations (Shen et al. 1999).
It should be emphasized that whether the curvature in the jet emission is responsible for the non-detection of the –ray emission by the EGRET (Fichtel et al. 1994) is not clear, as some larger bending angles have also been seen in other –ray bright sources (Britzen et al. 2001).
4 Motion
For the large scale cm-jet emission, we obtained the proper motion from the position of the brightest component at 5 GHz that has a mean P.A. of 28∘2∘. The fitted proper motion over the past 7.5 years is 0.150.08 mas yr-1, corresponding to a superluminal velocity of 3.01.6 c. The proper motion (apparent superluminal velocity) within the mm-jet is estimated to be 0.160.01 mas yr-1 (3.20.2 c), along a position angle of 28∘3∘ with regard to a reference position at epoch 1994.32 of 0.54 mas and P.A. = (from the origin). The P.A. of the cm-jet emission region relative to this reference mm-jet component is about 34∘3∘. Note that the error bars are derived from the statistical uncertainties only. Therefore, the jet components in PKS 1921–293 seem to move along a straight path from about 2.5 pc to about 25 pc (as depicted in Figure 2). The P.A. of the reference mm-jet emission is roughly perpendicular to the derived direction of its superluminal motion. This may further suggest that the jet emission observed so far is part of a curved trajectory that undergoes a sharply bending (PA 90∘) phase within the central 2 pc region.
5 The Innermost ( 1 pc) Region
An important question is how the jet moves in the innermost region of the central engine where the relativistic plasma is accelerated and collimated. Our six epoch 7 mm VLBA observations found consistently that the central parsec region ( 1 pc) consists of two equally compact components (labelled as C1 and C2 in Figure 1). The fitted sizes for both C1 and C2 are 0.1 mas or less. Away from the central parsec region, the jet emission gradually decreased in flux density as it was moving away. The scenario in the central 1 pc region, however, is quite different. The flux density of component C1 appears not to change, compared to the rapid variation in the total flux densities observed at 90 and 230 GHz by SEST (Tornikoski 2001, private communication). On the other hand, component C2 undergoes a significant (200%) variation in flux density which seems to correlate with the total flux density variation.
The dramatic variability seen in component C2 may argue that C2 is related to the central activity, though the observed superluminal motion suggests that the component C1, at the eastern end, is the location of the core.
Over about 6.5 yrs of six epoch 43 GHz VLBA observations, the relative position between C1 and C2 of 0.2 mas (i.e., 1 pc) along a P.A. of 50∘ remains unchanged within an uncertainty of 0.05 mas. High resolution VSOP observations at 5 GHz have also suggested the existence of such a compact double structure, but with a larger separation of 0.4 mas at a similar P.A. (Shen et al. 2000). The difference in the separation may be due to the opacity effects, i.e., the frequency-dependent shift of the synchrotron self-absorbed core at longer wavelength. PKS 1921–293 becomes optically thick at centimeter wavelengths
Some possible explanations are: 1) C2 is just a stationary knot that is located
at the turning point of the bent path and its emission is amplified by relativistic
beaming; 2) C2 is a trailing shock following
the steady, fast superluminal motion at the
front as seen in the radio galaxy 3C 120 (Gómez et al. 2001); 3) this may infer the
existence of a binary system within the central parsec region of PKS 1921–293, which
could be associated with a massive black hole binary.
A supermassive binary in an AGN will result in the precession
of the jet ejection axis, which may explain the observed large
bend (Begelman, Blandford & Rees 1980).
New high-resolution VLBI imaging observations at both 86 and 43 GHz are underway to
investigate the binary hypothesis as well as the above-mentioned possibilities.
References
Begelman, M. C., Blandford, R. D. & Rees, M. J. 1980, Nature, 287, 307
Britzen, S., Vermeulen, R. C., Taylor, G. B., Campbell, R. M., Browne, I. W., Wilkinson, P., Pearson, T. J. & Readhead, A. C. S. 2001, in Galaxies and Their Constituents at the Highest Angular Resolution (IAU Symp. 205), ASP Conf. Series Vol. 205, eds. R. T. Schilizzi, S. Vogel, F. Paresce & W. Elvis, (San Francisco: ASP), 106
Fichtel, C. E., Bertsch, D. L., Chiang, J., Dingus, B. L., Esposito, J. A., Fierro, J. M., Hartman, R. C., Hunter, S. D., Kanbach, G., Kniffen, D. A., Kwok, P. W., Lin, Y. C., Mattox, J. R., Mayer-Hasselwander, H. A., McDonald, L., Michelson, P. F., von Montigny, C., Nolan, P. L., Pinkau, K., Radecke, H.-D., Rothermel, H., Sreekumar, P., Sommer, M., Schneid, E. J., Thompson, D. J. & Willis, T. 1994, ApJS, 94, 551
Gómez, J.-L., Marscher, A. P., Alberdi, A., Jorstad, S. J. & Agudó, I. 2001, ApJL, 561, L161
Shen, Z.-Q., Edwards, P. G., Lovell, J. E. J., & Kameno, S. 2000, in Astrophysical Phenomena Revealed by Space VLBI, eds. H. Hirabayashi, P. G. Edwards & D. W. Murphy, (Sagamihara, ISAS), 155.
Shen, Z.-Q., Edwards, P. G., Lovell, J. E. J., Fujisawa, K., Kameno, S. & Inoue, M. 1999 PASJ, 51, 513
Tornikoski, M., Valtaoja, E., Teräsranta, H., Karlamaa, K., Lainela, M., Nilsson, K., Kotilainen, J., Laine, S., Lähteenmäki, A., Knee, L. B. G. & Botti, L. C. L. 1996, A&AS, 116, 157
Wills, D. & Wills. B. J. 1981, Nature, 289, 384