Chandra Spectroscopy and Mass Estimation of the Lensing Cluster of Galaxies CL0024+17
Abstract
We present the X-ray analysis and the mass estimation of the lensing cluster of galaxies CL0024+17 with Chandra. We found that the temperature profile is consistent with being isothermal and the average X-ray temperature is keV. The X-ray surface brightness profile is represented by the sum of emissions associated with the central three bright elliptical galaxies and the emission from intracluster medium (ICM) which can be well described by a spherical -model. Assuming the ICM to be in the hydrostatic equilibrium, we estimated the X-ray mass and found it is significantly smaller than the strong lensing mass by a factor of 3.
Tokyo Metropolitan University, 1-1 Minami-osawa, Hachiouji, Tokyo 192-0397, Japan
Tohoku University, Aoba Aramaki, Sendai 980-8578, Japan
ISAS, 3-1-1 Yoshinodai, Sagamihara, Kanagawa 229-8510, Japan
1. Introduction
CL0024+17 is one of the most extensively studied lensing clusters of galaxies, located at . Since the discovery of the multiply lensed arc system, several authors modeled the matter distributions in the cluster. Tyson, Kochanski, & Dell’Antonio (1998) constructed a very detailed mass map and suggested that the dark matter profile has a soft core. Broadhurst et al. (2000) measured the arc redshift to be 1.675 and also built a lens model in a simplified manner.
On the other hand, the X-ray emitting gas is an excellent tracer of the dark matter potential. Soucail et al. (2000) performed a combined analysis of the ROSAT and ASCA data and estimated the cluster mass within the arc radius (the X-ray mass, hereafter). They found that there is about a factor of discrepancy between the X-ray mass and the strong lensing mass (Tyson et al. 1998; Broadhurst et al. 2000). Because the ROSAT HRI image suggested the elongated gas distribution, they considered that the discrepancy may be caused by the irregular mass distribution.
However, there were still large measurement uncertainties in both the X-ray temperature and the image morphology. It was mainly because of the heavy contamination from the bright seyfert galaxy. Thus for the cluster mass estimation the temperature determination is crucial. In this paper, we report on the accurate measurements of the temperature and the morphology with Chandra, from which we discuss whether there is an inevitable mass discrepancy between the X-ray and the strong lensing. We use km/s/Mpc and . kpc at .
2. Observation
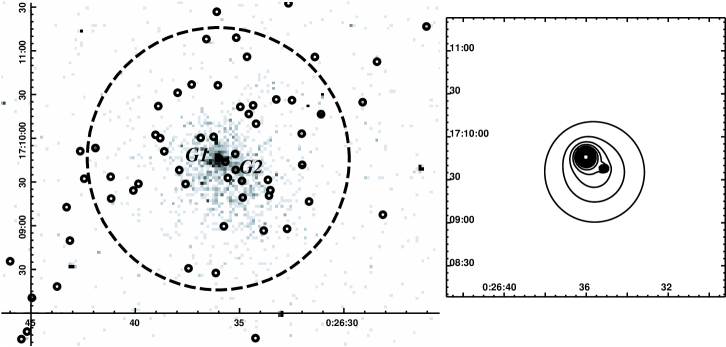
We observed CL0024+17 with the Chandra ACIS-S detector on September 20, 2000. The net exposure time is 37121 sec. In Figure 1a, we show the ACIS-S3 image. The strongest X-ray peak is at (00:26:36.0, +17:09:45.9)J2000 and the extended emission is detected out to in radius. The point sources detected in the field were removed in the following analysis.
3. Spectral analysis
We extracted the cluster spectrum from a circular region of , centered at the X-ray peak (the dashed circle in Figure 1a). The background was estimated from the ring region. We fitted the spectrum to the MEKAL thin-thermal plasma model with the Galactic absorption (Figure 2a) and determined the temperature to be keV (90% error). This is consistent with our previous result with ASCA (Soucail et al. 2000; Ota & Mitsuda 2002). We detected the strong redshifted Fe-K line from the cluster for the first time. The iron abundance is solar.
In order to investigate the radial temperature profile, we accumulated spectra from four ring regions with various radii and fitted them with the MEKAL model. The radius ranges were chosen so that the each spectrum contains more than 400 photons. We found that there is not any meaningful temperature variation against radius (Figure 2b); the gas is consistent with being isothermal.
4. Image analysis
4.1. X-ray surface brightness and galaxy distribution
Though the original ACIS CCD has a pixel size of , we rebinned the image by a factor of 4. We restrict the energy range to 0.5 – 5 keV in the image analysis. We find that there is the second X-ray peak at (00:26:35.1,+17:09:38.0)J2000. From comparison with the galaxy catalog by Czoske et al. (2001), we recognized that the three central bright elliptical galaxies are located at the positions consistent with the fist and second X-ray peaks (G1 and G2, hereafter). Note that G1 contains two of the three elliptical galaxies (Figure 1a).
4.2. 2-D surface brightness distribution
In order to determine the X-ray emission profile of the ICM, we fitted the 2-dimensional surface brightness distribution with a model consisting of three profiles which we consider to represent emissions from two elliptical-galaxy components and ICM component; . We fitted the image of region with the maximum-likelihood method. The center positions of the two elliptical-galaxy components were fixed at the G1 and G2 peaks, respectively, while for the third component, which we consider describes the ICM emission, the position was allowed to vary. The results of the fits are shown in Table 1 and Figure 1b. In order to check the goodness of the fit, we rebinned the image into two single dimensional profiles of two perpendicular directions and calculated the values between the model and data profiles to find they are enough small ( for 99 degree of freedom). The best-fit cluster center position is kpc away from the G1 peak. We consider that the emission of G1 and G2 can be attributed to the elliptical galaxies because of the small luminosities. Furthermore, we tested the significance of the ellipticity of the cluster image and found it is not significant ().
| Model | Center position | |||
|---|---|---|---|---|
| component | RA,Dec in J2000 | kpc | erg/s | |
| G1 | 00:26:36.0,+17:09:45.9 (F) | 1 (F) | ||
| G2 | 00:26:35.1,+17:09:38.0 (F) | 1 (F) | 10 (F) | |
| Cluster | 00:26:35.6,+17:09:35.2† |
(F) Fixed parameters. † The 90% errors are for RA and for Dec.
5. Mass estimation and comparison
From the spectral and spatial analysis mentioned above, we found that the gas is isothermal and can be described with the spherical -model. Assuming the gas is hydrostatic, we obtained the projected X-ray mass within the arc radius to be . On the other hand, the strong lensing mass was estimated to be by Tyson et al. (1998). Therefore the discrepancy of a factor of 3 is evident. This is consistent with our previous result (Soucail et al. 2000). On the other hand, the X-ray surface brightness profile of the NFW potential is similar to that of the -model and can be converted from the -model parameters through the relations of and (Makino, Sasaki, & Suto 1998). We thus derived the gas profile for the NFW case based on the results of -model fitting and estimated the X-ray mass to be . Thus the discrepancy still remains even in this case.
Since the gas is isothermal and spherical, we consider that the gas is relaxed in the cluster potential and the hydrostatic equilibrium is a good approximation in the X-ray mass estimation. This suggests that the lens mass is significantly overestimated. Czoske et al. (2001, 2002) measured the redshift distribution of galaxies in the direction of CL0024+17 and revealed the presence of foreground and background groups of galaxies. This may possibly enhance the strong lensing mass. Thus updated lens modeling of the cluster is urged.


References
Tyson, J.A., Kochanski, G.P., & Dell’Antonio, I.P. 1998, ApJ, 498, L107
Broadhurst, T., Huang, X., Frye, B., & Ellis, R. 2000, ApJ, 534, L15
Soucail, G., Ota, N., Böhringer, H., Czoske, O., Hattori, M., & Mellier, Y. 2000, A&A, 355, 433
Ota, N.,& Mitsuda, K. 2002, ApJ, 567, L23
Makino, N., Sasaki, S., & Suto, Y. 1998, ApJ, 497, 555
Czoske, O., Kneib, J.-P., Soucail, G., Bridges, T.J., Mellier, Y., & Cuillandre, J.-C. 2001, A&A, 372, 391
Czoske, O., Moore, B., Kneib, J.-P., & Soucail, G. 2002, A&A, 386, 31