THE CHEMICAL UNIFORMITY OF HIGH DLA PROTOGALAXIES
Abstract
We investigate chemical abundance variations along the sightlines through 13 damped Ly systems (DLA). We introduce a technique designed to identify abundance variations in multiple velocity bins along the sightlines and perform a series of Monte-Carlo simulations to derive quantitative limits and values. The majority of these DLA have very uniform relative abundances: 95 c.l. upper limits of 0.2 dex dispersion along the sightline and best fit values typically dex. This surprising result indicates the gas comprising individual DLA has similar enrichment history, nearly identical differential depletion, and small abundance variations relating to ionization corrections. This uniformity contrasts with stellar abundance variations observed within the Galaxy and with the differences in abundances observed between galaxies of the Local group. It also contrasts with variations in differential depletion along sightlines through the SMC, LMC, and Milky Way. The results constrain the process of metal production and dust formation in the early universe and reflect on processes of galaxy formation. In terms of depletion the observations indicate a very low porosity of significantly depleted gas, substantially lower than the filling factor observed in present-day metal-poor galaxies. Finally, the observed chemical uniformity may present a difficult challenge to scenarios which assume individual DLA are comprised of multiple protogalactic clumps.
Accepted to the Astrophysical Journal: September 3, 2002
1 INTRODUCTION
Studies of chemical abundance ratios in Galactic metal-poor stars address processes of nucleosynthesis, star formation, and ultimately galaxy formation in the early universe. Of particular importance is revealing variations or trends in the relative abundances which identify distinct stellar populations, unique nucleosynthetic sites, and/or provide insight into the time-scales and channels of star formation. In very low metallicity ([Fe/H] ) Galactic stars, for example, observers have identified important trends in the Fe-peak elements and large variations in several abundance ratios (e.g. Co/Fe, Sr/Fe) which suggest unique nucleosynthetic processes and inhomogeneous chemical enrichment (e.g. McWilliam et al., 1995; Johnson, 2002). In contrast, the abundance patterns of the majority of Galactic stars with [Fe/H] are remarkably similar (Gratton & Sneden, 1991; Fulbright, 2000), suggesting a rapid enrichment phase for the Galactic halo over this metallicity range. At higher metallicity, there are important trends in the relative abundances, in particular the steady decline of the -elements (O,S,Si) to the Fe-peak, which mark the onset of Type Ia SN enrichment (Tinsley, 1979). Comparisons of these relative abundances with extragalactic stellar populations help map paths of galaxy formation (e.g. Matteucci & Recchi, 2001). In the few galaxies where detailed studies can be performed (the SMC and dwarf spheroidals; Venn, 1998; Shetrone, Côté, & Sargent, 2001; Bonifacio et al., 2000), one often observes significant differences with stars at the same metallicity in the Milky Way. Future studies of entire stellar populations within these galaxies will help refine their star formation histories.
An examination of relative abundances of gas in local galaxies complements these stellar abundance studies. Sightlines through the Galactic ISM probe gas with a range of physical conditions (e.g. volume density, dust-to-gas ratio, ionization state). Therefore, the observed gas-phase abundance ratios along a sightline may vary by an order of magnitude as the sightline penetrates clouds arising in various phases of the ISM (e.g. Savage and Sembach, 1996). Differences in nucleosynthetic enrichment or photoionization are likely to be small such that the variations primarily reflect differences in depletion level or dust composition. The LMC and SMC also exhibit variations in these gas-phase abundance ratios (Welty et al., 1999, 2001) and together the observations impact models for the formation and distribution of dust as well as the physical state of galactic interstellar media.
Observations of the damped Ly systems (DLA) – quasar absorption line systems with – probe the ISM of high galaxies. Surveys of the DLA reveal chemical evolution in the early universe (Pettini et al., 1994, 1997; Prochaska & Wolfe, 2000), and examine the dust depletion, nucleosynthetic enrichment, and ionization of these protogalaxies (Lu et al., 1996; Vladilo, 1998; Prochaska & Wolfe, 2002; Prochaska et al., 2002a). Prochaska & Wolfe (2002) recently reviewed the chemical abundances of the DLA and emphasized the uniformity in the relative abundance patterns (e.g. Si/Fe, Ni/Fe, Zn/Si) of their systems. Even though damped Ly metallicities span over an order of magnitude, the systems show very similar abundance ratios suggesting protogalaxies have common enrichment histories. The authors do identify a mild trend of increasing Si/Fe and Zn/Fe with increasing metallicity which is well explained by the effects of dust depletion, yet even this trend spans only a factor of in the ratios. In addition to the uniformity in abundance patterns from galaxy to galaxy, Prochaska & Wolfe (2002) asserted that this uniformity holds along the sightlines penetrating each protogalaxy. That is, the individual ’clouds’ comprising metal-line profiles show the same relative abundances within a given damped Ly system. If verified, this would have important implications for the ISM of high galaxies and the enrichment of gas in the early universe.
Prochaska & Wolfe (1996) first quantitatively investigated variations in the chemical abundances of a single damped Ly system. They compared Zn, Si, Fe, Ni, and Cr ionic column densities along the observed velocity profiles using the apparent optical depth method (Savage and Sembach, 1991). Their analysis showed that the chemical abundances were uniform to within statistical uncertainties. They then argued that the absence of significant variations demonstrates a low depletion level within this protogalaxy. More recently, Lopez et al. (2002) performed the first detailed line-profile analysis of the relative abundances for a different damped system and also found nearly constant column density ratios among the components comprising the line-profile solution (see also Petitjean, Srianand, & Ledoux 2002). Together, these studies argue the gas within high protogalaxies has a similar enrichment history and uniform differential depletion.
In this paper, we search for variations in the relative abundances along the sightlines of 13 damped Ly systems. These systems were selected to have high signal-to-noise velocity profiles with velocity widths exceeding 40 km s-1. The latter criterion ensures a large enough baseline to examine variations within the protogalaxy. We introduce a quantitative method which can be applied to our observations as well as mock spectra derived from numerical simulations and semi-analytic models of galaxy formation. The technique assesses changes in the physical conditions and enrichment histories of the gas within each damped system. In turn, our results place valuable constraints on the various morphological models of the damped Ly systems and, ultimately, scenarios of galaxy formation.
| QSO | [M/H]aaMetallicity derived from Zn, Si, or S | Transition | [X/Y]T | bbLogarithmic RMS dispersion in X/Y | ||||||||
|---|---|---|---|---|---|---|---|---|---|---|---|---|
| (km s) | Pairs | (dex) | (km s-1) | (dex) | (dex) | (dex) | (dex) | |||||
| PH957 | 2.309 | –1.46 | 54 | Zn II 2026 | 0.22 | 10 | 3 | 0.18 | 1.65 | 0.24 | 0.47 | 0.03 |
| Ni II 1741 | ||||||||||||
| Q0201+36 | 2.463 | –0.41 | 202 | Si II 1808 | 0.45 | 20 | 12 | 0.07 | 3.21 | 0.38 | 0.15 | 0.09 |
| Fe II 1608 | ||||||||||||
| Q0347–38 | 3.025 | –1.17 | 94 | Si II 1808 | 0.50 | 10 | 5 | 0.47 | 11.0 | 0.74 | 0.90 | 0.39 |
| Fe II 1608 | ||||||||||||
| Q0458–02 | 2.040 | –1.19 | 86 | Zn II 2026 | 0.39 | 20 | 4 | 0.48 | 4.81 | 0.35 | 0.45 | 0.15 |
| Cr II 2056 | ||||||||||||
| HS0741+47 | 3.017 | –1.69 | 40 | S II 1259 | 0.24 | 10 | 5 | 0.08 | 2.23 | 0.23 | 0.22 | 0.07 |
| Fe II 1608 | ||||||||||||
| PSS0957+33 | 4.180 | –1.50 | 346 | Si II 1304 | 0.37 | 20 | 6 | 0.26 | 5.34 | 0.70 | 0.68 | 0.29 |
| Fe II 1608 | ||||||||||||
| Q1223+17 | 2.466 | –1.59 | 94 | Si II 1808 | 0.13 | 10 | 10 | 0.11 | 1.82 | 0.40 | 0.19 | 0.09 |
| Ni II 1751 | ||||||||||||
| Q1331–17 | 1.776 | –1.30 | 70 | Zn II 2026 | 0.82 | 10 | 9 | 0.23 | 22.8 | 0.66 | 0.41 | 0.24 |
| Fe II 2374 | ||||||||||||
| GB1759+75 | 2.625 | –0.82 | 78 | Si II 1808 | 0.35 | 10 | 8 | 0.18 | 2.50 | 0.44 | 0.27 | 0.11 |
| Ni II 1751 | ||||||||||||
| Q2206–19 | 1.920 | –0.42 | 130 | Si II 1808 | 0.40 | 20 | 7 | 0.06 | 1.17 | 0.24 | 0.15 | 0.04 |
| Fe II 1611 | ||||||||||||
| Q2230+02 | 1.864 | –0.74 | 177 | Si II 1808 | 0.23 | 20 | 7 | 0.08 | 1.30 | 0.31 | 0.18 | 0.03 |
| Ni II 1741 | ||||||||||||
| Q2231–00 | 2.066 | –0.86 | 127 | Si II 1808 | 0.28 | 20 | 4 | 0.08 | 0.93 | 0.26 | 0.33 | 0.03 |
| Ni II 1741 | ||||||||||||
| Q2359–02 | 2.154 | –1.58 | 127 | Si II 1526 | 0.32 | 20 | 4 | 0.08 | 0.97 | 0.24 | 0.32 | 0.04 |
| Fe II 1608 |
2 ANALYSIS OF THE OBSERVATIONS
To investigate variations in the relative abundances of the damped systems, we focus on pairs of low-ion transitions for 13 damped systems from our damped Ly database111http://kinpgin.ucsd.edu/hiresdla/ (Prochaska et al., 2001). We selected damped Ly systems with transition pairs that satisfied the following criteria: (1) signal-to-noise (S/N) 15 per pixel; (2) a velocity width km s-1 to provide a base-line for examining abundance variations; (3) transitions which are not saturated but have peak optical depth with significance; (4) a transition pair with different refractory characteristics, nucleosynthetic origin, and/or photoionization dependencies. With respect to the last criterion, the -ions (e.g. Si+, S+) are ideal complements to the Fe-peak ions (e.g. Ni+, Fe+). The former are non-refractory or mildly refractory, are primarily produced in Type II SN and are less ionized in H II regions, while the latter are refractory, primarily produced in Type Ia SN, and in the case of Fe+ are more highly ionized. Table 1 summarizes the damped Ly systems examined in this paper and lists the transitions comprising our analysis. In nearly every case, we observe multiple transitions for a given damped Ly system and are confident that the transitions listed in Table 1 are free of line-blending.
We considered two techniques for probing variations in the relative abundances of a pair of metal-line profiles: (1) a comparison of the ionic column densities derived from the apparent optical depth (Savage and Sembach, 1991) in a series of velocity bins; and (2) a comparison of the column densities derived from Voigt profile fitting of individual velocity components. The latter approach has the advantage that one presumably isolates abundances in specific physical components (e.g. ’clouds’ or ’clumps’), whereas the velocity bins may contain one or more such components. There are several weaknesses, however, to the Voigt profile analysis. First, identifying the component structure of a metal-line profile is both time consuming and somewhat arbitrary. One typically introduces enough ’clouds’ to produce a line-profile solution that yields a reduced . Therefore, high S/N profiles invariably exhibit more components than lower quality data. Second, blended components generally exhibit degeneracies between their column densities. In order to accurately compare ionic column densities one must bin these blended components and carefully consider their correlated errors. Third and most important, in cases where a pair of transitions have very large abundance differences it may be impossible to derive a self-consistent profile solution. For example, one ion may show several components which are not observed in the other ion. In these cases, one cannot compare the abundances component by component. The risk is that this would bias the results against systems with large abundance variations.
In this paper, we concentrate on the apparent optical depth method. For many of the sightlines presented here, we have also examined the results from a Voigt profile analysis and find similar results (e.g. the systems included in an analysis of the fine structure constant; Murphy et al., 2001). After experimenting with the size of velocity bins, we found that binning the apparent optical depth over 10 pixels (20 km s-1) offered the best comprise between minimizing pixel-to-pixel noise and maximizing velocity resolution. For the very highest S/N data, we reduced the 10 pixel bin to 5 pixels. In all cases, we clipped velocity bins with statistical significance less than , i.e., in regions where there is very little absorption. At 20 km s-1 or even 10 km s-1, it is possible that the velocity bins include two or more ’clouds’ with differing abundances which are averaged to a single value; we do not resolve abundance variations on this small scale. On the other hand, the typical separation between the main components comprising the metal-line profiles is . Our analysis focuses on these main components.
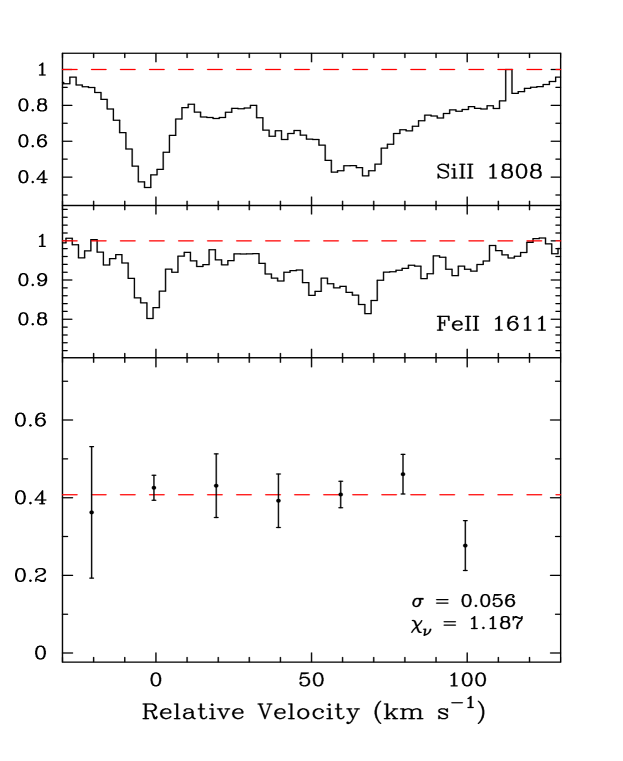
Figure 1 presents the results for the damped Ly system at toward Q2206–19 which is roughly representative of the full sample (Figure 2). The upper panels show the Si II 1808 and Fe II 1611 velocity profiles while the lower panel plots the ratio (Si+/Fe+) normalized to solar relative abundances for the statistically significant velocity bins. The dashed-line in the lower panel indicates the ratio of the total column densities derived from these two profiles. We compare the individual bins against this total ratio to examine departures from uniformity. The error bars only reflect statistical error; we do not account for systematic errors like continuum placement. In the systems analysed in this paper, which have relatively high quality data, we expect such systematic errors are small. The damped Ly system presented in Figure 1 shows very small variations over the entire profile. The scatter in the relative abundances is ( dex) of the total ratio, consistent with the expected statistical error, i.e., the reduced .
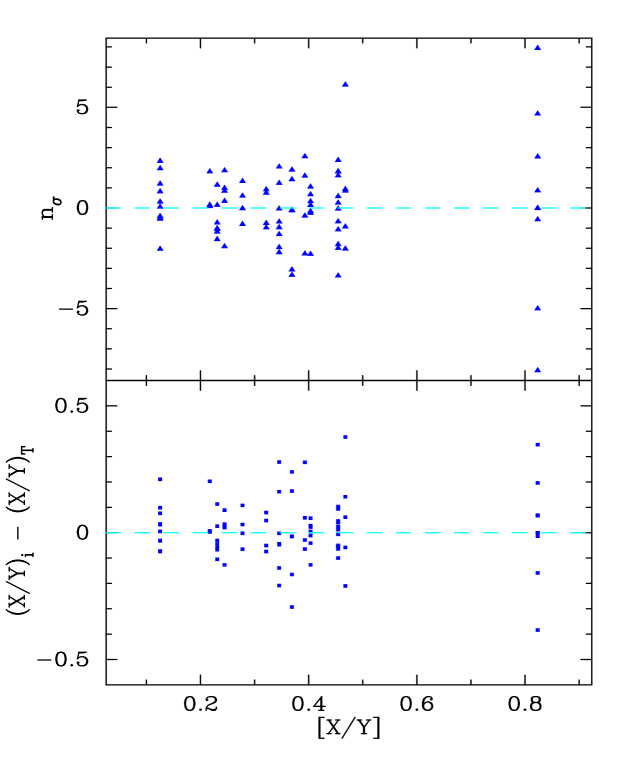
We have repeated this analysis for the remaining damped systems and summarize the results for all of the velocity bins for the 13 DLA in Figure 3. The top panel shows the departure from uniformity in numbers of standard deviation where is derived with standard propagation of statistical error. The lower panel presents the departures on a logarithmic scale relative to the total X/Y ratio. Together the two panels describe the magnitude and significance of the variations in our sample. For both panels, the x-axis indicates the total enhancement of X/Y relative to solar on a logarithmic scale [X/Y]T. Higher [X/Y]T values indicate systems with larger nucleosynthetic enhancements, dust depletion, and/or photoionization levels.
Consistent with a qualitative inspection of the damped Ly profiles, there are only two systems with deviations dex and only a few others have statistically significant deviations at greater than dex. Of the two systems with the largest departures from uniformity, one is the damped system at toward Q1331+17 which shows the largest [X/Y] value and might have been most expected to show significant deviations. The other system, at toward Q0347–38, was previously known to have abundance differences among its metal-line profiles and H2 absorption lines (Levshakov et al., 2002). Inspecting Figure 3, one infers that the abundance variations within most damped systems are at levels less than 0.2 dex. In the following section, we quantitatively address the maximum variations allowed by the entire sample and the maximum deviations allowed by individual damped systems.

![[Uncaptioned image]](/html/astro-ph/0209193/assets/x3.png)
3 MEASURES OF INTRINSIC VARIATION
To place quantitative constraints on the nucleosynthetic and differential depletion variations in the DLA, we will now determine the maximum abundance variations allowed by our observations. For a crude measure of the typcial abundance variation, we evaluate the maximum component-to-component variation allowed when considering the entire sample of damped Ly systems together, i.e., the maximum intrinsic abundance variation which is consistent with the complete distribution of observed deviations (Figure 3). To this end, we place limits on the intrinsic abundance dispersion which is the combined variation due to nucleosynthetic enrichment, differential depletion, and photoionization effects. Specifically, defines a uniform distribution of intrinsic abundance variations for the velocity bins comprising a single DLA.

For values ranging from 0 to 0.3 dex, we perform a series of Monte-Carlo analyses. In each Monte-Carlo run, we simulate 1000 damped systems each with velocity bins. For every velocity bin, we randomly draw four quantities: (1) the statistical uncertainty in the abundance ratio, drawn from the observed distribution of uncertainties for all bins of all of the damped systems in our sample; (2) the contribution to the observed ratio from this statistical uncertainty assuming a Gaussian distribution with mean of zero and variance ; (3) a intrinsic abundance variation drawn uniformly222Note that we assume uniform distributions for the abundance deviations throughout this paper. If we adopted a normal distribution, we would place even tighter constraints on the abundance variations. from the interval ; and (4) a weighting factor for each bin drawn uniformly from 1 to 10 in order to simulate the observed variability in component strengths. We then calculate the total ratio:
| (1) |
where which corresponds to the [X/Y][X/Y]T values displayed in Figure 3. For each velocity bin in every damped system, we determine the statistical significance
| (2) |
of the variation and for the 1000 trials determine a distribution of values. This Monte-Carlo distribution of values is then compared against the observed distribution (top panel of Figure 3) with a two-sided Kolmogorov-Smirnov (K-S) test. The K-S statistical test focuses on the median of two distributions and the K-S probability gives the likelihood that two distributions could have been drawn from the same parent population (Press et al., 1992).
In Figure 4 we present the results of our Monte-Carlo simulations as a confidence-level plot for a range of values. The 99 c.l. limits for are 0.07 and 0.23 dex. If a single abundance process dominates the abundance variations, these are the limits on that process. If multiple processes contribute (e.g. differential depletion and nucleosynthetic enrichment), then the limits on each process are even tighter. Note, these conclusions are insensitive to the value of for . The results in Figure 4 quantitatively support the characteristic of uniformity readily observed in the metal-line profiles. If depletion and nucleosynthetic variations are present in the damped systems, they are present at very small levels in the majority of protogalaxies. While the simulations imply strict upper limits to the magnitude of abundance variations, Figure 4 also reveals that the observations are inconsistent with zero abundance variations. At the 95 c.l., we find that must exceed 0.05 dex to match the observations333 It is possible that we are slightly overestimating this lower limit (and the upper limits) because we have not included systematic error in our analysis, but we expect this would contribute at dex.. Therefore, the data do require some intrinsic abundance variations.
Impressed by the absence of abundance variations in the detailed profiles as well as the integrated [X/Y]T values, we posed the following hypothesis: Are the abundance ratios within individual damped systems consistent with being drawn from a single population described by the distribution of [X/Y]T values? To address this hypothesis, we performed a similar Monte-Carlo simulation where the [X/Y] values for each velocity bin are drawn from the observed [X/Y]T for all of the damped Ly systems in our database (over 30 DLA; Prochaska et al., 2001), i.e., the variations are due to differences in [X/Y]T among the observed damped Ly systems. We simulated 1000 damped systems with bins each and found a KS probability suggesting the dispersion in the component-by-component abundances of the DLA is consistent with the dispersion in the integrated [X/Y]T values: The damped systems exhibit a ’scale-free dispersion’ in their relative abundances. This trait did not have to hold for these protogalaxies. One could surmise a scenario where the gas ’clouds’ comprising a single damped system would have the same physical properties and abundances ratios but their [X/Y]T values would differ by greater than 1 dex from system to system. Conversely, the gas comprising a single damped system could exhibit a range of depletion levels and nucleosynthetic enrichment which average out to a very similar [X/Y]T ratio in all damped systems. In our current sample, however, we find that both the gas within a single damped system and the systems together have similar dispersion in the relative abundances.
The results presented in Figure 4 provide an estimate of the overall variations in the damped Ly systems. One can perform a similar set of Monte-Carlo simulations to investigate the deviations allowed within each damped system and then examine trends with other physical properties of the damped systems (e.g. [X/Y]T, as in Figure 3). We will consider three measures of the uniformity within individual damped systems. With one measure, we study an extreme scenario where all of the variation arises from a single velocity bin. We calculate, , the minimum [X/Y] variation in a single velocity bin which gives in over of the trials in the Monte-Carlo analysis. The two other measures assume deviations in all of the velocity bins with values drawn from a uniform distribution. We calculate (i) , the minimum variation which when applied to every velocity bin gives in over of the trials; and (ii) , the variation which applied to each component has the highest probability of yielding . We believe the values are the most realistic upper limits to abundance variations and that reflects the most likely value.
For each damped system, we take the observed number of velocity bins and adopt the measured statistical errors. To simplify the analysis, we parameterize all of the sources of intrinsic abundance variations into a single term as above. Columns 11-13 of Table 1 present the results from a series of Monte-Carlo simulations comprised of 1000 trials for each damped system. It is important to stress that and each has a systematic behavior related to the number of bins observed. Generally, systems with lower will have statistically lower values and higher values, while the opposite holds for systems with . This behavior is simply related to Poissonian statistics. In general, the derived and values corroborate the picture revealed by Figure 4, i.e., the upper limits on the observed variations in individual DLA are between 0.2 and 0.4 dex. In several systems – especially those with higher S/N – the upper limits are below 0.2 dex at the 95 c.l. and dex. Within these systems, it is difficult to accommodate any significant variation in the intrinsic abundances.
4 IMPLICATIONS
4.1 Nucleosynthetic Enrichment and Dust Depletion
The results presented in the previous section demonstrate that the majority of damped Ly systems have relative ionic column abundances which are uniform to better than 0.2 dex. In fact, the majority of components show departures dex. This analysis reveals an important characteristic of high galaxies: the gas ’clouds’ which comprise these protogalaxies apparently have very similar physical properties and nucleosynthetic enrichment histories.
| Gal | PhaseaaCrude phase description, largely based on depletion level | D(Zn) | D(Si)bbDepletion factor (e.g. [X/Zn]) | D(Fe) | [Zn/Fe] | [Si/Fe] | Ref |
|---|---|---|---|---|---|---|---|
| MW | warm halo | 0.0 | –0.3 | –0.6 | +0.6 | +0.3 | 1 |
| MW | warm disk | 0.0 | –0.4 | –1.4 | +1.4 | +1.0 | 1 |
| MW | cold disk | –0.1 | –1.3 | –2.2 | +2.1 | +0.9 | 1 |
| LMC | warm halo | 0.0 | –0.2 | –0.4 | +0.4 | +0.2 | 3 |
| LMC | warm disk | 0.0 | –0.1 | –0.9 | +0.9 | +0.8 | 3 |
| LMC | cold disk | 0.0 | –0.4 | –1.2 | +1.2 | +0.8 | 3 |
| SMC | warm halo | 0.0 | 0.0 | –0.6 | +0.6 | +0.6 | 2 |
| SMC | warm disk | 0.0 | 0.0 | –1.4 | +1.4 | +1.4 | 2 |
| SMC | cold disk | 0.0 | 0.0 | –2.2 | +2.2 | +2.2 | 2 |
In several respects this uniformity is unexpected. Consider first the variations one might predict from nucleosynthetic enrichment. We stress that the metallicities of the individual gas ’clouds’ comprising a damped Ly system are unknown because the H I line-profiles are unresolved. Variations in metallicity greater than a factor of 10 are possible if not probable. The components may have very different enrichment levels and could be expected to show different nucleosynthetic patterns. The magnitude of variations in the nucleosynthetic patterns, however, would depend on the actual range of metallicities and the detailed star formation histories. While extremely metal-poor Galactic halo stars exhibit significant variations in their relative abundances (e.g. Co/Ni, Zn/Fe: McWilliam et al., 1995; Johnson, 2002), the majority of Galactic stars with [Fe/H] to dex have nearly uniform relative abundances (Gratton & Sneden, 1991; Fulbright, 2000). There are, however, a number of stars and globular clusters in this metallicity range which show significantly lower /Fe ratios (e.g. Ru 106, Pal 12, Cen, etc.; Brown, Wallerstein, & Zucker, 1997; Nissen & Schuster, 1997; Smith et al., 2000; Stephens & Boesgaard, 2002). Although these stars may have a distinct origin from the bulk of the Galactic halo stars (e.g. accreted from other galaxies), they reveal nucleosynthetic variations at all metallicity.
This point is further emphasized by the differences between the Milky Way abundances and other local galaxies (e.g. LMC, SMC, dSph galaxies: Venn, 1998; Shetrone, Côté, & Sargent, 2001). In the SMC, stars with metallicity [Fe/H] have solar Si/Fe ratios (Venn, 1998) in stark contrast with values of [Si/Fe] observed at the same metallicity in the Milky Way. Similarly, the few measurements of dwarf spheroidal galaxies (Shetrone, Côté, & Sargent, 2001; Bonifacio et al., 2000; Shetrone, 2002) show a dispersion in Si/Fe of 0.25 dex at metallicity between 1/10 and 1/100 solar. Altogether, one observes a range in /Fe of at least 0.3 dex both within a given galaxy and from galaxy to galaxy. One might have predicted a similar dispersion in the majority of high protogalaxies. On the other hand, it is important to note that Kobulnicky & Skillman (1997) found only small deviations in the H II regions throughout NGC 1569. They concluded that the by-products of star formation within this galaxy reside in a hot 106 K phase which is unmixed with the general ISM. If this process is important at high , it would impact the abundance variations within DLA.
In addition to the implications for nucleosynthetic enrichment in the damped systems, our observations impact the nature and prevalence of dust in high protogalaxies. Table 2 summarizes the typical depletion levels and gas-phase abundance ratios for various interstellar phases of the Milky Way, LMC, and SMC (Savage and Sembach, 1996; Welty et al., 1997, 1999, 2001). Because the [Si/Fe] and [Zn/Fe] ratios vary significantly from phase to phase, most sightlines penetrating these galaxies show variations in excess of 0.5 dex. For Si/Fe, the situation is complicated because Si is refractory, e.g., one observes roughly the same Si/Fe ratio in the Milky Way warm and cold disk gas even though the depletion levels differ by dex (Table 2). Nevertheless, most sightlines through the Galaxy and Magellanic Clouds show large variations in Si/Fe. This is in stark contrast with our observations of the damped Ly systems.
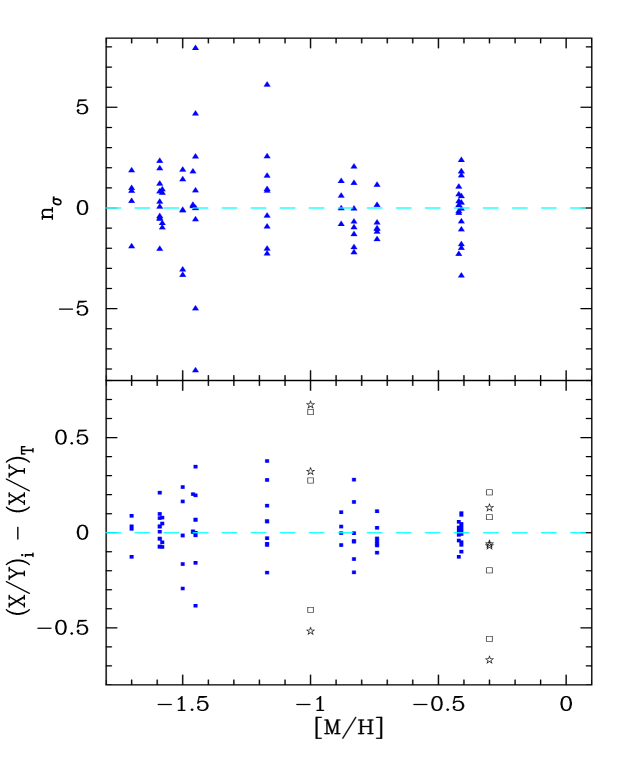
When comparing the damped systems against these galaxies, it is important to keep in mind that even the SMC is more metal-rich than most damped systems. If dust formation is very sensitive to gas metallicity, one might expect variations in differential depletion for only the most metal-rich damped systems. Interestingly, we observe no correlation between the magnitude of abundance variations and metallicity. Figure 5 plots the deviations from uniformity and their significance as a function of the gas metallicity (either Si/H, Zn/H or S/H) including a set of values for the LMC and SMC (Welty et al., 1999, 2001). Note that the systems with the highest metallicity have among the most uniform abundances in our sample. It appears that the ISM of the majority of DLA – independent of metallicity – is significantly different from modern galaxies. This begs an obvious but puzzling question: How is a galaxy like the SMC different from the majority of DLA such that it regularly shows highly depleted gas? We also emphasize that the low values of indicate it is rare in the damped systems to have even a single, highly depleted ’cloud’. If highly depleted gas exists at high redshift, its filling factor is very small in most protogalaxies.
Finally, independent of expectations from abundance variations observed in local galaxies, there is a long standing debate on whether the damped Ly abundances reveal an underlying Type Ia or Type II SN enrichment pattern (e.g. Lu et al., 1996; Vladilo, 1998; Prochaska & Wolfe, 2002; Vladilo, 2002). These two patterns have /Fe ratios differing by dex and imply very different enrichment histories (e.g. Lindner, Fritze-von Alvensleben, & Fricke, 1999). The source of this debate is the difficulty in disentangling the nucleosynthetic pattern from the depletion patterns of the gas-phase abundances. Although this matter remains unsettled, it is possible – if not likely – that some damped systems are dominated by Type Ia SN enrichment with solar /Fe ratios while others exhibit the -enriched patterns associated with Type II SN. Most relevant to the current discussion, however, is the prospect that both processes contribute to the abundances of individual protogalaxies. The observed chemical uniformity of the damped Ly systems places tight constraints on possible nucleosynthetic variations. For example, scenarios where the majority of gas has nearly solar Si/Fe or Zn/Fe ratios with a single component enhanced by 0.3 dex are ruled out in over half of the DLA.
4.2 The Physical Nature of the DLA
To fully appreciate the implications of the DLA abundance uniformity, one would like to interpret the results in terms of the physical nature of the damped systems. Unfortunately, the morphology of the damped Ly systems remains an open and difficult question. While the low-ion kinematics are remarkably well described by a thick, rotating disk (Prochaska & Wolfe, 1997b, 1998), the observations also permit scenarios within the CDM hierarchical cosmology that describe DLA as multiple merging ’clumps’ bound to individual dark matter halos (Haehnelt et al., 1998; McDonald & Miralda-Escud, 1999; Maller et al., 2001). Furthermore, several authors have also claimed that the damped Ly systems might be explained by outflows from SN winds (Nulsen, Barcons, & Fabian, 1998; Schaye, 2001). The difficulty in distinguishing between these scenarios stems from the limited information provided by the ’pinhole’ nature of quasar absorption line studies. Although a statistical sample of systems can confidently rule out many proposed scenarios (Prochaska & Wolfe, 1997b), a given sightline cannot uniquely express the galaxy’s morphology and even a sample of sightlines is limited. In the following, we reflect on several of the leading scenarios but avoid outflow scenarios because these models have only been crudely developed and it remains unclear whether they can successfully account for the velocity fields of most DLA. Nevertheless, many of the conclusions for the other models apply to the wind scenarios.
Assume, first, that the DLA primarily arise from gas ’clouds’ within a single, gravitationally bound system. In terms of nucleosynthetic variations, the observed uniformity might be easily accommodated within this scenario. In particular, one can assume that the majority of gas and stars comprising the protogalaxy have had a similar chemical enrichment history. There might be regions of local star formation which would exhibit a dispersion in nucleosynthetic enrichment, but these regions would have small filling factor and the by-products may not be directly dispersed into the general ISM (e.g. Kobulnicky & Skillman, 1997). For larger, more massive systems one might require that the system is well mixed, i.e., the dynamical time is short compared to the age of the system. At , the galactic dynamical time is Myr assuming and where is the spin parameter and is the virial radius (Mo, Mao, & White, 1998). Therefore, it is reasonable to expect that the nucleosynthetic enrichment within a single protogalaxy would not lead to variations greater than 0.1 dex and possibly much less.
In contrast with nucleosynthetic variations, the absence of differential depletion variations is striking. The low values for most damped systems indicate it is rare for sightlines to penetrate even a single, highly depleted gas ’cloud’. This is in stark contrast to the LMC, SMC, and Milky Way where one routinely intersects clouds with a broad range of depletion levels. It appears that the damped systems are comprised almost exclusively of either undepleted gas or gas with warm halo depletion patterns. If gas with high levels of depletion exist at high , its porosity is very small, at least within the surface density contour defining a damped Ly system. Perhaps highly depleted gas exists only in the inner, densest regions of a protogalaxy which has very small cross-section relative to the outer layers of gas. This observational constraint may have important implications for the detailed nature of star formation in young galaxies.
Within the CDM cosmogony, the scenarios which best reproduce the damped Ly kinematics of larger systems are those where quasar sightlines penetrate multiple ’clumps’ or satellites within a given dark matter halo. These satellites represent the remnants of mergers between the present dark matter halo and a previous (now consumed) halo. In this scenario, the uniformity of abundance ratios within the damped Ly abundances constrains the relative abundances of all of the satellites comprising a damped system. Presumably, these satellites have unique enrichment histories and unique physical characteristics, e.g., gas fraction, molecular gas content, density, velocity fields. In terms of nucleosynthesis, this implies the satellites share a similar enrichment history.
On theoretical grounds, the observed /Fe ratio corresponds to the ratio of Type II to Type Ia SN and, therefore, crudely assesses the rate of star formation (e.g. Tinsley, 1979). As described above, galaxies in the local universe exhibit a range of /Fe ratios at the range of metallicities observed for the damped Ly systems. Altogether, one observes a variation in /Fe of 0.3 dex both within a given galaxy and from galaxy to galaxy. The accreted satellites which comprise a damped system in these CDM scenarios might be expected to have a similar range of metallicity, unique star formation histories, and therefore exhibit a range in /Fe. The constraints our observations place on these nucleosynthetic histories depend on the distribution of /Fe values. The observations are inconsistent at the 95 c.l., for example, with a bimodal distribution of /Fe ratios with values of 0 and +0.3 dex. On the other hand, only a few profiles are inconsistent with a scenario where all of satellites have /Fe values ranging uniformly from 0 to +0.3 dex (i.e. ). We stress, however, that the majority of values are dex indicating that even this distribution is not favored.. Higher S/N data might lower the 95 c.l. limits to 0.1 dex and pose a true challenge to multiple clump scenarios, especially as chemical evolution models achieve greater sophistication.
Similar to the ’single system’ models, the constraints on dust depletion variations are strong. With the exception of a few damped systems (notably Q1331+17, Q0347–38), the observations require that the ’clumps’ have very similar differential depletion. In other words, most of the gas comprising the individual satellites in these CDM models must have a very low porosity of gas with highly depleted levels. From the results in previous papers (e.g. Pettini et al., 1997; Prochaska & Wolfe, 2002), we knew the integrated depletion levels in the damped systems is both small and uniform. We now appreciate that the components comprising individual damped systems also are largely undepleted and with very similar differential depletion.
5 SUMMARY AND CONCLUDING REMARKS
We have performed a quantitative analysis of chemical abundance variations along the sightlines through 13 damped Ly systems. These systems each have velocity width , i.e., large enough base-line to examine chemical uniformity. We performed several sets of Monte-Carlo simulations to place upper limits on relative abundance variations. To our surprise, the majority of DLA exhibit a high degree of chemical uniformity. In most cases, the dispersion in intrinsic abundances – the combined effects of all abundance variations – is less than 0.2 dex and the best values are generally dex.
For the ratios examined in this paper, there are three potential sources of intrinsic abundance variation: (1) nucleosynthetic enrichment; (2) differential depletion; and (3) photoionization corrections. In terms of depletion, the observed DLA uniformity contrasts with variations in differential depletion observed along sightlines through the SMC, LMC, and Milky Way. Although the latter galaxies have higher metallicity than most DLA, the difference in depletion variations is not explained solely by differences in metallicity; there is no correlation between abundance variations and metallicity in the DLA (Figure 5). For an unknown reason or reasons (perhaps related to dust destruction mechanisms), the nature of dust at high is qualitatively different from the local universe. Considering nucleosynthetic processes, the DLA abundances are more uniform than the dispersion in nucleosynthetic enrichment of the Milky Way as traced by stellar abundances. Furthermore, one observes a greater dispersion between stars in various galaxies within the local group than that observed in the gas of the DLA. Finally, photoionization calculations suggest that Si+/Fe+ can vary by over 0.2 dex between a neutral gas and a highly ionized gas (Howk & Sembach, 1999; Vladilo et al., 2001; Prochaska et al., 2002a). Our observations suggest that the cross-section of H II regions or similarly ionized gas is small for galaxies with .
The chemical uniformity of the DLA poses an important constraint on the nature of high protogalaxies. We have argued that ’single-system’ scenarios might reasonably account for the observed abundance invariance. Central to this conclusion, however, is that these protogalaxies have a small filling factor of highly depleted gas. If star formation is linked to dust-depleted molecular clouds, then our results indicate the gas relevant to star formation encompasses a very small cross-section. This conclusion is consistent with the low fraction of DLA showing molecular gas (Petitjean et al., 2000). In contrast with the single-system models, we contend the observed uniformity presents a unique challenge to the multiple-clump scenarios favored by CDM. These protogalactic clumps or ’satellites’ do not share a common gas reservoir and should have unique physical characteristics (density, metallicity) and enrichment histories. It remains to be demonstrated whether these clumps might express very similar differential depletion and nucleosynthetic enrichment patterns.
Before concluding, we wish to comment on several future observational efforts which could improve upon this paper. First, we emphasize that the results for many of the DLA in the current sample are limited by signal-to-noise. Follow-up observations of the brighter quasars might reveal uniformity at the 0.01 dex level and place qualitatively tighter constraints on processes of metal production and dust formation. Similarly, higher resolution data would enable an investigation in velocity bins of a few km s-1. Second, we would like to repeat our analysis using Zn and Si separately to better isolate the effects of depletion and nucleosynthesis. Variations in the Zn/Si ratio have been observed in at least one low DLA (Pettini et al., 2000) and we would like to examine similar variations at high . Third, it is also important to examine abundance ratios which relate to physical processes separate from the Type Ia vs. Type II enrichment and differential depletion emphasized in this paper. For example, a study on the variations of the N/ ratio within DLA would impact our understanding of star formation timescales and possibly the universality of the initial mass function (e.g. Prochaska et al., 2002b). Similarly, because the Ar0/Si+ or O0/Si+ ratios are particularly sensitive to photoionization, an analysis of these ions would help reveal processes of ionization within the DLA. Finally, a comparison of the C II∗ fine-structure line with Si and Fe resonance transitions bears on the nature of the protogalactic ISM and ultimately star formation rates (Wolfe, Prochaska, & Gawiser, 2002). Together these observations would help reveal the detailed physical properties of the gas comprising DLA protogalaxies.
References
- Bonifacio et al. (2000) Bonifacio, P., Hill, V., Molaro, P., Pasquini, L., Di Marcantonio, P., & Santin, P. 2000, A&A, 359, 663
- Brown, Wallerstein, & Zucker (1997) Brown, J.A., Wallerstein, G., & Zucker, D. 1997, AJ, 114, 180
- Fulbright (2000) Fulbright, J.P. 2000, AJ, 120, 184
- Gratton & Sneden (1991) Gratton, R.G. & Sneden, C. 1991, A&A, 241, 501
- Haehnelt et al. (1998) Haehnelt, M.G., Steinmetz, M. & Rauch, M. 1998, ApJ, 495, 647
- Howk & Sembach (1999) Howk, J.C. & Sembach, K.R. 1999, ApJ, 523, 141L
- Jenkins (1987) Jenkins, E.B. 1987, in Interstellar Processes ed. D.J. Hollenbach and H.A. Thronson, Jr. (Boston: D. Reidel Publishing Company), p. 533
- Johnson (2002) Johnson, J.A. 2002, ApJS, 139, 219
- Kauffmann (1996) Kauffmann, G. 1996, MNRAS, 281, 475
- Kobulnicky & Skillman (1997) Kobulnicky, H.A. & Skillman, E. 1997, ApJ, 489, 636
- Levshakov et al. (2002) Levshakov, S.A., Dessauges-Zavadsky, M., D’Odorico, S., & Molaro, P. 2002, ApJ, 565, 696
- Lindner, Fritze-von Alvensleben, & Fricke (1999) Lindner, U., Fritze-von Alvensleben, U., & Fricke, K.J. 1999, A&A, 341, 709
- Lopez et al. (2002) Lopez, S., Reimers, D., D’Odorico, S., & Prochaska, J.X. 2002, A&A, 385, 778
- Lu et al. (1996) Lu, L., Sargent, W.L.W., Barlow, T.A., Churchill, C.W., & Vogt, S. 1996, ApJS, 107, 475
- Maller et al. (2001) Maller, A.H., Prochaska, J.X., Somerville, R.S., & Primack, J.R. 2000, MNRAS, in press, (astro-ph/0002454)
- Matteucci & Recchi (2001) Matteucci, F. & Recchi, S. 2001, ApJ, 558, 351
- McDonald & Miralda-Escud (1999) McDonald, P. & Miralda-Escud, J. 1999, ApJ, 519, 486
- McWilliam et al. (1995) McWilliam, A., Preston, G.W., Sneden, C., & Searle,L. 1995, AJ, 109, 2757
- Mo, Mao, & White (1998) Mo, H.J., Mao, S., & White, S.D.M. 1998, MNRAS, 295, 319
- Murphy et al. (2001) Murphy, M.T., Webb, J.K., Flambaum, V.V., Dzuba, V.A., Churchill, C.W., Prochaska, J.X., Barrow, J.D., & Wolfe A.M. 2001, MNRAS, 327, 1208
- Nissen & Schuster (1997) Nissen, P.E. & Schuster, W.J. 1997, A&A, 326, 751
- Nulsen, Barcons, & Fabian (1998) Nulsen, P.E.J., Barcons, X., & Fabian, A.C. 1998, MNRAS, 301, 168
- Petitjean et al. (2000) Petitjean, P., Srianand, R., & Ledoux, C. 2000, A&A, 364, 26L
- Petitjean et al. (2002) Petitjean, P., Srianand, R., & Ledoux, C. 2002, MNRAS, 332, 383
- Pettini et al. (1994) Pettini, M., Smith, L. J., Hunstead, R. W., and King, D. L. 1994, ApJ, 426, 79
- Pettini et al. (1997) Pettini, M., Smith, L.J., King, D.L., & Hunstead, R.W. 1997, ApJ, 486, 665
- Pettini et al. (2000) Pettini, M., Ellison, S.L., Steidel, C.C., Shapely, A.L., & Bowden, D.V. 2000, ApJ, 532, 65
- Press et al. (1992) Press, W. H., Teukolsky, S.A., Vetterling, W.T., & Flannery, B.P. 1992, Numerical Recipes in FORTRAN, (New York: Cambridge University Press)
- Prochaska & Wolfe (1996) Prochaska, J. X. & Wolfe, A. M. 1996, ApJ, 470, 403
- Prochaska & Wolfe (1997b) Prochaska, J. X. & Wolfe, A. M. 1997, ApJ, 486, 73
- Prochaska & Wolfe (1998) Prochaska, J.X. & Wolfe, A.M. 1998, ApJ, 507, 113
- Prochaska & Wolfe (2000) Prochaska, J.X. & Wolfe, A.M., 2000, ApJ, 533, L5
- Prochaska & Wolfe (2002) Prochaska, J.X. & Wolfe, A.M., 2002, ApJ, 566, 68
- Prochaska et al. (2001) Prochaska, J.X., Wolfe, A.M., Tytler, D., Burles, S.M., Cooke, J., Gawiser, E., Kirkman, D., O’Meara, J.M., & Storrie-Lombardi, L. 2001, ApJS, 137, 21
- Prochaska et al. (2002a) Prochaska, J.X., Howk, J.C., O’Meara, J.M., Tytler, D., Wolfe, A.M., Kirkman, D., Lubin, D., & Suzuki, N. 2002, ApJ, in press
- Prochaska et al. (2002b) Prochaska, J.X., Henry, R.B.C., O’Meara, J.M., Tytler, D., Wolfe, A.M., Kirkman, D., Lubin, D., & Suzuki, N. 2002, PASP, in press (astro-ph/0206296)
- Savage and Sembach (1991) Savage, B. D. and Sembach, K. R. 1991, ApJ, 379, 245
- Savage and Sembach (1996) Savage, B. D. and Sembach, K. R. 1996, ARA&A, 34, 279
- Schaye (2001) Schaye, J. 2001, ApJ, 559, 1L
- Shetrone, Côté, & Sargent (2001) Shetrone, M., Côté, P., Sargent, W.L.W. 2001, ApJ, 548, 592
- Shetrone (2002) Shetrone, M. 2002, priv. comm.
- Smith et al. (2000) Smith, V.V., Suntzeff, N.B., Cunha, K., Gallino, R., Busso, M., Lambert, D.L., & Straniero, O. 2000, AJ, 119, 1239
- Stephens & Boesgaard (2002) Stephens, A. & Bosegaard, A.M. 2002, AJ, 123, 1647
- Tinsley (1979) Tinsley, B.M. 1979, ApJ, 229, 1046
- Venn (1998) Venn, K.A. 1998, ApJ, 518, 405
- Venn et al. (2001) Venn, K.A., Lennon, D.J., Kaufer, A., McCarthy, J.K., Przybilla, N., Kudritzki, R.P., Lemke, M., Skillman, E.D., & Smartt, S.J. 2001, ApJ, 547, 765
- Vladilo (1998) Vladilo, G. 1998, ApJ, 493, 583
- Vladilo et al. (2001) Vladilo, G., Centurin, M., Bonifacio, P., & Howk, J.C. 2001, ApJ, 557, 1007
- Vladilo (2002) Vladilo, G. 2002, A&A, in press, (astro-ph/0206048)
- Welty et al. (1997) Welty, D.E., Lauroesch, J.T., Blades, J.C., Hobbs, L.M., & York, D.G. 1997, ApJ, 489, 672
- Welty et al. (1999) Welty, D.E., Frisch, P.C., Sonneborn, G, & York, D.G. 1999, ApJ, 512, 636
- Welty et al. (2001) Welty, D.E., Lauroesch, J.T., Blades, J.C., Hobbs, L.M., & York, D.G. 1999, ApJ, 554, 75
- Wolfe et al. (1986) Wolfe, A.M., Turnshek, D.A., Smith, H.E., & Cohen, R.D. 1986, ApJS, 61, 249
- Wolfe, Prochaska, & Gawiser (2002) Wolfe, A. M., Prochaska, J.X., & Gawiser, E. 2002, in preparation