Another Interpretation of the Power-law type Spectrum of an Ultraluminous Compact X-ray Source in IC 342
Abstract
The ultraluminous compact X-ray sources (ULXs) generally show a curving spectrum in the 0.7–10 keV ASCA bandpass, which looks like a high temperature analogue of the disk dominated high/soft state spectra seen in Galactic black hole binaries (BHBs) at high mass accretion rates. Several ULXs have been seen to vary, and to make a transition at their lowest luminosity to a spectrum which looks more like a power law. These have been previously interpreted as the analogue of the power law dominated low/hard state in Galactic BHBs. However, the ULX luminosity at which the transition occurs must be at least 10–50 per cent of the Eddington limit assuming that their highest luminosity phase corresponds to the Eddington limit, while for the Galactic BHBs the high/soft–low/hard transition occurs at a few per cent of the Eddington limit. Here we show that the apparently power law spectrum in a ULX in IC342 can be equally well fit over the ASCA bandpass by a strongly Comptonised optically thick accretion disk with the maximum temperature of keV. Recent work on the Galactic BHBs has increasingly shown that such components are common at high mass accretion rates, and that this often characterises the very high (or anomalous) state. Thus we propose that the power law type ULX spectra are not to be identified with the low/hard state, but rather represent the Comptonisation dominated very high/anomalous state in the Galactic BHBs.
keywords:
galaxies: spiral – galaxies: individual: IC 342 – X-rays: galaxies – X-rays: binaries1 Introduction
Since the Einstein era, many ultraluminous compact X-ray sources (ULXs; Makishima et al. 2000) with X-ray luminosities have been found in spiral arms of nearby spiral galaxies (e.g., Fabbiano 1989). Such high values of exceed the Eddington limit, , for a neutron star by several orders of magnitude, and instead suggest massive (30–100 ) accreting black holes (BHs). However, it is difficult to understand how such massive BHs could form: single massive stars have extreme mass loss throughout their life, and the maximum BH mass expected is of order 10–15 (e.g. Fryer & Kalogera 2001). Since there are no nearby systems either in our galaxy or in M31 which could be easily studied then the nature of the ULX remained a mystery.
ASCA (Tanaka, Inoue, & Holt 1994) data led to a breakthrough for these objects by providing the first moderate resolution energy spectra. As reported by many authors (e.g., Makishima et al. 2000, and references therein), it is clear that the majority of the most luminous ULXs exhibit spectra which are well fitted by the multicolor disk model (MCD model; Mitsuda et al. 1984), similar to the case of Galactic/Magellanic BH binaries (BHBs) at high mass accretion rates, (e.g. Makishima et al. 1986; the review by Tanaka & Lewin 1995). This, together with the variability of these systems including periodic variation (Bauer et al. 2000; Sugiho et al. 2001) and their general association with regions of ongoing star formation (Zezas, Georgantopoulos, & Ward 1999; Roberts & Warwick 2000; Fabbiano, Zezas, & Murray 2001) has led to their identification with BHBs.
There are then three possibilities, first that these really are intermediate mass BHBs, formed perhaps via mergers of massive stars/BHs in a compact star cluster (e.g. Ebisuzaki et al. 2001). Alternatively, they could be “normal” mass () stellar BHs accreting beyond the critical accretion rate at which the disk luminosity reaches . Recent work suggests that the Eddington limit can be violated by the disk becoming clumpy (e.g., Krolik 1998; Gammie 1998; Begelman 2002 and references therein), and it has long been known observationally that super critical accretion can happen (e.g. Cir X-1). A third alternative is that these are “normal” mass BHs, but that their X-ray luminosity is strongly anisotropic (beamed), so that the bolometric luminosity is overestimated. This beaming is highly unlikely to be the relativistic beaming seen in jet sources as this generally leads to a power-law (PL) type of spectrum (e.g. blazars), very unlike the curving spectrum seen by ASCA for the majority of the ULX. However, strong anisotropy of the disk flux might be produced if the disk is geometrically thick in its inner regions. The radiation can then be strongly collimated by a funnel (e.g. Madau 1988), although the factor of 10–100 required (King et al. 2001) seems extreme. Such an extreme thick disk might be expected to form only under a super critical accretion rate. So this is merely an addendum to the high scenario, rather than an independent alternative.
All these alternatives involve an extreme of one kind - either mass, radiation luminosity or disk shape. One way to test these is to compare the ULX spectra and spectral variability with those of Galactic BHBs. This has become much more feasible in recent years with the unprecedented volume of data from the Galactic BHBs gathered by RXTE. Here we use the bright Galactic BHB transient XTE J to observationally determine the spectra and spectral variability of high disks, and show that the ULX are indeed compatible with being massive (30–100 ) BHs accreting at close to the critical accretion rate.
2 A comparison of the ULX with BHB
Here we specify the puzzles in understanding ULXs as BHs. It has long been recognized that the Galactic/Magellanic BHBs reside in either of the two distinct spectral states, the high/soft state or the low/hard state. In the hard state, in which is generally low, the BHBs exhibit a hard PL spectrum in the 2–20 keV band. By contrast, the soft state is generally seen when is high, and it is characterized by the MCD spectrum, which approximates the optically thick standard accretion disk (Shakura & Sunyaev 1973). Based on this viewpoint, the MCD-type ULXs have so far been regarded as residing in the usual soft state, even putting aside the issue of how to make the required BHs.
An increasing number of ULXs shows spectral transitions from an MCD (curving) type of spectrum to one which is better described by a hard PL. This has been interpreted as the transition to the usual hard state (e.g. Kubota et al. 2000, hereafter Paper I; La Parola et al, 2001; Mizuno 2000). However, such a straightforward analogy between ULXs and BHBs gives the following puzzles.
-
1.
The “soft state” ULXs have inner disk temperatures which are too high for their implied high masses. Equivalently, when the BH mass is estimated from the Eddington argument, with reasonable correction for a boundary condition (Kubota et al. 1998) and spectral hardening factor (Shimura & Takahara 1995) falls much below the last stable orbit for a non-spinning BH, , where is the gravitational radius. This contrasts with soft-state BHBs, where generally agrees with .
-
2.
The value of is time variable, in five bright “soft state” ULXs including the two in IC 342 (Mizuno et al. 2001). This again makes a contrast to the case of soft-state BHBs, where is approximately constant for each source.
-
3.
Assuming that the “soft state” corresponds to , the threshold luminosity for the spectral transition of ULXs (; Paper I) becomes much higher than is seen among BHBs, typically 0.01–0.03 . Of course, the MCD-state luminosity could be much below , but then the BH mass in ULXs would have to be even higher.
Makishima et al. (2000) attribute the first puzzle to an extreme BH rotation, because the last stable orbit is then reduced to , although the other two problems remain unsolved. They suggested the scenario of Kerr BHs shining at for ULXs. Following Makishima et al. (2000), Ebisawa et al. (2001) showed that, with standard Shakura-Sunyaev disks, even with Kerr BHs it is difficult to obtain the required high temperatures without super (or near) critical accretion rates. A more plausible explanation is that at high the disk structure changes from that of the standard disk due to the disk being so optically thick that radial advection of the radiation becomes important. These disks, called “slim disk” (Abramowicz et al. 1988), are different in structure from the standard disks. Pressure support becomes important, so the material is not in Keplarian rotation. The inner edge of the optically thick accretion disk is then not necessarily at the last stable orbit, but can be closer to the BH (e.g. Abramowicz et al. 1988; Watarai et al. 2000). The small and changing inner disk radius (puzzles i and ii) could be explained in a Schwarzschild metric if the disk penetrates increasingly further into the plunging region at high rather than abruptly truncating at the last stable orbit, so Mizuno et al. (2001) and Watarai, Mizuno & Mineshige (2001) proposed that MCD-type ULXs may have slim accretion disks rather than standard ones.
The inner disk radius, however, is very dependent on the viscosity prescription. For small viscosity it can decrease to for super Eddington luminosities, whereas for large viscosity it can be slightly larger than (e.g. Abramowicz et al. 1988; Artemova et al., 2001). Also, this mechanism for producing a decreasing radii can only be used for Schwarzschild BHs as in extreme Kerr BHs there is so little space between the last stable orbit and the horizon. The spectra of these slim disks have been calculated by Watarai & Mineshige (2001) (Schwarzschild, low viscosity) and Beloborodov (1998) (Schwarzschild and Kerr, high viscosity). Since some of the emission from the smallest radii is advected rather than radiated, the spectra have less high temperature emission than a standard disk, but this can be somewhat compensated by the decrease in inner radius for the Schwarzschild, low viscosity disks. Since the standard disk structure calculations have difficultly in producing the high temperatures observed from the ULX even with Kerr BHs for sub-critical rates (Ebisawa et al. 2001), then it seems unlikely that the slim disks will substantially help problems (i) and (ii) unless the accretion rate is super-critical.
Therefore it seems likely that the standard curving MCD-type ULX spectra are from super critical accretion. In which case the third puzzle becomes acute. Recently, Kubota et al. (2001a,b) has observationally suggested a novel understanding of high-luminosity accretion disks, using RXTE data on some Galactic BHBs. They have identified three distinct spectral regimes of the optically-thick accretion disk in XTE J and GRO J. Figure 1 shows their result on XTE J (the distance and inclination angle are assumed to be 5 kpc and , respectively).
-
(1).
The standard regime where remains constant when fit with MCD models, i.e. .
-
(2).
The luminous apparently standard regime where the disk luminosity rises slightly less quickly with temperature, , and the spectral shape is slightly distorted from the standard-disk one. In the literature, both this and (1) are identified as the soft state, with disk dominated spectra.
-
(3).
The intermediate anomalous regime, where the disk Comptonisation suddenly increases and the spectrum becomes much harder. This is often termed the very high state in the literature (Miyamoto et al. 1991).
Kubota et al. (2001a,b) suggested a picture for this, in which the standard regime is where the accretion flow is described by the Shakura–Sunyaev geometrically thin disk approximation. As the disk luminosity increases, this approximation breaks down, and the disk becomes slim. This theoretical picture explains both the change in spectral shape (as the hotter, inner disk emission is preferentially advected rather than radiated) and the different – relationship (Watarai et al. 2000) seen in the apparently standard regime, although for the likely mass/distance of XTE J then the transition threshold appears at , rather than at the predicted . It should be noted that, though Comptonisation in the disk can shift the apparent disk temperature/radius as measured by MCD models, the effect of this is less important at high than at low (Merloni, Fabian & Ross 2000), opposite to the observed behaviour on the - plane.
The clear observational result is that the high Galactic BHBs show a variety of spectral shapes, which correlate fairly well with . Overlaid on the BHB data in Fig. 1 are the results from fitting several spectra from the ULX IC 342 source 1 with the MCD model (as in Mizuno et al. 2001, except that an inclination angle of is assumed). We thus notice a clear similarity between the ULX behaviour and that of XTE J in its apparently standard regime. This similarity argues for a slim disk interpretation of ULX spectra, as first suggested by Mizuno et al. (2001). As to the MCD-type spectrum of ULXs, we here simply point out its similarity to the apparently standard regime of BHBs, although to get the same temperature from a much more massive BH requires that the disk should be accreting at a correspondingly larger fraction of the critical rate. Overlaid on Fig.1 is the standard disk - relation for 10, 30 and 100 solar mass Schwarzchild and Kerr (a=0.55) black holes.
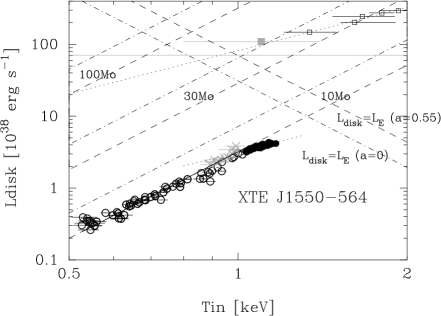
In Fig.1, the horizontal solid line indicates the 0.7–10 keV luminosity of IC 342 source 1 in 2000, when it made a spectral transition into the PL-type spectrum. The extrapolated 1–30 keV luminosity in the PL-type spectrum is close to in the dimmest MCD spectral state (the 1993 data). This illustrates the problem (iii) above; if we require that the ULX is shining at close to , then this PL-type state also has a luminosity close to , so it is unlike a usual low/hard state for the stellar BHBs, even though it has a characteristic PL spectral shape of the low/hard state.
Here we propose instead that the PL-type spectrum seen in the ULX marks a transition to the Comptonised anomalous regime rather than the usual low/hard state.
3 Reanalysis of PL-type spectrum
In these few years, our understanding of both ULXs and stellar BHBs has thus made rapid progress observationally and theoretically. This condition makes us possible to re-consider the PL-type ULXs and solve the third puzzle presented in §2. Accordingly, we re-examine the GIS data of IC 342 source 1 in 2000, the longest observation among the PL-type ULXs. The observational details are given in Paper I and Sugiho et al. (2001).
3.1 Characteristics of the spectrum
The overall GIS spectrum is well described by an absorbed PL of (Paper I). In order to investigate whether this is truly a simple PL shape, we fit the low and high energy band separately. The 0.7–4 keV GIS data give a flatter power law index, , modified by a low energy absorption of , than that obtained from fitting the 5-10 keV data with a single PL where . Figure 2 shows the extrapolation of the 0.7–4 keV spectral fit to the full GIS energy band, clearly showing that the spectrum is slightly curved. This could be due to spectral complexity around the iron line and edge energies as suggested in Paper I. However, the low/hard state PL-spectra of galactic BHB usually show an opposite curvature, with the 5-10 keV spectrum going harder than the 0.7–4 keV spectrum due to frequently observed soft excess softening the low energy spectrum, and some reflection hardening the higher energy bandpass.

Thus the subtle downwards curvature of the spectrum makes it look different from the BHB low/hard state. In order to characterize the spectral shape from another viewpoint, we compare the PL-type spectrum in 2000 with the faintest MCD-type spectra seen from the same source in 1993 (using the same data selection as Mizuno et al. 2001). As shown in table 1, the faintest 1993 GIS data is well fit with the MCD model of keV modified by low energy absorption column of . These parameters are consistent with those in Mizuno et al. (2001). Figure 3 shows the ratio of the PL data in 2000 with the best fit MCD model to the 1993 faintest data. This is remarkably flat below 3 keV, showing that the shape of the low energy spectrum does not change. A better explanation of the PL-type spectrum could be that it is not a simple PL but has a soft component which is a fainter version of that in the faintest MCD state, together with a Comptonised tail, similar to the anomalous type (or very high state) spectra seen in XTE J and GRO J.

3.2 Fit with the Comptonised model
We re-fit the same PL-type GIS spectrum incorporating Comptonisation. We use the same model as for XTE J in the anomalous regime (Kubota 2001a), i.e. an approximate model for thermal Comptonisation based on the Kompaneets equation (thcomp: Zdziarski Johnson & Magdziarz 1996, Zycki, Done, & Smith 1999). We choose a disk blackbody as the seed photon distribution, and include a separate uncomptonised MCD whose temperature is tied to that of the seed photons, as the thcomp model only calculates Comptonised component. We do not include reflection as the statistics are not sufficient to constrain the fit. The fit parameters are maximum temperature of the disk blackbody seed photon spectrum, , the electron temperature , photon index which expresses spectral shape of the thcomp below , and the normalizations of the Comptonised and uncomptonised disk photons. We could not constrain the values of with the 0.7–10 keV GIS data. Therefore, we fix at 20 keV as seen in XTE J (Wilson & Done 2001).
We show the best fit thcomp parameters in table 1. The thcomp model with a low energy absorption can successfully reproduce the observed spectrum, with . The obtained value of keV is slightly below the temperature of 1.3 keV seen in the dimmest MCD-type spectrum in 1993. Although the direct MCD component was added to the spectral model, the data do not require it with a 90 % upper limit to the direct disk emission being less than 25 % of the total 0.7–10 keV energy flux. The lack of a direct MCD component is consistent with the optical depth of inferred from the and (fixed) .
| epoch | model | range(keV) | 111Column density for absorption assuming solar abundances, in units of | or | (keV) | flux222The 0.7–10 keV source flux at the top of the atmosphere, in units of | dof |
| 2000 | PL | 0.7–4 | — | 4.0 | 71.7/57 | ||
| PL | 5–10 | — | — | 6.1 | 14.4/19 | ||
| thcomp | 0.7–10 | 3.3 | 102.2/86 | ||||
| PL333Taken from Paper I. An ionized Fe-K edge at keV is applied, with an optical depth of . | 0.7–10 | — | 3.7 | 101.1/86 | |||
| PL444Fit result by a single PL with absorption column. | 0.7–10 | — | 3.9 | 119.4/88 | |||
| MCD555Taken from Paper I | 0.7–10 | — | 2.4 | 120.5/88 | |||
| 1993 (faintest phase) | MCD | 0.7–10 | — | 6.4 | 23.1/33 |
4 Discussion
In §3, we have shown that the apparently PL-type spectra seen from IC342 in 2000 is most probably not related to the low/hard spectra in Galactic BHBs. It shows significant deviations from a PL shape, in the sense that the spectrum softens at higher energies. This is opposite to the behaviour of the Galactic BHBs in the low/hard state. We propose that the PL-type spectra are instead the analogue of the anomalous regime (also termed the very high state) spectra seen in the Galactic BHs at high luminosities. We demonstrate this by fitting Comptonisation models, thcomp, to the PL-type data, and show that they can indeed give as good a fit to the data as a PL continuum plus ionized edge (Paper I). If the ionized edge is not incorporated, the PL fit is significantly inferior to the thcomp fit (table 1), because of the intrinsic concaveness of the spectral shape.
Additionally, validity of this interpretation can be tested by investigating the location of the obtained result on the - plane (Fig.1). There, we also show the 0.1–100 keV thcomp luminosity, , extrapolated from the best fit model assuming isotropic emission. If the Comptonisation is from overheating of the disk (Beloborodov 1998) then this represents the disk luminosity. If instead it is from a separate corona, then the disk luminosity is amplified by Comptonisation. However, at this low compton parameter the amplification is rather low (less than a factor of 2), so we use the thcomp luminosity as our estimate for the disk luminosity and plot this with the seed photon temperature on Fig 1. The PL-type spectrum then lies nicely on the same luminosity-temperature relation as defined by the MCD-type spectra. This predicts a ULX mass between () and () if the PL-type spectrum marks the break between the standard and apparently-standard (slim disk) regimes. This break then appears at –. If instead the break is at – as in J1550 then this implies a mass of 50–250 .
Based on these observational results, including spectral softening at higher energies, X-ray luminosity, and disk temperature within the framework of the disk Comptonisation, we conclude that the PL-type spectra of IC 342 source 1 in 2000 are related to the standard MCD-type disk with strong disk Comptonisation state rather than to the low/hard state, and that the transition between 1993 and 2000 is likely an apparently standard to anomalous transition, rather than the canonical high/soft to low/hard transition.
Acknowledgements
A.K. is supported by Japan Society for the promotion of Science Postdoctoral Fellowship for Young Scientists. The present work is supported in part by Sydney Holgate fellowship in Grey College, University of Durham.
References
- [1] Abramowicz M.A. et al. 1988, ApJ, 332, 646
- [2] Artemova, I.V., Bisnovatyi-Kogan G.S., Igumenshchev I.V., Novikov I.D., 2001, ApJ, 549, 1050
- [3] Bauer F. E. et al. 2001, AJ, 122, 182
- [4] Beloborodov A.M. 1998, MNRAS, 297, 739
- [5] Begelman M.C. 2002, ApJ, 568, L97
- [6] Ebisawa K., Kubota A., Mizuno T., Zycki P., 2001, astro-ph/0106034
- [7] Ebisuzaki T. et al. 2001, ApJ, 562, L19
- [8] Fabbiano G. 1989, ARA&A, 27, 87
- [9] Fabbiano P., Zezas A., Murray S.S., 2001, ApJ, 554, 1035
- [10] Fryer C. L., Kalogera V., 2001, ApJ, 554, 548
- [11] Gammie C. F., 1998, MNRAS, 297, 929
- [12] King A. R. et al., 2001, ApJ, 552, L109
- [13] Krolik J., 1998, ApJ, 498, L13
- [14] Kubota A., 2001a, PhD Thesis, University of Tokyo
- [15] Kubota A. et al. 1998, PASJ, 50, 667
- [16] Kubota A. et al. 2000, ApJ, 547, L119 (Paper I)
- [17] Kubota A., Makishima K., Ebisawa K. 2001b, ApJ, 560, L147
- [18] La Parola V. et al. 2001, ApJ, 556, L47
- [19] Madau P. 1988, ApJ, 327, 116
- [20] Makishima K. et al. 1986, ApJ, 308, 635
- [21] Makishima K. et al. 2000, ApJ, 535, 632
- [22] Merloni A., Fabian A.C., Ross R.R. 2000, MNRAS, 313, 193
- [23] Mitsuda K. et al. 1984, PASJ, 36, 741
- [24] Miyamoto S., Kimura K., Kitamoto S., Dotani T., Ebisawa K. 1991, ApJ, 383, 784
- [25] Mizuno T., 2000, PhD Thesis, University of Tokyo
- [26] Mizuno T., Kubota A., Makishima K., 2001, ApJ, 554, 1282
- [27] Roberts T., Warwick B., 2000, MNRAS, 315, 98
- [28] Shakura N.I., Sunyaev, R.A., 1973, A&A, 24, 337
- [29] Shimura T. & Takahara F. 1995, ApJ 445, 780
- [30] Sugiho M. et al. 2001, ApJ, 561, L73
- [31] Tanaka Y., Inoue H., & Holt S. 1994, PASJ, 46, L37
- [32] Tanaka Y., Lewin W.H.G., 1995, in X-ray Binaries, eds. W.H.G. Lewin, J. van paradijs, and W.P.J. van den Heuvel
- [33] Watarai K., Fukue J., Takeuchi M., Mineshige S., 2000, PASJ, 52, 133
- [34] Watarai K., Mineshige S. 2001, PASJ, 53, 915
- [35] Watarai K., Mizuno T., Mineshige S., 2001, ApJ, 549, L77
- [36] Wilson C.D., Done C. 2001, MNRAS, 325, 167
- [37] Zezas A.L., Georgantopoulos I., Ward M., 1999, MNRAS, 308, 302
- [38] Zdziarski A.A., Johnson W. N., Magdziarz P. 1996, MNRAS, 283, 193
- [39] Zycki P.T., Done C., Smith D.A. 1999, MNRAS, 309, 561