Millimeter-wave Searches for Cold Dust and Molecular Gas around T Tauri Stars in MBM 12
Abstract
We report results of a sensitive search for cold dust and molecular gas in the disks around 8 T Tauri stars in the high-latitude cloud MBM 12. Interferometric observations of 3 mm continuum emission in 5 fields containing 6 of the objects, and literature values for the remaining two, limit the disk masses to –0.09 M⊙ (gas+dust), for a gas:dust mass ratio of 100 and a distance of 275 pc. By coadding the 3 mm data of our five fields, we set an upper limit to the average disk mass of M⊙. Simultaneous observation of the CS =2–1 and the N2H+ 1–0 lines show no emission. Single-dish observations of the 13CO 2–1 line limit the disk mass to (5–10) M⊙ for a standard CO abundance of . Depletion of CO by up to two orders of magnitude, through freezing out or photodissociation, can reconcile these limits. These mass limits lie within the range found in the Taurus-Auriga and Oph star-forming regions (0.001–0.3 M⊙), and preclude conclusions about possible decrease in disk mass over the 1–2 Myr age range spanned by the latter two regions and MBM 12. Our observations can exclude the presence in MBM 12 of T Tauri stars with relatively bright and massive disks such as T Tau, DG Tau, and GG Tau.
1 Introduction
Characterizing the disks of young stars is an outstanding challenge in star- and planet-formation research. Millimeter emission from cold dust and molecular gas has revealed rotating disks a few hundred AU in radius (Mannings & Sargent 1997, 2000; Dutrey et al. 1996, 1998; Dutrey, Guilloteau, & Guélin 1997; Simon, Dutrey, & Guilloteau 2000) around T Tauri and Herbig Ae/Be stars, while millimeter and infrared observations have shown the mass in small dust particles to decrease gradually from the classical-T Tauri to late pre–main-sequence stage (Robberto, Beckwith, & Herbst 2000; Jayawardhana et al. 1999; Carpenter 2002). Evidence suggests that the age range of 1–3 Myr is pivotal in the disk’s evolution, when small dust in the inner disk regions starts to clear out (Haisch et al., 2001; Luhman, 2001; Hartmann, 2001). Some of the dust may have coagulated into larger, centimeter-sized objects, which are invisible to (sub-) millimeter or infrared observations. The fate of the gas that makes up 99% of the disk’s mass is only now being investigated (Thi et al., 1999; Duvert et al., 2000; Thi et al., 2001a, b; Herczeg et al., 2002; Richter et al., 2002). This paper investigates the dust- and gas-content of the disks around several young stars in the MBM 12 cloud.
The cloud MBM 12 (distance 275 pc; but see below) is only one of two high-latitude clouds known to harbor young stellar objects (YSOs); the other being MBM 20 (Sandell, Reipurth, & Gahm, 1987). Hearty et al. (2000a) identified 8 late-type young stars in MBM 12, and two main-sequence stars with unclear relation to the cloud. Luhman (2001) found four additional pre–main-sequence members from 2MASS data, and estimated the cluster’s age at Myr. Jayawardhana et al. (2001) detected mid-infrared excess toward six of the original eight objects. Based on their H equivalent line widths, these objects are classified as six classical T Tauri stars and two ‘weak-line’ T Tauri stars (Table 1 and Fig. Millimeter-wave Searches for Cold Dust and Molecular Gas around T Tauri Stars in MBM 12). Their frequency of K- (20%) and L-band infrared excesses (70%) suggests clearing of their disks (Luhman, 2001). A crucial but unresolved question is how much material, if any, still resides in more extended, outer disks. Thus far, upper limits to the millimeter continuum of only two of the T Tauri stars (E02553+2018 and LkH 264) have been reported (Pound, 1996).
The group of young stars in MBM 12 is among several nearby ‘isolated’ groups that have recently been identified and investigated for the nature of their disks (Jayawardhana, 2000; Jayawardhana & Greene, 2001). Some of these groups (the TW Hydrae Association (TWA) at pc, Kastner et al. 1997; and Chamaeleontis cluster at pc, Mamajek, Lawson, & Feigelson 1999) are far from obvious parent molecular clouds. This suggests ages for these stars of 5–10 Myr, and little circumstellar disk material is expected. The association of the MBM 12 stars with cloud material supports their younger derived age, and they may be represent an earlier epoch of groups like TWA and Cha.
Until recently, MBM 12 was thought to be the nearest star-forming cloud to the Sun, at pc (Hearty et al., 2000b). New evidence suggests it may be significantly further (Luhman, 2001), at pc. Idzi, Andersson, & Uomoto (2001) found extinction at 65, 140 and 275 pc along the MBM 12 line of sight, so the distance of the stars is unclear. We follow Luhman (2001) and adopt 275 pc, which gives the most plausible location of the stars on the the Herzsprung-Russel Diagram. In any case, the young age indicated by MBM 12’s association with cloud material and its relative proximity make it an excellent target to study circumstellar disks in detail.
This paper presents the results of sensitive millimeter-wave searches for cold dust and molecular gas associated with the six classical T Tauri stars in MBM 12 known to harbor disks for which no millimeter data exist, and the two weak-line T Tauri stars (Table 1). We did not include the newly identified members of MBM 12 (Luhman, 2001), but fortuitously include the edge-on disk source MBM 12 3C (Jayawardhana et al., 2002) which happened to fall in our field containing LkH 262 and LkH 263. Since the completion of these observations, Luhman (2001) has concluded that one object, RXJ0306.5+1921, is likely an older interloper. For completeness, we still report the data on this object. We used a millimeter interferometer to measure the continuum emission, because the high spatial resolution avoids confusion with the surrounding cloud. We use single-dish submillimeter observations of 13CO =2–1 to trace any cold ( K) and relatively low density ( cm-3) gas that may reside around the objects. Section 2 describes the observations and section 3 the resulting mass limits. Section 4 discusses these limits in the context of other nearby star-forming regions and young associations. Section 5 concludes the paper with a short summary.
2 Observations
2.1 Owens Valley Radio Observatory
The 3 mm continuum observations were carried out with the Millimeter Array at the Owens Valley Radio Observatory (OVRO)111The Owens Valley Millimeter Array is operated by the California Institute of Technology under funding from the U.S. National Science Foundation (#AST96–13717). on 2001 March 19, 20, and 24. The receivers were tuned to the frequencies of C34S =2–1 at 96.41294 GHz and the N2H+ 1–0 triplet at 93.17370 GHz ( mm), where their performance is optimum. The lines were recorded in two 7.75 MHz-wide bands of 62 channels, while the continuum signal in the upper and lower sidebands was recorded over a total bandwidth of 2 GHz. The array was in the ‘E’ configuration, with baselines between 10 and 40 k resulting in a synthesized beam of . In each eight-hour track two sources were observed by alternating between them every half hour. Source coordinates are listed in Table 1. LkH 262 and 263 are located from each other, well within the primary beam of the 10-m antennas; they were observed in a single pointing for an entire eight-hour track. The edge-on disk source MBM 12A 3C (Jayawardhana et al., 2002) is located from LkH 263 and also falls within the primary beam. The complex gain was calibrated by observations every 30 minutes of the nearby () quasar 0235+164 (flux 1.0 Jy). The phase stability was less than optimal, and only data with coherences above % were used.
Flux scaling was obtained from observations of Uranus and the quasar 3C84 (flux 6.2 Jy, bootstrapped from the Uranus data). The data were calibrated in the MMA software package (Scoville et al., 1993), and further processed with the MIRIAD package (Sault, Teuben, & Wright, 1995). The resulting 1 rms noise level of the side-band averaged continuum was 1.3–2.9 mJy in the beam. We also coadded the observed five fields, aligning the source positions (Fig. Millimeter-wave Searches for Cold Dust and Molecular Gas around T Tauri Stars in MBM 12), to derive constraints on the ‘average’ disk mass of the six objects (see Carpenter 2002).
2.2 James Clerk Maxwell Telescope
The 13CO =2–1 observations were carried out at the James Clerk Maxwell Telescope (JCMT)222 The JCMT is operated by the Joint Astronomy Centre in Hilo, Hawaii on behalf of the parent organizations Particle Physics and Astronomy Research Council in the United Kingdom, the National Research Council of Canada and The Netherlands Organization for Scientific Research. in Canadian service mode on 2001 March 23–25, April 9, May 24, and May 25. The facility receiver ‘RxA3’ was tuned to the line frequency at 220.3986765 GHz and the spectra were recorded in Digital Autocorrelation Spectrometer backend in a bandwidth of 125 MHz and a resolution of 78 kHz (0.11 km s-1). Typical system temperatures of 400–600 K were found, giving a noise rms of 67–100 mK per channel after on-source integration of 20 minutes; a main beam efficiency of 0.6 has been applied. The observations were carried out in a frequency switched mode with a throw of 8.2 MHz to compensate for atmospheric contributions. The data were analysed with the SPECX software package.
The observations were pointed at the source positions of Table 1; S18 was not observed due to time constraints. If emission was detected at that position, an integration at an offset position of was taken. If no emission at was detected, or if the emission at both positions was equal within the error, we concluded that there was no molecular gas associated with the source; in the latter case we attributed all emission to the surrounding cloud.
3 Results
3.1 Continuum emission from OVRO
The OVRO observations did not detect 3 mm continuum emission, to 3 upper limits of 4–9 mJy; for LkH 264 and E02533+2018 Pound (1996) reported upper limits at 2.7 mm with a 3 level of 15 and 11 mJy, respectively (Table 2). No C34S or N2H+ emission was detected in the OVRO data, at a 3 noise level of Jy beam-1 (3 K) in 0.40 km s-1 channels. These upper limits on the line emission do not provide useful constraints, and we will not analyse them further.
We derive upper limits on the mass traced by the continuum emission using the simplifying assumptions that the emission is optically thin and characterized by a single dust temperature and emission coefficient (see, e.g., Beckwith et al. 1990; Duvert et al. 2000). In the Rayleigh-Jeans limit valid for the observing wavelength and typical dust temperatures, the disk mass is related to the continuum flux as
| (1) |
Here, is the disk mass, is the flux, is the distance, the emissivity per unit dust mass, and the dust temperature. refers to the mass of the disk in gas and dust. We have adopted a gas:dust mass ratio of 100:1 as is found in the translucent interstellar medium. Since we measure the dust content only, our actual limits are M⊙ of dust per 1 mJy of 3 mm flux. The adopted emissivity is a value ‘typical’ for evolved dark clouds or protostellar disks (Beckwith & Sargent, 1991; Pollack et al., 1994; Ossenkopf & Henning, 1994) and is uncertain by a factor of a few. The dust temperature is uncertain by less than a factor of 2. We have used the distance of 275 pc; at 65 or 140 pc the derived mass would be smaller by factors of 18 and 4, respectively. Table 2 lists the resulting mass limits of 0.04–0.09 M⊙ (gas+dust). This includes the values of Pound (1996) for E02553+2018 (0.07) and LkH 264 (0.09 M⊙), recalculated for our adopted dust properties and temperatures and the larger distance of 275 pc.
We can place a generous upper limit to the disk’s diameter by assuming it is fully optically thick at 3 mm and geometrically thin. At 3 mm we find an upper limit of 26 AU for a flux limit of 1 mJy, and at 2.7 mm of 20 AU. The resulting limits for our sample of 50–80 AU are significantly larger than the areas of circumstellar disks that are likely to be optically thick; with cm2 g-1 (dust), a 50 AU diameter fully optically thick () disk has a mass M⊙ (gas+dust).
We also calculated the continuum flux of a disk using more realistic descriptions by Chiang & Goldreich (1997) and D’Alessio et al. (1998). Using the former model, scaled directly to 0.01 M⊙ without taking into account any changes to the disk’s internal structure, we find a flux close to that of equation (1).
The coadded five fields yield a limit on the ‘average’ disk mass for the six objects. We find a 1 rms noise level of 1 mJy, and an average disk mass below M⊙. This average includes the data on the object RXJ0306.5+1921 that Luhman (2001) conclude may not be a member of MBM 12. If we exclude this object, the resulting noise rms (1.1 mJy) and limits (0.033 M⊙) do not change significantly.
3.2 Line emission from JCMT
Four of our objects do not show 13CO 2–1 emission with a 3 value of 0.25 K; the remaining have detected emission in the range of 0.7–1.3 K, but show similar values at a position away from the star (Table 3 and Fig. Millimeter-wave Searches for Cold Dust and Molecular Gas around T Tauri Stars in MBM 12). Only for E02553+2018 does an additional component at km s-1 shows up at , likely associated with the MBM 12 cloud. We conclude that for the latter three objects all emission comes from the surrounding cloud, and that the 3 noise level of 0.25 K can be adopted as upper limit to any gas mass associated with these objects.
Following Scoville et al. (1986), who relate the integrated intensity to the beam-averaged column density of a linear rotor such as 13CO, and using a dipole moment of 0.112 Debye for 13CO and a 13CO/H2 abundance of (Lacy et al., 1994; Wilson & Rood, 1994), we find a disk (gas) mass of
| (2) |
Equation (2) assumes that the emission is optically thin and uses the observed upper limit of 0.3 K per 0.11 km s-1 channel or 0.27 K km s-1 for an adopted line width of 2 km s-1. This line width is appropriate for disks in Keplerian rotation around a 0.5 M⊙ star under most inclinations. The range in masses in equation (2) reflects the considered range excitation temperatures, 6 K 70 K. The relation reaches a minimum at K, which corresponds to the energy of the =2 level. Table 3 lists the resulting mass limits for our sample of (5–10) M⊙.
4 Discussion
Section 3 places upper limits on the mass of cold dust and gas associated with eight T Tauri stars in MBM 12. The 3 mm continuum limits the mass to –0.09 M⊙. The 13CO lines provide limits that are much lower, (5–10) M⊙. However, the abundance of molecules such as CO may be decreased as commonly observed in T Tauri disks (e.g., Dutrey, Guilloteau, & Simon 1994; Dutrey et al. 1996), possibly by freezing out onto dust grains and by photodissociation by (inter-) stellar ultraviolet photons as suggested by chemical models (e.g., Aikawa & Herbst 1999; Willacy & Langer 2000). These processes can easily reduce the CO abundance by factors of tens or a hundred, in which case the limits of Table 3 are no longer lower than those of Table 2. We stress that if CO is significantly frozen out, the gas mass of the disk does not change appreciably, since it is dominated by undepleted H2. If CO is significantly photodissociated, the total molecular gas mass may be reduced if a sizable fraction of H2 is also photodissociated.
Jayawardhana et al. (2001) report N-band excess in the six classical T Tauri stars, indicating the presence of material close to the stars. This places a lower limit to the disk mass of M⊙, well below our upper limits. The edge-on disk source MBM 12A 3C near LkH 263 (Jayawardhana et al., 2002) requires a mass of M⊙ to explain its scattered light image. This mass is comfortably bracketed by our lower and upper limits. Jayawardhana et al. model the scattered light with a distribution of dust sizes. At the observing wavelength of 3 mm, our observations are sensitive to particles much larger than those doing the infrared scattering, but both populations are connected through the adopted dust-size distribution and mass emissivity coefficients, and therefore refer to a similar mass reservoir.
With the obtained limits, the disk masses in MBM 12 are indistinguishable from those found in Taurus-Auriga and Oph of 0.001–0.3 M⊙ (Beckwith et al., 1990; Osterloh & Beckwith, 1995; André & Montmerle, 1994). We therefore cannot draw any conclusions about the evolution of disks in the 1–2 Myr age range spanned by these regions and MBM 12. While the work by Luhman (2001) suggests that the dust in the disks in MBM 12 is starting to clear out, more sensitive measurements of the dust continuum with, e.g., SCUBA or SIRTF, are needed to investigate the fate of the colder dust at larger radii. Carpenter (2002) limits the disk masses of the members of the 2 Myr cluster IC 348 to M⊙ (or 0.002 M⊙ averaged over his 95 sources), somewhat below our limits on MBM 12.
Our mass limits do exclude the presence of objects such as T Tau, GG Tau, and DG Tau with large millimeter fluxes (Beckwith et al., 1990). We would easily have detected these fluxes, at 20–40 mJy when scaled to 275 pc and extrapolated to 3 mm (adopting spectral indices between 2.5 and 4). But even in Taurus-Auriga these objects are rare, and given the small number of T Tauri stars in MBM 12 (; Luhman 2001) no such bright objects would necessarily be expected.
5 Summary
We obtained upper limits on the 3 mm continuum flux and 13CO 2–1 line intensity of eight T Tauri stars in the MBM 12 region. These limits constrain the disk masses to –0.09 M⊙ (gas+dust), not inconsistent with the distribution of masses in slightly younger regions like Taurus-Auriga and Oph ( Myr vs. Myr), and consistent with the mass of M⊙ derived for the edge-on disk of MBM 12A 3C. We exclude the presence of objects such as T Tau, GG Tau, and DG Tau with bright millimeter emission. More sensitive searches with, e.g., SCUBA and SIRTF, will probe the evolution of the cold disk material at larger radii at the moment when the inner disks start to clear.
References
- Aikawa & Herbst (1999) Aikawa, Y. & Herbst, E. 1999, A&A, 351, 233
- André & Montmerle (1994) André, P. & Montmerle, T. 1994, ApJ, 420, 837
- Beckwith & Sargent (1991) Beckwith, S. V. W. & Sargent, A. I. 1991, ApJ, 381, 250
- Beckwith et al. (1990) Beckwith, S. V. W., Sargent, A. I., Chini, R. S., & Güsten, R. 1990, AJ, 99, 924
- Carpenter (2002) Carpenter, J. M. 2002, AJ, in press (astro-ph/0205554)
- Chiang & Goldreich (1997) Chiang, E. I. & Goldreich, P. 1997, ApJ, 490, 368
- D’Alessio et al. (1998) D’Alessio, P., Canto, J., Calvet, N., & Lizano, S. 1998, ApJ, 500, 411
- Dame et al. (2001) Dame, T. M., Hartmann, D., & Thaddeus, P. 2001, ApJ, 547, 792
- Dutrey et al. (1996) Dutrey, A., Guilloteau, S., Duvert, G., Prato, L., Simon, M., Schuster, K., & Ménard, F. 1996, A&A, 309, 493
- Dutrey et al. (1997) Dutrey, A., Guilloteau, S., & Guélin, M. 1997, A&A, 317, L55
- Dutrey et al. (1998) Dutrey, A., Guilloteau, S., Prato, L., Simon, M., Duvert, G., Schuster, K., & Ménard, F. 1998, A&A, 338, L63
- Dutrey et al. (1994) Dutrey, A., Guilloteau, S., & Simon, M. 1994, A&A, 286, 149
- Duvert et al. (2000) Duvert, G., Guilloteau, S., Ménard, F., Simon, M., & Dutrey, A. 2000, A&A, 355, 165
- Haisch et al. (2001) Haisch, K. E., Lada, E. A., & Lada, C. J. 2001, ApJ, 553, L153
- Hartmann (2001) Hartmann, L. 2001, AJ, 121, 1030
- Hearty et al. (2000a) Hearty, T., Fernández, M., Alcalá, J. M., Covino, E., & Neuhäuser, R. 2000a, A&A, 357, 681
- Hearty et al. (2000b) Hearty, T., Neuhäuser, R., Stelzer, B., Fernández, M., Alcalá, J. M., Covino, E., & Hambaryan, V. 2000b, A&A, 353, 1044
- Herczeg et al. (2002) Herczeg, G. J., Linsky, J. L., Valenti, J. A., Johns-Krull, C. M., & Wood, B. E. 2002, ApJ, 572, 310
- Idzi et al. (2001) Idzi, R., Andersson, B.-G., & Uomoto, A. 2001, BAAS, 33, 1449 (#97.03)
- Jayawardhana (2000) Jayawardhana, R. 2000, Science, 288, 64
- Jayawardhana & Greene (2001) Jayawardhana, R. & Greene, T., eds. 2001, Young Stars Near Earth: Progress and Prospects, ASP Conference Series Vol. 244. (San Francisco: Astronomical Society of the Pacific)
- Jayawardhana et al. (1999) Jayawardhana, R., Hartmann, L., Fazio, G., Fisher, R. S., Telesco, C. M., & Piña, R. K. 1999, ApJ, 521, L129
- Jayawardhana et al. (2002) Jayawardhana, R., Luhman, K. L., D’Alessio, P., & Stauffer, J. R. 2002, ApJ, 571, L51
- Jayawardhana et al. (2001) Jayawardhana, R., Wolk, S. J., Barrado y Navascués, D., Telesco, C. M., & Hearty, T. J. 2001, ApJ, 550, L197
- Kastner et al. (1997) Kastner, J. H., Zuckerman, B., Weintraub, D. A., & Forveille, T. 1997, Science, 277, 67
- Lacy et al. (1994) Lacy, J. H., Knacke, R., Geballe, T. R., & Tokunaga, A. T. 1994, ApJ, 428, L69
- Luhman (2001) Luhman, K. L. 2001, ApJ, 560, 287
- Mamajek et al. (1999) Mamajek, E. E., Lawson, W. A., & Feigelson, E. D. 1999, ApJ, 516, L77
- Mannings & Sargent (2000) Mannings, V. & Sargent, A. I. 2000, ApJ, 529, 391
- Mannings & Sargent (1997) Mannings, V. G. & Sargent, A. I. 1997, ApJ, 490, 792
- Ossenkopf & Henning (1994) Ossenkopf, V. & Henning, T. 1994, A&A, 291, 943
- Osterloh & Beckwith (1995) Osterloh, M. & Beckwith, S. V. W. 1995, ApJ, 439, 288
- Pollack et al. (1994) Pollack, J. B., Hollenbach, D., Beckwith, S. V. W., Simonelli, D. P., Roush, T., & Fong, W. 1994, ApJ, 421, 615
- Pound (1996) Pound, M. W. 1996, ApJ, 457, L35
- Richter et al. (2002) Richter, M. J., Jaffe, D. T., Blake, G. A., & Lacy, J. H. 2002, ApJ, 572, L161
- Robberto et al. (2000) Robberto, M., Beckwith, S. V. W., & Herbst, T. M. 2000, in Star Formation 1999, ed. T. Nakamoto (Nobeyama: Nobeyama Radio Observatory), 231
- Sandell et al. (1987) Sandell, G., Reipurth, B., & Gahm, G. 1987, A&A, 181, 283
- Sault et al. (1995) Sault, R. J., Teuben, P. J., & Wright, M. C. H. 1995, in ASP Conf. Ser. 77: Astronomical Data Analysis Software and Systems IV, ed. R. A. Shaw, H. E. Payne, & J. J. E. Hayes (San Francisco: Astronomical Society of the Pacific), 433
- Scoville et al. (1993) Scoville, N. Z., Carlstrom, J. E., Chandler, C. J., Phillips, J. A., Scott, S. L., Tilanus, R. P. J., & Wang, Z. 1993, PASP, 105, 1482
- Scoville et al. (1986) Scoville, N. Z., Sargent, A. I., Sanders, D. B., Claussen, M. J., Masson, C. R., Lo, K. Y., & Phillips, T. G. 1986, ApJ, 303, 416
- Simon et al. (2000) Simon, M., Dutrey, A., & Guilloteau, S. 2000, ApJ, 545, 1034
- Thi et al. (1999) Thi, W., van Dishoeck, E. F., Blake, G. A., van Zadelhoff, G., & Hogerheijde, M. R. 1999, ApJ, 521, L63
- Thi et al. (2001a) Thi, W. F., Blake, G. A., van Dishoeck, E. F., van Zadelhoff, G. J., Horn, J. M. M., Becklin, E. E., Mannings, V., Sargent, A. I., van den Ancker, M. E., & Natta, A. 2001a, Nature, 409, 60
- Thi et al. (2001b) Thi, W. F., van Dishoeck, E. F., Blake, G. A., van Zadelhoff, G. J., Horn, J., Becklin, E. E., Mannings, V., Sargent, A. I., van den Ancker, M. E., Natta, A., & Kessler, J. 2001b, ApJ, 561, 1074
- Willacy & Langer (2000) Willacy, K. & Langer, W. D. 2000, ApJ, 544, 903
- Wilson & Rood (1994) Wilson, T. L. & Rood, R. 1994, ARA&A, 32, 191
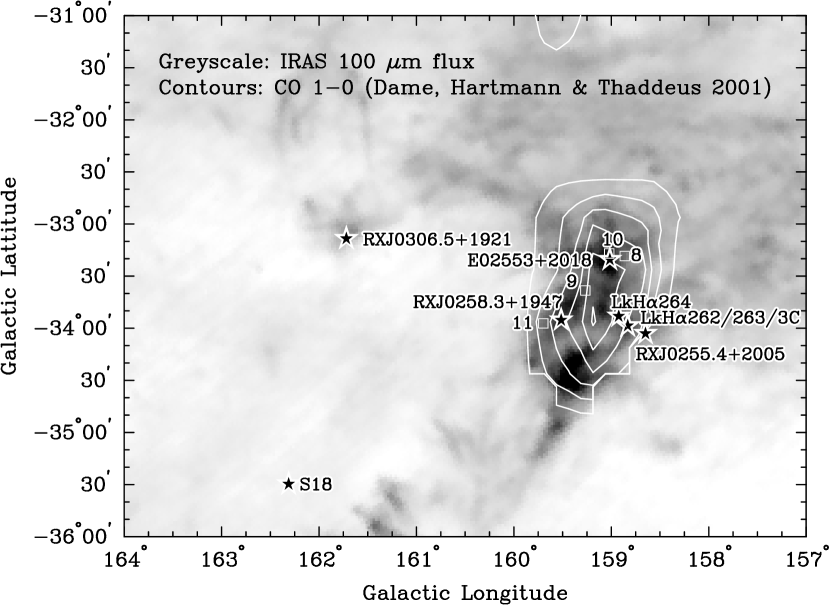
Positions of the eight MBM 12 T Tauri stars studied in this paper (star symbols) superposed on the IRAS 100 m emission (greyscale) and CO =2–1 emission (contours, at 2, 4, 6, … K km s-1; Dame, Hartmann, & Thaddeus 2001). The additional four members of MBM 12 identified by Luhman 2001 are indicated by open squares. RXJ0306.5+1921 and S18 both are located – from the main core of MBM 12; Luhman (2001) concludes that S18 is a true member of the association while RXJ0306.5+1921 is likely an older interloper.
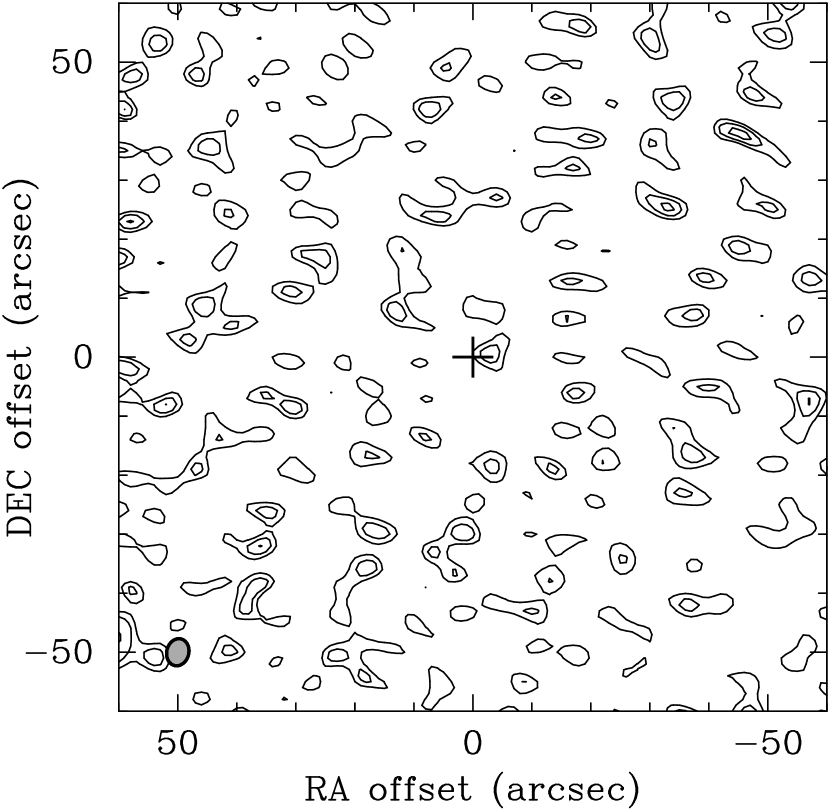
Reconstructed image of the coadded 3 mm continuum data from OVRO. The five observed fields have been shifted to a common origin (indicated by the cross), taking into account the source offsets for the field that contains both LkH 262 and 263. The coadded data place an upper limit on the ‘average’ disk mass of 0.03 M⊙ (gas+dust). Contours are drawn at 1 mJy. The synthesized beam size is and is shown in the lower left corner. This image includes the data on the likely interloper RXJ0306.5+1921; without these data the resulting image is not significantly different.
Spectra of 13CO =2–1 obtained with the JCMT toward seven of our eight objects. Solid lines show the spectra to the source position. In three cases emission was detected, and spectra at a nearby () cloud position were obtained (dotted lines). In all three cases the emission was found to be equal, within the noise level, at both positions.
| (2000) | (2000) | K-L, K-NaaFrom Jayawardhana et al. (2001). | ||
|---|---|---|---|---|
| Source | (h m s) | (∘ ′ ′′) | Excess? | ClassificationbbDefining classical T Tauri stars (cTTs) as objects having H equivalent linewidths –10 Å, and weak-line T Tauri stars (wTTs) as EW(H)–10 Å. |
| RUG0255.4+2005 | 02 55 25.7 | 20 04 53 | no | wTTs |
| LkH262 | 02 56 07.9 | 20 03 25 | yes | cTTs |
| LkH263 | 02 56 08.4 | 20 03 39 | yes | cTTs |
| LkH264 | 02 56 37.5 | 20 05 38 | yes | cTTs |
| E02553+2018 | 02 58 11.2 | 20 30 04 | yes | c/wTTsccE02553+2018 has an uncertain classification as classical or weak-line T Tauri star: it has detected infrared excess and EW(H) Å. |
| RXJ0258.3+1947 | 02 58 15.9 | 19 47 17 | yes | cTTs |
| RXJ0306.5+1921 | 03 06 33.1 | 19 21 52 | no | wTTsddLuhman (2001) conclude that RXJ0306.5+1921 is likely not a member of MBM 12, but an older interloper. |
| S18 | 03 02 21.1 | 17 10 35 | yes | cTTseeIn spite of its distance from the core of the MBM 12 cloud, Luhman (2001) conclude that S18 is a bona-fide member. |
| 3 | Beam | Upper Limit | Upper Limit | |
|---|---|---|---|---|
| Upper Limit | Size | Disk MassaaAssuming a distance of =275 pc and a gas-to-dust ratio of 100. Disk mass scales as and is independent of inclination in these optically thin cases | DiameterbbMinimum diameter of a fully optically thick disk () with a dust temperature of 25 K that would produce a flux comparable to the obtained upper limit. | |
| Source | (mJy) | (arcsec) | (M⊙) | (AU) |
| RXJ0255.4+2005 | 4 | 5.2 4.0 | 0.04 | 52 |
| LkH262 | 7 | 5.3 3.5 | 0.07 | 69 |
| LkH263 | 7 | 5.3 3.5 | 0.07 | 69 |
| LkH264 | 15cc3 Flux limits at 2.7 mm from Pound (1996). | 3.5 3.1 | 0.09 | 77 |
| E02553+2018 | 11cc3 Flux limits at 2.7 mm from Pound (1996). | 2.7 1.8 | 0.07 | 66 |
| RXJ0258.3+1947 | 5 | 5.2 4.0 | 0.05 | 58 |
| RXJ0306.5+1921 | 7 | 4.9 3.9 | 0.07 | 69 |
| S18 | 9 | 5.3 3.9 | 0.09 | 78 |
| AverageddNoise level and derived upper limit on the ‘average’ disk mass obtained by coadding the 5 fields observed with OVRO, i.e., excluding LkH 264 and E02553+2018. | 3 | 4.6 3.7 | 0.03 | 45 |
| Upper Limita,ba,bfootnotemark: | |||
|---|---|---|---|
| Mass | |||
| Source | (K) | (K) | ( M⊙) |
| RXJ0255.4+2005 | 6 | ||
| LkH262 | 7 | ||
| LkH263 | 10 | ||
| LkH264 | 10 | ||
| E02553+2018 | 9 | ||
| RXJ0258.3+1947 | 8 | ||
| RXJ0306.5+1921 | 5 | ||
| S18 |